APES Unit 3
1/74
Earn XP
Description and Tags
Name | Mastery | Learn | Test | Matching | Spaced | Call with Kai |
|---|
No analytics yet
Send a link to your students to track their progress
75 Terms
Baby boom
Significant increase in birth rates that occurred in the United States from approximately 1946 to 1964, following World War II
create changes in population dynamics as they move through the age structure—-create competition for jobs, dominate demands for goods and services and have political control
echo-boom generation 1977-2000 largest generation ever; It would cause a population decline as they die off
Carrying capacity (K)
The maximum number of individuals in a population that an ecosystem can support—based on limiting resources
population can briefly “overshoot“ (K) and then die-off happens
limiting resources like food, water, habitat, etc…
Crude birth rate
Number of births per 1,000 individuals per year
Crude death rate (CDR)
Number of deaths per 1,000 individuals per year
Demographic bottleneck
Specific demographic characteristics of a population become skewed or unbalanced, limiting the population’s ability to grow or sustain itself
demographic characteristics such as age distribution, sex ratio, reproductive rate, etc…
often result from selectives pressures, environmental changes, or human impacts
can happen even if the overall population size remains stable—happens when the demographic structure becomes skewed
ex. population of species where most individuals are too old to reproduce
ex. population heavily affected by hunting or fishing that skews the ratio
Demographic transition
A model that describes the changes in birth and death rates a country experiences as it develops economically
Stage 1: Pre-Industrial (Demographic Transition Model)
High birth and death rates
Slow/stagnant population growth
Caused by limited access to healthcare, high infant mortality, and subsistence farming
Virtually no country is in stage 1
Stage 2: Transitional/Industrializing/Developing (Demographic Transition Model)
High birth rates, declining death rates (from improvements in healthcare, sanitation, and nutrition)
Rapid increase in population growth
Caused by advances in medicine and hygiene (lower mortality rates)
Economic/Societal factors:
low GDP per capita
shorter life expectancy
declining IMR
high TFR
low literacy rate/school life expectancy for girls
ex. Africa, Guatemala, Afghanistan, etc…
Stage 3: Industrialized/Developed (Demographic Transition Model)
Declining birth rates and low death rates
Slower population growth
Caused by urbanization, access to contraception, and changing social norms regarding family size
Economic/Societal factors:
higher GDP per capita
long life expectancy
low IMR
TFR is near replacement level (~2.1)
high literacy rate/school life expectancy
Ex. Mexico, Kenya, South Africa, etc…
Stage 4: Post-Industrial/Highly Developed (Demographic Transition Model)
Low birth and death rates
Stabilized or negative population growth
Caused by high levels of education (particularly for women) and a focus on careers
Economic/Societal factors:
very high GDP per capita
longest life expectancy
TFR is below replacement level (<2.1)
ex. Canada, US, South Korea, etc…
Developed country
Countries that have a large stock of physical capital and in which most people have a high standard of living
World Bank classification
Developing country
Countries with low or middle levels of GNP per capita
World Bank classification
GNP per capita is a measurement that reflects a country’s average productivity per person
Emigration
Species going out of an environment
Family planning
The effort to plan the number and spacing of one’s children, so as to offer children and parents the best quality of life possible
Gross domestic product (GDP)
The value of all final goods and services produced in a country in a given year
one of the most common ways to measure a country’s economic health
includes things such as investments, consumption, government spending, exports minus imports, etc…
Growth rate (r)
% increase in a population (usually by year)
Immigration
Species coming into an environment
Infant mortality rate
The number of deaths of infants under one year per 1,000 live births in a given year
higher IMR → higher TFR due to families having replacement children
lower IMR → lower TFR
higher in less developed countries due to lack of access to: health care, clean water, enough food
Intrinsic rate of increase
The maximum potential for reproduction and survival within a species under ideal conditions with unlimited resources
# births -(minus) # deaths
Nonrenewable resource
Energy sources that cannot be replenished or regenerated within a human lifespan
finite resources that will eventually run out if used at a faster rate than they can be naturally formed
Per capita
Per person
Population density
Population/Area
a measure of the number of individuals living in a particular area, usually expressed as the number of people per square kilometer or square mile
Population overshoot
When a population briefly exceeds carrying capacity
ex. deer breed in fall, give birth all at once in spring; sudden spike in population = overshoot
r-selected species are more likely to grow at a rapid rate and overshoot
K-selected species have better production regulation and are more likely to maintain population at carrying capacity
Replacement-level fertility
Total fertility rate (TFR) needed for a population to replace itself without any increase or decrease
often slightly above 2 children per woman in developed countries
often higher in less developed countries due to infant mortality
Rule of 70
A way to predict the doubling time of a population size
dividing the number of 70 by the percentage population growth approximates the population doubling time (70/r)
Subsidies
In environmental science, financial support provided by governments to encourage certain economic activities or behaviors
can include direct payments, tac breaks, grants, etc…
Sustainable yield
The amount of resource that can be harvested without decreasing the food supply
Total fertility rate (TFR)
The average number of children born per woman
higher TFR = high birth rate → higher population growth rate
affected by:
age of first pregnancy
educational opportunities
family planning
governmental policies
infant mortality rates
healthcare access
Survivorship curves (S curves)
Line that shows survival rate of a cohort (group of same-aged individuals) from a population from birth to death
steep slope/faster drop in line = quicker die-off of individuals
slower drop in line = longer average lifespan
Type I curve
Early life - high survivorship because high parental care
Mid life - high survivorship because large size and population
Old age - rapid decrease in survivorship
most mammals (ex. humans)
mostly K-selected
late loss
Type II curve
Steadily decreasing survivorship throughout life
in between r and K selected
constant loss
Type III curve
Early life - high mortality (low survivorship) because little to no parental care
Mid life - few make it; slow, steady decline in survivorship
Old age - even fewer make it; slow decline in survivorship
ex. insects, fish, plants
mostly r-selected
early loss
Die-off/Die-back
Sharp decrease in population size when resource depletion (overshoot) leads to many new fawns feeding in spring
Predator vs. Prey relations and carrying capacity
Prey population increase due to low predator population
Predator population increase due to more food/prey
Increasing predator population limits prey population; leading to die-off of prey populations
Prey die-off decreases predator’s food source; leading to die-off of predator populations
Prey population increase due to low predator population (repeat and continues to repeat)
Size (population characteristic)
Total number of individuals in a given area at a given time
larger = safer from population decline
Density (population characteristic)
Number of individuals in an area
ex. 12 panthers/km^2
high density = higher competition, possibility for disease outbreak, possibility of depleting food
Distribution/Dispersion (population characteristic)
How individuals in a population are spread out compared to each other
Random (ex. trees)
Uniform (ex. territorial animals)
evenly-spaced distribution of individuals within a population
Clumped (ex. herd/group animals)
Sex ratio (population characteristic)
Ratio of males to females
closer to 50:50 is usually more ideal for breeding
die-off or bottleneck effect can lead to skewed sex ratio (not enough females), limiting population growth
Density-dependent factors (growth factors)
Factors that influence population growth based on size
ex. food, competition for habitat, predation, water, light, disease, etc…
all limit population growth based on their size
small population doesn’t experience them, large ones do
tend to be biotic
Density-independent factors (growth factors)
Factors that influence population growth independent of their size
ex. natural disasters (floods, hurricanes, tornadoes, fires…), droughts
doesn’t matter how big or small a population is, natural disasters affect both
tend to be abiotic
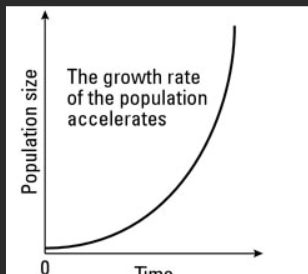
Biotic potential graph
Max. potential growth rate, with no limiting resources
may occur naturally, but limiting resources slow growth and eventually limit population to carrying capacity
exponential growth/curve
J-shaped
all species experience this when they are small and first starting
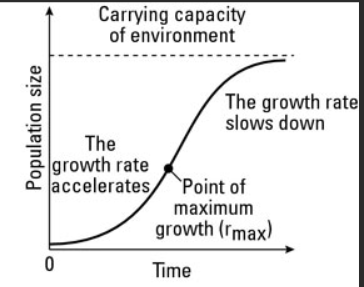
Environmental resistance graph
Initial rapid growth, then limiting factors limit population to K
logistic growth/curve
environmental resistance → factors that limit growth
S-shaped
Population growth rate equation
(immigrants + births) - (emigrations + deaths)
if = (-), population is decreasing
if = (+), population is increasing
if = 0, population is stable
add total to existing population when done (subtract technically if negative)
Fecundity
Ability to produce offspring
Why are human populations sort of different from natural populations? (population growth)
Humans can alter their resource availability and carrying capacity
Age cohort
Groups of similarly aged individuals
Pre-reproductive age cohort
0-14 years old
Reproductive age cohort
15-44 years old
Post-reproductive age cohort
45+ years old
Larger pre-reproductive cohort indicates:
Current or future growth
Roughly equal reproductive and pre-reproductive cohorts indicate:
Slight growth/stable
Reproductive cohort AND/OR post-reproductive cohort is larger:
Population decline
Extreme pyramid shape (age group cohort)
Rapid growth
often less developed countries that want children in the workforce
to remember: stairs are easy to climb, and you can rapidly increase on them
ex. Guatemala, Nigeria, Saudi Arabia, etc…
Less extreme pyramid shape (age group cohort)
Slow, stable growth
often less developed countries that want children in the workforce
to remember: a bit hard to climb, so you increase more slowly
ex. United States, Australia, Canada, etc…
House (age group cohort)
Stable, little to no growth
more well-developed nations who have a focus on education
citizens will be focused on education, not necessarily children
to remember: very hard to climb, stay stable at one/a couple stairs
ex. Spain, Portugal, Greece
Narrowest at base (age group cohort)
Declining population
more well-developed nations who have a focus on education
citizens will be focused on education, not necessarily children
to remember: practically impossible to climb stairs, so you decline (go down first stairs cause you realize you can’t climb it, so you climb down—kind of a stretch)
ex. Germany, Bulgaria, Italy
Factors in IMR decline
Access to clean water
Access to healthcare
Food supply
How does development/affluence impact TFR?
Wealthy nations generally have lower TFR
more educational access for women
more economical opportunity for women
higher access to family planning educations and contraceptives
later age of first pregnancy
less need for child to provide income through agricultural labor
How does government policy play a role in TFR?
Through coercive or noncoercive policies
forced or voluntary sterilization
ta incentives to have fewer children
microcredits or loans to women without children to start businesses
ex. China’s 1 (now 2) child policy
Malthusian theory
Earth has a human carrying capacity
likely based on food production
human population growth is happening father than growth of food production
humans will reach a k limited by food
Technological advancement
Humans can alter earth’s k with technology innovations
ex. synthesize fixation of nitrogen in 1918 leads to synthetic fertilizer, dramatically increasing food supply
Global population growth rate equation
(CBR-CDR)/10
Factors that increase population growth
Higher TFR → higher birth rate
High infant mortality rate can drive up TFR (with replacement children)
High immigration level
Increased access to clean water and healthcare (decrease death rate)
Factors that decrease population growth
High death rate
High infant mortality
Increased development (education and affluence)
Increased education for women
Delayed age of first child
Postponement of marriage age
Standard of living
What the quality of life is like for people of a country based on GDP
Life expectancy
Average a person will live to in a given country
key health indicator of standard of living
increases with access to clean water, health care, stable food resource
What do high GDP and life expectancy generally indicate?
Development and low population growth
Industrialization
The process of economic and social transition from an agrarian (farming) economy to an industrial one (manufacturing based)
Pre-Industrialized/Less developed nations
A country that has not yet made the agrarian to industrial transition
typically very poor (low GDP)
typically very high death rate and high infant mortality
high TFR for replacement children and agricultural labor
Industrializing/Developing nations
Part way through transitioning from agrarian economy to industrial economy
decreasing death rate and IMR
rising GDP
Industrialized/Developed nations
Completed transition from agrarian economy to industrial economy
very low DR and IMR
very high GDP
low TFR
Boom and bust cycle
When a population repeatedly overshoots the carrying capacity of their habitat and then crashes catastrophically
Percent birth rate equation
(Births/population)x100
Percent death rate equation
(Deaths/population)x100
Percent change
((New value-old value)/old value)x100