Geography - Carbon cycle + Energy security
1/196
Earn XP
Description and Tags
A-Level Edexcel Geography Physical
Name | Mastery | Learn | Test | Matching | Spaced |
|---|
No study sessions yet.
197 Terms
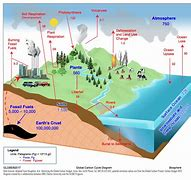
biogeochemical carbon cycle
the cycle by which carbon moves from one Earth sphere (atmosphere/lithosphere/biosphere etc.) to another
stores
where carbon is kept for a certain period of time
sources
add carbon to the atmosphere
sinks
remove carbon
terrestrial carbon store
carbonate in limestones, chalk and fossil fuels etc.
biosphere stores
organic molecules e.g. living + dead plants and animals (link to photosynthesis, respiration + decomposition)
oceans as a carbon store
dissolved CO2, CaCO3 in shells of marine life + lithified rock at the bottom of the ocean
fluxes
the movement or transfer of carbon between stores
examples of fluxes (x3)
lithosphere → atmosphere e.g. respiration (118PgC/year), volcanic eruptions (0.1PgC/year)
atmosphere → biosphere e.g. photosynthesis and rock weathering
ocean → ocean e.g. intermediate and deep ocean storage (37,100 PgC/year)
fast carbon cycle
long term geological cycle (x3)
lithification
chemical weathering
volcanic out-gassing
facts about lithification (x3)
one of the Earth’s largest stores is the Himalayas as it started off as oceanic sediment rich in CaCO3
80% of carbon in oceans is from calcifying organisms and plankton which form layers of sediment after death and get lithified under high pressure + temp e.g. limestone
when this organic matter builds up faster than it can decay, it can form fossil fuels instead of shale in anaerobic conditions
chemical weathering
when weakly acidic rainwater changes the composition of rock
process of chemical weathering (x3)
water in the atmosphere absorbs CO2 when forming raindrops, producing a weak carbonic acid
when it travels over rock, it reacts and forms calcium ions which are transported to oceans via rivers. It can also cause erosion, leading to physical rock entering oceans and joining the sediment on the seabed
it is then sequestered by calcifying organisms to form calcium carbonate for shells and skeletons (joining lithification cycle)
volcanic out-gassing
carbon is emitted into the atmosphere from the mantle and is estimated to release around 300 million tonnes of CO2 each year
Why does volcanic outgassing occur
the disturbance of pockets of CO2 in the Earth’s crust may allow pulses into the atmosphere
example of volcanic out-gassing
Mt Pinatubo
where does volcanic out-gassing occur (x3)
ocean ridges and continental rifts as rising magma is enriched in CO2
non-eruptive volcanoes that slowly diffuse CO2
subduction zones as the lithified rock with high carbon melts, adding it to the mantle
carbonate pump
the oceans surface layer contains tiny phytoplankton or micro-algae
they have shells and sequester CO2 through photosynthesis, creating calcium carbonate as their shells develop
when they die, carbon-rich micro-organisms sink to the ocean floor and remain there, contributing to the long-term carbon cycle
what is the worlds largest carbon store
oceans → 50x higher than the atmosphere
biological pump
organisms near the ocean surface absorb CO2 to use for photosynthesis, creating food for micro-organisms
this can move up the food chain as these smaller organisms are eaten by larger animals and excreted
when they die, they sink to the floor and contribute to the long-term carbon cycle
where is the biological pump most common?
shallow oceans with coral reefs as higher biological activity with more organisms and the sun being able to reach the seafloor, contributing to photosynthesis
thermohaline circulation
when salinity and density increases, cold water sinks into deep water currents (climate change = warmer waters extend further north as less saline meaning no sinking)
how does the thermohaline circulation impact the carbon cycle
warm surface waters are depleted of nutrients and CO2
as they sink, they can get enriched by dissolved carbon in cool water (as very dense)
as they rise back up, they allow CO2 to diffuse back into the atmosphere
terrestrial carbon cycle
transfer of carbon from vegetation to the soil and back to the atmosphere
soil as a carbon store
stores 20-30% of global carbon, sequestering 2x the quantity of the atmosphere and 3x more than terrestrial vegetation
spatial variations in nutrient cycle (x3)
tagia = large volumes of litter traps more carbon, limiting biodiversity and slow rate of nutrient transfer
desert = carbon locked in soils with a lot of weathering but little biomass so slow nutrient transfer
rainforests = one of largest organic stores as vast biomass and fast rate of nutrient transfer
fact about amazon rainforest
sequester 17% of all terrestrial carbon alone (more than any other land-based biome)
temporal variations in fluxes (x2)
diurnal = during the day it is higher due to photosynthesis
seasonal as northern hemisphere winter = vegetation decaying so more atmospheric CO2
tipping points
critical points whereby if they are crossed, the breakdown of the system is self-sustaining so will continue even if there is no further warming (most often = runaway warming)
impact of 2 degree impact on climate (x7)
thermohaline circulation weaken (altering transfer of heat)
melting of ice shelves increases freshwater
climate pattern shift as extratropical low pressure systems move up
stronger storm activity as increased heat energy + moisture
increased precipitation for higher latitudes
droughts e.g. Sahel, Meditteranean etc.
global temp increase (x2 more in Antarctic)
impact of 2 degree increase on ecosystems (x5)
reduce bird habitats for 314 species by 2080 in N.A and coastal areas as flooding
10% landspecies face extinction (15-40% higher in polar regions)
biodiversity changes as precipitation and temp changes
decrease in marine diversity as 80% coral bleaching and acidification of water
plant changes as face pests and diseases
impact of 2 degree increase on the hydrological cycle (x7)
rivers dry up in some resiongs
20-30% reduction in water availability in Mediterranean climate zones
small glaciers disappear which will long-term decrease discharge in glacier-fed rivers
increased humidity
heavy precipitation become common
more flash floods
permafrost thawing
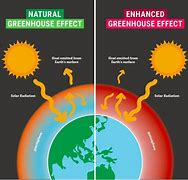
natural vs enhanced greenhouse effect
since 1800s, industrial revolution increased PPM of CO2 in the atmosphere = 280 → 442 in 2024
importance of soil to the carbon cycle (x3)
if plant residue is added to the soil at a faster rate than soil organisms that convert it to CO2, carbon will gradually be removed from the atmosphere
degraded soils are not capable of storing much carbon
lack of vegetation cover can cause soils to dry out, so emit rather than store GHG
what is ocean acidification
carbon dioxide from the atmosphere is absorbed by the oceans (roughly ¼ of CO2 produced from burning fossil fuels since the industrial revolution) which mixes with ocean water, forming carbonic acid
why is ocean acidification getting worse (x2)
increasing burning of fossil fuels releasing more CO2 to the atmosphere (22 million tonnes a day)
ocean acidity has raised 30% since 1800s, and this will double by the end of the century if we continue to pollute like we do now
impacts of ocean acidification on marine ecosystems (x5)
rising aciditiy depletes the molecules used to create shells, reducing energy for food, foragingm reproducing etc. making them weajer and more susceptible to disease
potential for a slight ecosysem shift → higher concentrations of hydrogen ions, limiting polyps ability to secrete CaCO3 for building shells, allowing weeds to take over
shells can dissolve over long-term
disrupts food chain e.g. phytoplankton and krill = embryos dying and reduced iron levels
coral bleaching = 70% under threat by 2100
how does ocean acidification affect humans (x2)
economic impacts on the fishing industry e.g. sea urchins, shrimps and other shell organisms on West Coast of USA putting fishermen in jeopardy
many people depend on it for food e.g. fatty acids, fish oils + protein
are all people/marine ecosystems equally affected (x3)
some species more susceptible e.g. shell-creating organisms
some places more susceptible e.g. cold water as absorbs more CO2 and greater abundance of plankton + 1 in 4 species live in coral reefs but only 1% of seafloor
some areas more or less dependent on fishing industry e.g. coastal/island developing nation = Maldives etc.
adaption strategies to solve ocean acidification (x2)
reducing overfishing and overharvesting (increased line fishing etc.)
marine protected areas to prevent fishing, industry and development in breeding grounds
mitigation strategy to solve ocean acidification
increase in sustainable/renewable energy to reduce release of CO2
changes in ocean health
ocean acidification, ocean temps, sea level rise, pollution + thermohaline circulation change
importance of oceans (x2)
fishing supports 500 million people, of which 90% live in LDCs (for both incomes and food)
tourism due to amenities + awe and wonder (over 100 countries benefit from tourism, worth US$9.6 billion)
case study of changes of ocean health affecting Fiji (x3)
warmer seawater leads to fish eating ciguatoxic algae which is poisonous to humans (+ numbers affected expected to increase 700x the current level)
coral bleaching due to higher temps and by 2050, ½ of all coral reefs to be severely affected
in Viti Levi, coral reef degradation will cause losses of US$4-14 million a tear by 2050 (due to less fisheries, habitats and tourism)
case study of changes of ocean health affecting Africa (x3)
warmer sea temps drive huge shoals of sardines and anchovies away impacting food chain e.g. 90% decrease in penguin species
rising sea levels increases coastal erosion = damaging infrastructure + more frequent flooding e.g. Zimbabwe = erosion eaten inland 2-3km and economic losses of 2-3% in Toga alone
scuba dive tourism industry decreased due to acidification e.g. Kenya = $15.09 million losses
case study of changes of ocean health affecting Maldives (x4)
more than 60% of coral reefs have been bleached
tourism + fishing responsible for 89% of GDP and dependent on coral reefs (contains 3% of global coral reefs)
considered a SID as 80% of land less than 1m above sea level
62% of inhabited islands report severe beach erosion and salt water intrusion
why is there a growing demand for resources? (x3)
increased population growth
increased economic growth in NICs (people getting richer e.g. China lifting 700 million out of poverty)
improved living standards
changing demand for food (x3)
by 2030, global food demand is expected to rise by 35%
poor people in developing countries spend 60-80% income on food vs less than 10% in America
growing demand for meat
changing demand for energy (x2)
in 2013, 35-40% of world energy consumption was by US, EU + Japan
between 2005 and 2030, energy needs projected to expand by 55%
how does a growing demand for resources lead to deforestation (x2)
projected loss of 23-48 million hectares by 2030 with 40% of Amazon lost by 2050
primary causes = cattle ranching (demand for beef + dairy), infrastructure development (e.g. 95% of deforestation in Brazil was within 5.5km of roads) + mining (e.g. Peru = gold mining increased by 400% since 1999)
impact of deforestation on water cycle (x6)
reduction in infiltration rates so runoff and erosion increases
flood peaks are higher and lag times are shorter
increase discharge = flooding
more eroded material is carried in river through bed load
annual rainfall is decreasing and seasonality of rainfall increases
evapotranspiration rates directly affected (rainforests generate 70% of own rainfall)
impact of deforestation on soil health (x6)
raindrop impact washes finer particles of clay and humus layer away
coarser and heavier sands left behind
CO2 released from decaying material
biomass lost due to reduction in plant growth
rapid soil erosion = loss of nutrients as no roots
increased leaching
impact of deforestation on the atmosphere (x6)
heated ground induces conventional air currents = turbulence
O2 content and transpiration rates are low
increased direct sunlight on forest floor as less shade
reduced evapotranspiration = decreased moisture
air is drier
resultant grasslands evapotranspirate 1/3 of a tropical rainforest
impact of deforestation on the biosphere (x5)
decreased evaporation from vegetation loss
lower absorption of CO2 so decreased carbon store
species diversity is decreased
reduction in habitats reduces animal diversity
biomass is lost
how does a growing demand for resources lead to afforestation
INDIA = net gain in 250-500,000 hectares and CHINA = over 500,000 hectares gained with opposite impacts of deforestation
how does a growing demand for resources lead to conversion of grasslands to farming
converting to croplands which promoted losses of biomass and soil carbon
benefits of grasslands (x7)
trap moisture and floodwater
absorb toxins from the soil
maintain healthy soils
provide cover for dry soils
maintain natural habitats
act as a carbon sink
terrestrial carbon store
disadvantages of conversion to farmlands (x7)
releases stored CO2 to the atmosphere
annual ploughing enables soil bacteria to release CO2
biofuel carbons needed carbon-based nitrogen fertiliser
biofuel crops are heavy consumers of water
cultivated soils are liable to erosion by runoff and wind
natural habitats reduced
‘lung effect’ reduced
how does a growing demand for resources lead to the decline of peatlands
anthropogenic factors of drainage for overgrazing and deliberate burning in order for commercial agriculture
peatlands
terrestrial wetland ecosystems in which the soil consists of organic matter from decaying plants with waterlogged conditions, preventing full decomposition of plant material e.g. boggy areas
where are peatlands found
in over 180 countries, especially in northern latitudes e.g. 3,500,000km2 in Northern Canada BUT still being located e.g. Cuvette Centrale (largest tropical peatland storing 30 billion tonnes of CO2) found beneath forests of Africa’s Congo Basin in 2017
value of peatlands (x5)
International Union for Conservation of Nature = one of most valuable ecosystems
rich biodiversity e.g. orangutans + Sphagnum as it thrives anaerobically and creates its own habitat by forming cup shape leaves to store water
role as a carbon regulator as sequesters more carbon than all other vegetation
providing safe drinking water, reducing flood risk for millions of people and sourcing rivers with water
preserve a record of past landscapes and people’s activities + climate change
threats to peatlands (x3)
anthropogenic factors of drainage, overgrazing and deliberate burning = approx. 15% of global peatlands drained
growth of oil palm plantations in tropical areas
misuse of peatlands causing atmospheric pollution, subsidence and fires (becoming a carbon source)
management of peatlands (x4)
mapping + detection of underground fires through heat, radiation and gases
restoration by damming drains and canals to raise water table
national legislation e.g. banned use of peat for gardeners in England as 5% of total CO2 emissions + 2021 Peat Action Plan allocated £50 million to support 35,000 restoration
international goals = 2015 UN Sustainability goal number 13 ‘Climate Action’ to be achieved by 2030
case study of peatlands in UK (x5)
cover 10% of land area and classes as one of the world’s major peat nations (sequester estimated 3.2 billion tonnes)
80% of UK peatlands have been altered or destroyed for agriculture, forestry, peat extraction + burning for grouse shooting
e.g. 25% of Denny Bog (groundwater fed) slowly degrading and peat slumping
by 2018, 95% of peatlands have some sort of protection
by 2008, 19 hectares was restored at a cost of £10,000 in the New Forest
impact of climate change on forests
increasing frequency and severity of drought which can have severe impacts on forests
Case study = Amazon rainforest (x5)
2005 one in a century drought caused a loss of 3million km2 + 2010 due to unusually warm seas in Atlantic ocean and causing a release of 8 billion tonnes of CO2
trees absorb a tenth less CO2 from the atmosphere during drought (positive feedback loop)
become a net emitter
increased dieback from tree rotting = ecosystem shift as rainforests generate 70% of own precipitation
caused irreversible effects e.g. collapse of overhead canopy cover (decreased soil stability), invasion of more flammable vegetation etc.
impact of forest loss on human wellbeing (x5)
reduction in the sustainable source of fuel e.g. timber for building and other purposes + wood for energy (inc. heating and cooking)
lungs of the earth (1/2 world trees in rainforests) = better air quality + loss will increase stress as worse decision making
loss of livestock fodder in semi-arid regions + loss of biodiversity
indigenous people driven away and more hazards
genetic pool to get medical strains from and increased soil erosion
kuznets curve
as a country develops, damage to the natural environment will increase as resources are exploited and technologies cause pollution + degradation e.g. more deforestation
BUT, it can fall again once they invest in eco-friendly technology and decrease resource use and pollution levels etc.
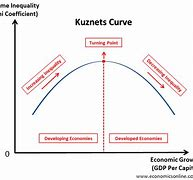
example of UK with the kuznet curve (x2)
reduced forest cover to less than 10% by end of 19th century
today, 13% of the UK’s land surface is forested as more focus placed on environmental benefits
impacting of changing temperatures on the water cycle (x4)
rise in ocean temperatures may heat air above it (latent heat transfer) but no condensation so decreased rainfall
poles getting slightly wetter as moisture travels further towards poles to reach cooler air
mass balance of glaciers may shift, leading to higher discharge
temperatures not sufficiently cool enough for condensation in some HOT areas e.g. Mediterranean
climatic impacts on the Arctic due to climate change (x5)
increasing temps as increased albedo effect
warming 4x faster than global average due to anthropogenic actions
increasing temps intensify hydrological cycle high north
increased regional evaporation and poleward moisture transport = 50-60% increase in precipitation
reduction in sea ice and increased evaporation from oceans
cryosphere impacts on the Arctic due to climate change (x5)
cumulative thickness of glaciers globally has reduced by 30m since 1970
Antarctic Sea Ice decreased to its lowest level (1 million km2 lower than long-term average)
glaciers in Hindu-Kush Himalayan region are retreating rapidly
reduced ice extent in satellite records
melting of permafrost is estimated to cause CO2 emissions of 150-200 gigatons as organisms can decompose
biological impacts on the Arctic due to climate change (x5)
many species migrate to cooler regions e.g. krill = deeper and smaller area
habitat loss in sensitive areas e.g. tundra, coral reefs + wetlands
changes in migration patterns as often seasonal (+ change in temps, food availability and water insecurity)
increased extreme weather events
invasive species
social impacts on the Arctic due to climate change (x4)
diseases transmissable between humans and animals increase as ideal for infectious diseases
affects indigenous populations e.g. INUIT people (Canada + Greenland) = affects subsistence hunting and fishing + SAAMI people (Europe and Russia) = unstable snow conditions affecting reindeer herding)
thawing permafrost makes homes and infrastructure more unstable
ice can be too thin to sustain humans e.g. island community in Diomede forced to abandon their traditional use of an ice runway
economic impacts on the Arctic due to climate change (x7)
shorter shipping routes as ice melts = decreasing travel time, fuel costs and increasing global trade
greater accessibility to different natural resources under the sea e.g. oil, gas, minerals etc.
boost tourism in Iceland and Greenland as wildlife etc.
can extend commercial fishing + fishing season
destruction of infrastructure as permafrost thaws
risk of overfishing due to krill moving meaning higher volumes of fish in one area
increased risk of coastal erosion (cost of displacement etc.)
global feedback from Arctic region due to climate change (x5)
ice/albedo → as ice/snow melts, they expose darker surfaces which absorb more solar radiation = further warming
permafrost thaw → releases GHG causing further warming
increased evaporation due to warming increases moisture levels, trapping additional heat
warming allows invasive species e.g. vegetation absorbs more sunlight causing further heating etc.
loss of sea ice exposes ocean water meaning stored heat is released
hydrological impacts on the Arctic due to climate change (x5)
seen largest global increase in temp = increased evaporation and drying up Arctic ponds
increased air temps decrease duration and extent of ice and snow cover as ablation increases
Arctic ocean could be ice free by 2037
higher earlier peak discharges due to increased spring snowmelt (between 1997 and 2007 = 19 Polar Arctic rivers had a 9.8% increase in discharge)
poleward shift of moisture transport as Eurasian arctic river discharges increases
UK energy mix (x3)
41% of total energy supply = gas, 32% oil and only 14% renewable
60% of renewable energy is bioenergy, only 6% solar due to night periods and 29% wind as not always windy
less energy secure + September 2024 = shut final coal power plant
Norway energy mix (x4)
31% oil due to North Sea (plentiful supply), 46% renewable energy and 78% of this from HEP
more energy secure as glaciers feed HEP
temporal threats of climate change meaning may have to diversify energy mix
no solar as further north so long dark winters
physical availability of energy in UK (x4)
until 1970s = dependent heavily on domestic coal from Yorkshire, NE England etc.
today = more of a reliance on imported coal and gas from North Sea
among global leaders in nuclear technology
more of a renewable focus (tidal opportunities + wind but slow growth due to issues in storage)
physical availability of energy in Norway (x4)
mountainous with steep valleys and plentiful rain = HEP = natural choice
glaciers feed rivers with meltwater
majority of oil and natural gas in Norway’s territorial waters is exported
coal from Svalbard
cost of energy for the UK (x3)
North Sea reserves = ‘secure’ alternative to dependency on Middle Eastern oil BUT depleting supply
expensive to extract so if prices decrease, becomes less viable
Rosebank Development in North Sea costs £3bn showing a high reliance
cost of energy for Norway (x3)
Norsk Hydro runs over 600 HEP sites, supplying 97.5% of renewable electricity
HEP costs are low once capital investment is complete BUT transfer of electricity from remote regions is expensive
net exporter of fossil fuels
technology in UK’s energy mix (x2)
180 years worth of coal reserves BUT current tech and environmental policy makes extraction and use expensive
80% of UK’s primary energy in 2015 = fossil fuels but tech has increased renewable e.g. Dinorwig electric mountain
technology in Norway’s energy mix (x2)
deepwater drilling tech enabled extraction of oil and gas from the North Sea
tech is necessary to store renewable energy (more important for Norway as produce more renewable)
political considerations of UK’s energy mix (x3)
public concern growing over new and proposed fracking and nuclear sites
decreasing energy security due to reliance on fossil fuels e.g. Russia vs Ukraine = higher price
privatisation of energy supply in 1980s = overseas companies decide which sources to meet UK demand e.g. France’s EDF
political considerations of Norway’s energy mix (x3)
interventionist approach preventing foreign companies from owning any primary energy source e.g. waterfalls
royalties and taxes paid to government from sale of fossil fuels + profits go to a sovereign wealth fund
preparing for a future without fossil fuels, increasing investment in environmental sustainability
level of economic development affecting UK’s energy mix (x3)
average annual housing energy costs = £1300 in 3015
energy use per capita = 2752kg oil equivalent
GDP per capita = US$41,200
level of economic development affecting Norway’s energy mix (x3)
average annual housing energy costs = £2400 in 2015
energy use per capita = 5854kg oil equivalent
GDP per capita = US$61,500
environmental priorities affecting UK’s energy mix (x4)
committed to a 40% reduction in domestic GHG emissions by 2030
intends to broaden energy mix with renewables
abandoned its ‘Green Deal’ conservation and insulation schemes in 2015
CO2 emissions down 7.13 tonnes per capita
envrionmental priorities affecting Norway’s energy mix (x5)
committed to a 40% reduction in domestic GHG emissions by 2030 compared to pre-industrial levels
3rd largest exporter of hydrocarbons + expanding output
more renewable as 89.1% of all energy from hydropower
‘Policy for Change’ = domestic target of being carbon neutral by 2050
CO2 emissions down 11.74 tonnes per capita
supply of oil + coal
31% Middle East
20% North America
12% Russia
demand of oil + coal
34% Asia (12% China)
24% North America
20% Europe
supply of gas
18% North America
15% Middle East
13% Russia
demand of gas
27% North America (22% USA)
16% Asia
10% Middle East
why has demand of conventional fossil fuel supply decreased in the Middle East (x2)
climatic conditions (despite high supply levels)
level of development / those that can afford it
energy players
those with important roles in securing energy pathways and controlling prices
energy TNCs examples
Shell, BP, PetroChina, Gazprom, Aramco (largest in the world from Saudi Arabia = $2.0T)