Individual differences
1/12
There's no tags or description
Looks like no tags are added yet.
Name | Mastery | Learn | Test | Matching | Spaced |
|---|
No study sessions yet.
13 Terms
Range of individual differences
1. Brain area size 2. Levels of activity 3. Connectivity between/within areas 4. Neurotransmitter levels
Lee Cronbach (1957) - The two disciplines of scientific psychology
- Experimental psychology vs. correlational psychology. “Individual differences have been an annoyance rather than a challenge to the experimenter. […]” “The correlational psychologist is in love with just those variables the experimenter left home to forget. He regards individual and group variation as important effects of biological and social causes. All organisms adapt to their environments, but not equally well. His question is: what present characteristics of the organism determine its mode and degree of adaptation?”
Patient Neuropsychology - the extreme end of individual differences
Natural variability (stamp collecting): • A fundamental research tool • A means of hypothesis testing More ‘continuous’ analysis with voxel-based morphometry (VBM) or voxellesion symptom mapping VBM techniques also common for healthy participants.
Brain area size - Voxel Based Morphometry (VBM) studies
Taxi Driver Study: One of the earliest VBM studies at UCL, which found that London taxi drivers had larger posterior hippocampi (involved in spatial memory) compared to bus drivers, who follow fixed routes.
Other Studies:
Social Network Size: People with larger social networks had larger middle temporal gyri and superior temporal sulci.
Moral Values: Differences in brain volume were linked to individual differences in moral values.
Political Orientation: Brain structure was correlated with political orientation, with liberals and conservatives showing differences in gray matter volume.
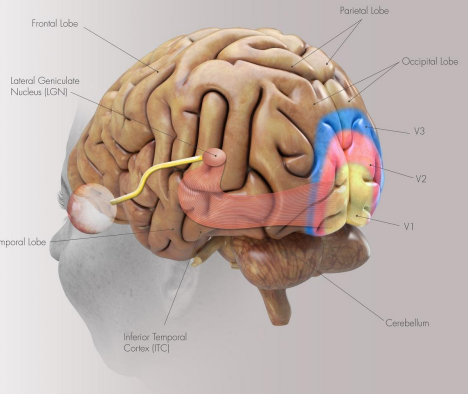
Size of functionally mapped Regions of Interest (ROI)
• Primary visual cortex (V1) • Contains retinotopic map • Secondary visual cortex (V2) • Orientation, color, depth information • Third visual cortex (V3) • Dorsal V3: motion • Ventral V3: representation of visual field • V4 – V6: • Directions of movement, simple properties of objects, e.g. general shape
Controversy and Replication Crisis
Replication Issues: Many studies on individual differences have failed to replicate, leading to skepticism about their findings.
Boekel et al. (2015): Attempted to replicate 17 findings from structural brain-behavior (SBB) correlation studies. Only one finding was successfully replicated, highlighting the need for more rigorous research practices.
Pre-Registration: To avoid questionable research practices (e.g., p-hacking), researchers are encouraged to pre-register their studies, specifying their hypotheses and methods before data collection.
Visual Cortex and Individual Differences
Primary Visual Cortex (V1): Contains a retinotopic map, where different parts of the visual field are represented in specific areas of the cortex.
Illusion Size: Studies have shown that the size of visual illusions (e.g., the Ebbinghaus illusion) correlates with the surface area of V1. People with larger V1 areas are less susceptible to visual illusions.
Replication: These findings have been replicated multiple times, providing strong evidence for the role of V1 in individual differences in visual perception.
Face Processing and Individual Differences
Study by Yovel & Kanwisher (2005):
Aim: Investigate individual differences in face processing.
Task: Participants were shown upright and inverted faces and had to determine if they were the same or different.
Findings: Activation in the fusiform face area (FFA) was correlated with better performance on the face recognition task. People with stronger FFA activation were better at recognizing faces.
Implication: The FFA plays a key role in face processing, and individual differences in FFA activation can explain differences in face recognition ability.
Hippocampus and Memory
CA3 Region: A part of the hippocampus involved in forming and retrieving memories.
Auto-Association Network: CA3 neurons are highly interconnected, allowing them to store and retrieve memories based on partial cues.
Study by Chadwick et al. (2014): Found that people with larger CA3 regions had more distinct neural patterns for different memories and were less likely to confuse similar memories.
Implication: The size and connectivity of the CA3 region can influence how well people remember and distinguish between similar events.
Dyslexia as a Connectivity Syndrome
Study by Boets et al. (2014):
Findings: People with dyslexia did not show differences in phonological representations (how they process sounds) compared to controls. However, they had reduced connectivity between the left inferior frontal gyrus (LIFG) and other brain regions involved in language processing.
Implication: Dyslexia may be more about connectivity issues between brain regions rather than deficits in specific areas.
10. Neurotransmitter Levels and Individual Differences
GABA: A neurotransmitter that inhibits neural activity. Higher levels of GABA are associated with better control over attention and reduced distractibility.
Study by Sumner et al. (2014): Found that higher GABA levels in the frontal eye field (FEF) predicted smaller distractor effects in a visual task.
Implication: GABA plays a key role in suppressing irrelevant information, allowing individuals to focus on relevant stimuli.
Lorazepam: A drug that increases GABA levels. Studies have shown that lorazepam reduces the number of perceptual switches in bistable perception tasks (where stimuli can be interpreted in two different ways).
11. Demographic Differences
Sex Differences:
Meta-Analysis by Ruigrok et al. (2014): Found that males generally have larger whole-brain volumes, but there are significant overlaps between sexes. Machine learning algorithms can predict sex with 80-90% accuracy based on brain structure.
Transgender Individuals: Brain structure in transgender individuals often falls between that of males and females, supporting the idea that gender identity has a neural basis.
Race and Ethnicity:
Study by Woo Kang et al. (2020): Compared cortical thickness between East Asian and Caucasian older adults. Found differences in gray matter volume, which could be relevant for diagnosing dementia.
Implication: Race and ethnicity are sociopolitical constructs, and differences in brain structure are more likely due to environmental and genetic factors rather than race itself.
Socioeconomic Status (SES):
Study by Kweon et al. (2022): Found that higher SES is associated with greater gray matter volume in the prefrontal cortex, lateral temporal lobe, and cerebellum.
Implication: SES influences brain development, likely through factors like nutrition, education, and stress.
Summary of Key Studies
Taxi Driver Study: London taxi drivers have larger posterior hippocampi due to their extensive spatial knowledge.
Face Processing (Yovel & Kanwisher, 2005): Activation in the fusiform face area (FFA) correlates with face recognition ability.
CA3 and Memory (Chadwick et al., 2014): Larger CA3 regions are associated with better memory discrimination.
Dyslexia (Boets et al., 2014): Dyslexia is linked to reduced connectivity in language-related brain regions.
GABA and Attention (Sumner et al., 2014): Higher GABA levels predict better control over attention and reduced distractibility.
Demographic Differences: Sex, race, and socioeconomic status influence brain structure, but these differences are complex and influenced by both genetic and environmental factors.