FDA
1/54
Earn XP
Description and Tags
Ch 2-6; Last exam 5/5!!
Name | Mastery | Learn | Test | Matching | Spaced |
|---|
No study sessions yet.
55 Terms
2: Data
A collection of facts such as numbers, words, measurements, observations or description of things.
Technically, values of qualitative or quantitative variables belonging to a set of items.
Quantitative
Values representing counts or measurements based on some quantitative trait. Typically summarized using averages / means / statistical metrics.
Quantitative Types:
Continuous - any value within a given interval, can be whole number
Discrete - only particular values, whole and half numbers
Quantitative Levels of measurement:
Interval - differences (intervals) are meaningful but ratios are not, no true zero point.
Ratio - both intervals and ratios are meaningful, has a true zero point
Qualitative
Values that can be placed in non-numerical categories, grouped into categories based on some qualitative trait. Commonly summarized using “percentages / proportions”.
Qualitative levels of measurement:
Nominal - Data that cannot be ranked/ordered, names, labels or categories. e.g eye colour
Ordinal - Data that can be arranged in order/ranking. e.g ratings
Data Characterization
Structured data - High degree of organization, strict format, easily processed. e.g relational database
Semi-structured data - Data collected in ad-hoc (when necessary/for purpose) manner, certain structure not all, mixed with data values.
Unstructured data - limited indication of type of data/format. e.g raw audio
Data Science (DS)
An inter-disciplinary field that uses computer science, statistics and machine learning to collect, clean, integrate, analyze, visualize, and interact with big data to create data products.
Difference between BI and DS
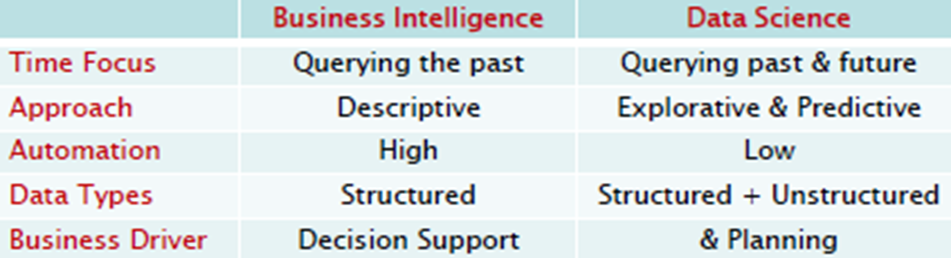
Types of Data Science Questions
Causal Analysis
Descriptive Analysis
Exploratory Analysis
Inferential Analysis
Mechanistic Analysis
Predictive Analysis
Causal Analysis
The gold standard for data analysis, it’s to find out the what happens to one variable when another variable changes.
Known as cause-and-effect relationship between variables.
Descriptive Analysis
Summarizes a characteristic of a dataset and is commonly applied to census data.
Example is a census report that summarizes the population distribution.
Exploratory Analysis
This can find relationships/trends in the data which is also known as hypothesis-generating analyses.
It is useful for defining future studies but it is not used for predicting nor the final say.
Example is a company analyzes customers’ purchases to see what they’re most likely to purchase.
Inferential Analysis
Uses a relatively small sample of data for a bigger population and can make a statement about something outside the data.
Mechanistic Analysis
Helps to understand the exact changes in variables that lead to changes in other variables for individual objects but incredibly hard to infer.
Predictive Analysis
Uses the data on some objects to accurately predict values for another object, the goal is to predict but not explain the reasons.
A/B Testing
Heavily used to compare if certain actions/variants lead to better response/outputs. Example: A/B testing on a website.
3: Descriptive Analytics
To report summary descriptions on population and sample, summarize and get a general sense of data at hand.
Histogram
Shows frequency of quantitative data (ordinal, interval, ratio)
To show numerical record of the frequency items in the dataset.
Central Tendency:
Mean
Median
Mode
Mean
The average of the dataset or the balance point but can be badly affected by extreme values (outliers) in the dataset.
It is used to find the central value of data.
Median
The middle value that divides a distribution into 2 equal halves.
The middle value of a ranked dataset.
It is not affected by outliers and is used to find the central point if data is skewed or has extreme outliers.
Mode
The most common data point.
The most frequent data in a dataset.
It is used to identify the most common values in the dataset.
Measures of dispersion:
Range
Interquartile Range
Variance
Deviation
Sum of Squared Deviations
Standard Deviation
Range
The spread or the distance between the lowest and highest values of a variable. Not robust, sensitive to extreme values.
Deviation
The distance away from the mean of a case’s score.
Standard Deviation
Measures the spread around the mean; how much data deviates from the mean. It is the square root of variance.
Variance
A measure of the spread of the recorded values on a variable
Measures the dispersion of the dataset, squared deviations from the mean.
It doesn’t use the original data since it is squared.
Interquartile Range
The distance or range between the 25th percentile and the 75th percentile (Q3-Q1).
To understand the spread and variability of the data and it focuses on the middle 50% of the data
It can also be used to detect outliers.
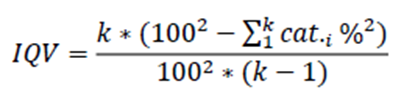
Index of Qualitative Variation (IQV)
A measure of variability for nominal variables.
It ranges from 0 to 1 (only 1 group i.e least homogeneous to maximum variability i.e most heterogenous)
Population vs Sample
Population is a large data set while sample is a small data set taken from population.
Population is the entire group of interest that you want to study and sample of a population is a subset of the population.
4: Data Visualization
It is an effective tool to perform exploratory data analysis.
The use of visual representations to explore the data, make sense of it, and communicate insights about it.
Histogram
Shows frequency of quantitative data, shows 4 main aspects: Shape, Center, Spread, Outliers.
Determining the “bins” matters. Ex: 5-10.
Small data sets – can be misleading.
Large data sets – can be quite effective.
Effectively only work with 1 variable at a time.
Boxplots
Portrays most descriptive statistics info, including IQR, Median, Range, Outliers, Variability, Skewness/Symmetry.
However, the negatives:
Over-plotting (multiple boxplots, close together)
Hides some details about distribution shape (unimodal/bimodal?)
No standard implementation in software (different software, different way)
Calculate Boxplot’s Outliers:
Below (Q1 – 1.5 X IQR)
Above (Q3 + 1.5 X IQR)
Bar chart
Comparisons across categories of data
Pie charts
Shows percentages or proportions of a total
Scatter plot
Displays relationship between 2 quantitative variables
Line chart
Displays trends over 2 quantitative axes, one of them represents continuity
Maps
Display spatial data on map
5: Data Preparation
Taking the data from its raw format, extracting relevant data and into a tidy format.
Web Scraping
Programmatically scraping information, automating the extraction and navigation of data from multiple web pages.
Used when data is not available via more direct methods such as direct download and to automatically keep track of regularly changing data.
2 Main Steps for Web Scraping
Retrieve page
Extract desired information
6: Data Mining Applications
Spam Filtering, Handwriting Character Recognition, Customer Attrition
Predicting sales amount of a product/wind velocities
Credit card fraud detection, Network Intrusion Detection
Market segmentation, Products recommendations, Shelf management
Machine Learning Methods:
Supervised - machine learns a mapping from known data of both X’s and Y’s that allows to predict an unknown value of a target variable.
Unsupervised - no particular target variable and tries to find useful structures or relationships in the data
Supervised:
Regression
Classification
Unsupervised:
Clustering
Association Rule Discovery
Sequential Pattern Discovery
Anomaly Detection
Types of Regression Models
Single (Simple) → Linear & Non-linear
Multiple (Multivariate) → Linear & Non-linear
Univariate Regression
Used to predict the numeric label value using one variable value. Can be linear / non-linear, for example: logarithmic, exponential.
Multivariate Regression
Used to predict the numeric label value using 2 or more variable values. Can also be linear / non-linear.
Linear Regression
Basic regression analysis model that allows you to identify the relationship between a dependent variable and a single independent variable.
Non-linear Regression
Non-linear relationship between a dependent and independent variable. Can capture complex relationships between the dependent and independent variables.
Types of non-linear regression: Quadratic regression, Cubic regression, Exponential regression, Logarithmic regression, Polynomial regression
Root Mean Squared Error (RMSE)
The lower the RMSE, the better the model.
Penalizes larger errors more than small errors.
Mean Absolute Error (MAE)
Less sensitive to outliers compared to RMSE.
R squared
Statistical measure that represents the proportion of the variance in the dependent variable that is explained by the independent variables in a regression model.
The value is between 0 and 1. Closer to 1, the better the model.