Stats midterm
1/38
There's no tags or description
Looks like no tags are added yet.
Name | Mastery | Learn | Test | Matching | Spaced |
|---|
No study sessions yet.
39 Terms
for MEDIAN: if a+bxi, how will the median change?
a+bmedian
for MEAN: if a+bxi, how will the mean change?
a+bmean
for VARIABILITY: if a+bxi, how will the variability change?
b²σ²
for STANDARD DEVIATION: if a+bxi, how will the standard dev change?
bσ
for RANGE: if a+bxi, how will the range change?
b(Range)
for CORRELATION COEFFICIENT: if a+bxi, how will r change?
doesn’t changeif a constant is added, r remains the same.
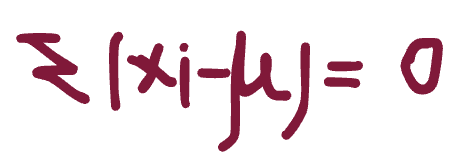
whats the sum of all mean deviations equal to?
0
what are the formulas for VARIABILITY?
σ(variability); σ(standard deviance); CV (coefficient of variance)
what is the min value for the variability and what does it represent?
0, all the variables are the same
what is the min value for the standard deviation and what does it represent?
0, because the standard dev is always positive; ) means that all the values are spread equally and that there is no variation between the data points
what does a higher value for the standard deviation represent?
that the variables are dispersed more
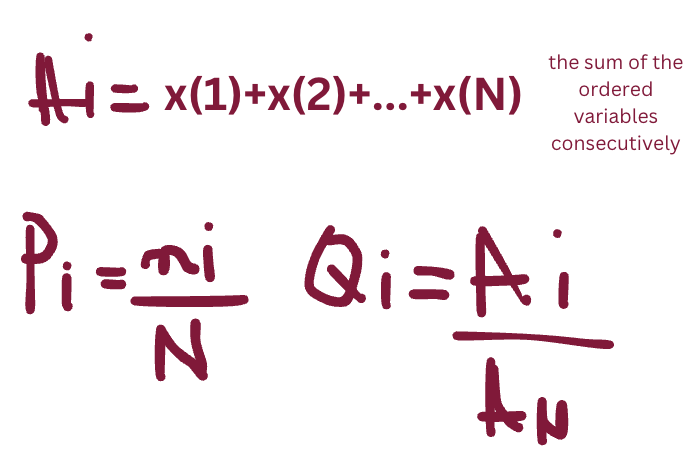
for the GINI COEFFICIENT, how do you calculate Ai, Pi, and Qi?
what are the min and max of the GINI COEFFICIENT, and what do they imply?
min: 0, perfect equality; max:1, perfect inequality
what is heterogeneity? when do e1/e2 imply heterogeneity?
all the categories have the same frequency; occurs at min, 0
what is homogeneity? when do e1/e2 imply homogeneity?
all the variables fall into the same category (are the same); at their respective max
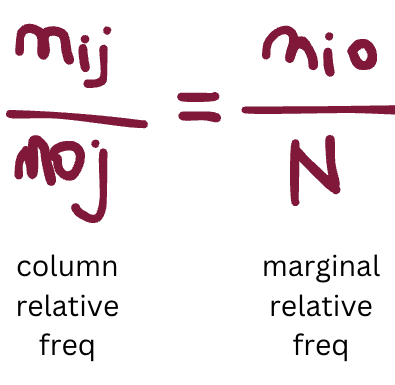
how do you calculate the column conditional relative frequency? in what case does it have to be equal to the marginal relative frequency?
it equals it when there is independence between Y and X; all row+column relative freq should equal the marginal relative freq in order for the 2 variables to be independent
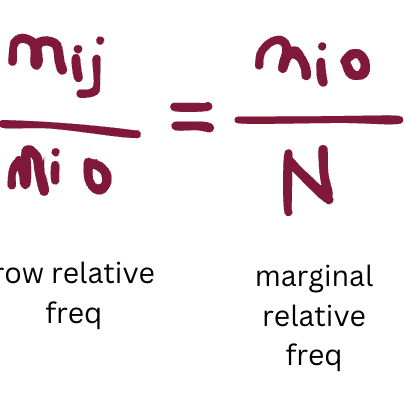
how do you calculate the row conditional relative frequency? in what case does it have to be equal to the marginal relative frequency?
it equals it when there is independence between Y and X; all row+column relative freq should equal the marginal relative freq in order for the 2 variables to be independent
what does 𝑛̂ij represent?
the expected frequency if Y and X would be independent
what formulas are used for INDEPENDENCE? what is the relative measure (most generally used)?
X², Φ; Cramer’s V is more general
what does Φ measure? what are its min and max and what do they represent?
the strenght of association between Y and x; 0, independence; max, dependence
what are the min and max for Cramer’s V and what do they represent?
0, independence; 1, dependence
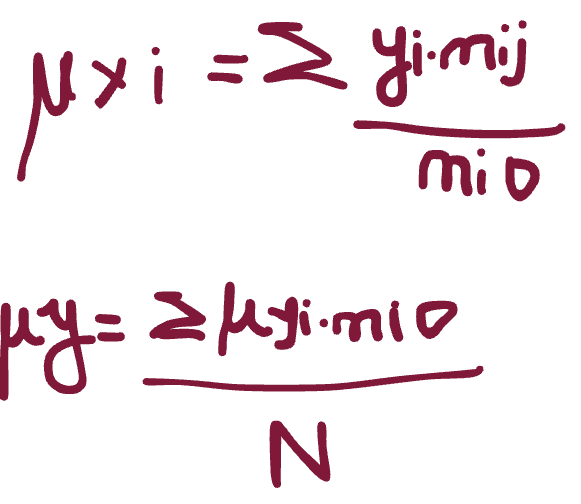
for mean dependence, how do you compute μyi? but μy?
what does the min and max values for the correlation ratio mean? what does a higher value mean?
0, independence; 1, dependence; the higher the value, he higher the dissimilarity from the mean
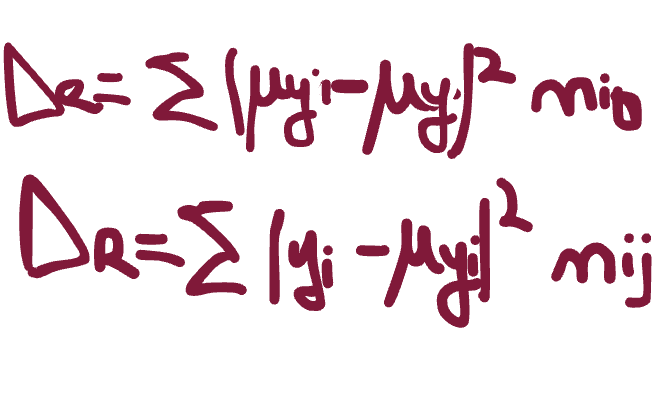
what is the extended formula for the deviance? (Dy=De+Dr)
if you plug in the means of x and y into a regression model, what do you get?
the observed values
if you plug in the standard values a regression model, what do you get?
the predicted values
how do you compute the prediction errors\residuals?
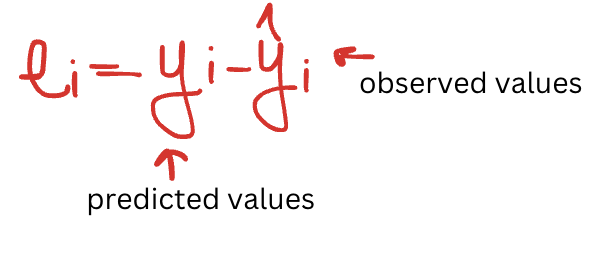
what is the sum of the prediction errors\residuals?
0
where do the regression models intersect?
(μx, μy)
what are the alternative formulas for b1?

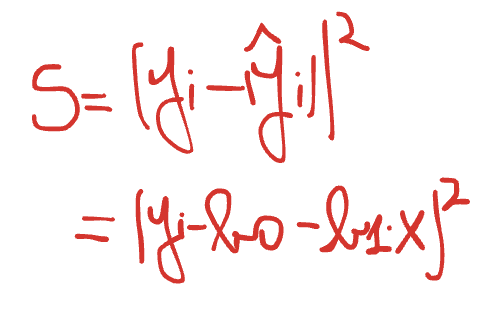
what is the formula for the least squares method (regression line)?
what does r² measure?
measures the proportion of the total variability of y explained by the regression model
what do 0 and 1 mean for r²?
0, all the points lie on a straight line; 1, really dispersed
when does r imply a negative correlation? when is the mean negative (regarding the correlation between X and Y)?
-1≤ r <0 ; the mean is negative when the correlation/slope is negative
when does r imply a positive correlation? when is the mean positive (regarding the correlation between X and Y)?
0 < r ≤ 1 ; the mean is positive when the correlation/slope is positive
what does it mean when r = 0?
r is null
do we take r as its absolute value?
yes!!!!?!??!?
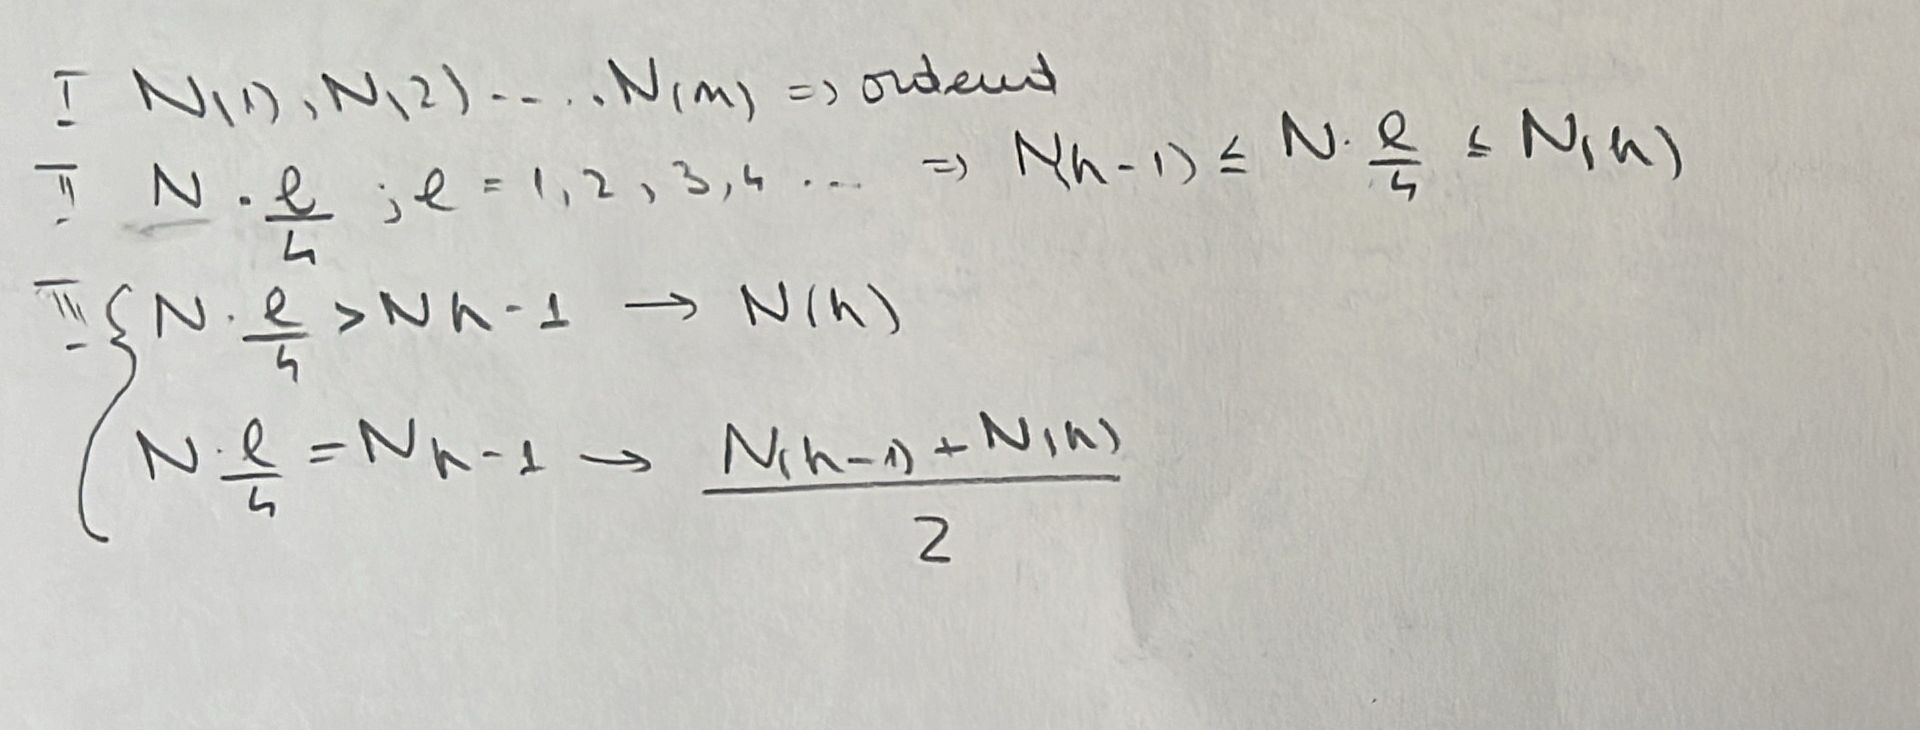
how do you compute the quartiles? general formula
how do you compute the interquartile range? what is its property? what happens to it if a+bxi?
Q3-Q1 ≥ 0 ; b(Q3-Q1)