One continuous variable
1/5
There's no tags or description
Looks like no tags are added yet.
Name | Mastery | Learn | Test | Matching | Spaced |
|---|
No study sessions yet.
6 Terms
ONE CONTINUOUS VARIABLE
What does a one-sample t-test evaluate? (t.test() or oneSampleTTest())
Formal name: Student’s t-test
It tests whether the mean of a sample differs significantly from a known or hypothesized population mean.
H₀: population mean equals a specific value
H₁: population mean does not equal a specific value
*If the population standard deviation is known: t-test becomes z-test
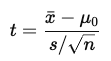
What is the t-test statistic, and how are degrees of freedom calculated?
xˉ = sample mean
μ0 = hypothesized population mean
s = sample standard deviation
n = sample size
Degrees of freedom: df = N − 1
N is the number of observations in the dataset
*exact rejection regions depend on degrees of freedom
What is Cohen’s d and how is it interpreted? (cohensD()) - Effect size
Cohen’s d measures the magnitude of difference between the sample mean and the population mean:
0.20 = small effect
0.50 = medium effect
0.80 = large effect
*larger values correspond to a greater difference from the value under H0
What are the 2 assumptions of a one-sample t-test?
The continuous variable is normally distributed (check with Shapiro-Wilk test, histogram, Q-Q plot)
if normality is violated: use the Wilcoxon signed-rank test (wilcox.test())
Observations are independent
What are key properties of the t-distribution used in t-tests?
The t-distribution has thicker tails than the normal distribution (to account for extra uncertainty in small samples)
As sample size increases, the t-distribution approaches the normal distribution
Larger absolute t-values indicate more extreme results, corresponding to a lower probability of H₀ being true