Econ 101 - Topic 2 (Demand)
0.0(0)
Studied by 1 person0%Unit 1 Mastery
0%Exam Mastery
Build your Mastery score
Supplemental Materials Call Kai
Card Sorting
1/4
Earn XP
Last updated 7:35 PM on 9/11/23
Name | Mastery | Learn | Test | Matching | Spaced | Call with Kai |
|---|
No analytics yet
Send a link to your students to track their progress
5 Terms
1
New cards
Postulates of human behavior
1. People have preferences - given a choice between goods, consumers can make a decision on which is preferred.
2. Preferences can and do differ across individuals - allows for trades to occur. (ex: Coke vs Pepsi)
3. More is preferred to less - all goods, not individual goods
4. People are willing to substitute one good for another - willing to make trade-offs
5. The more we have of a good, the less we value an additional unit of that good.
2
New cards
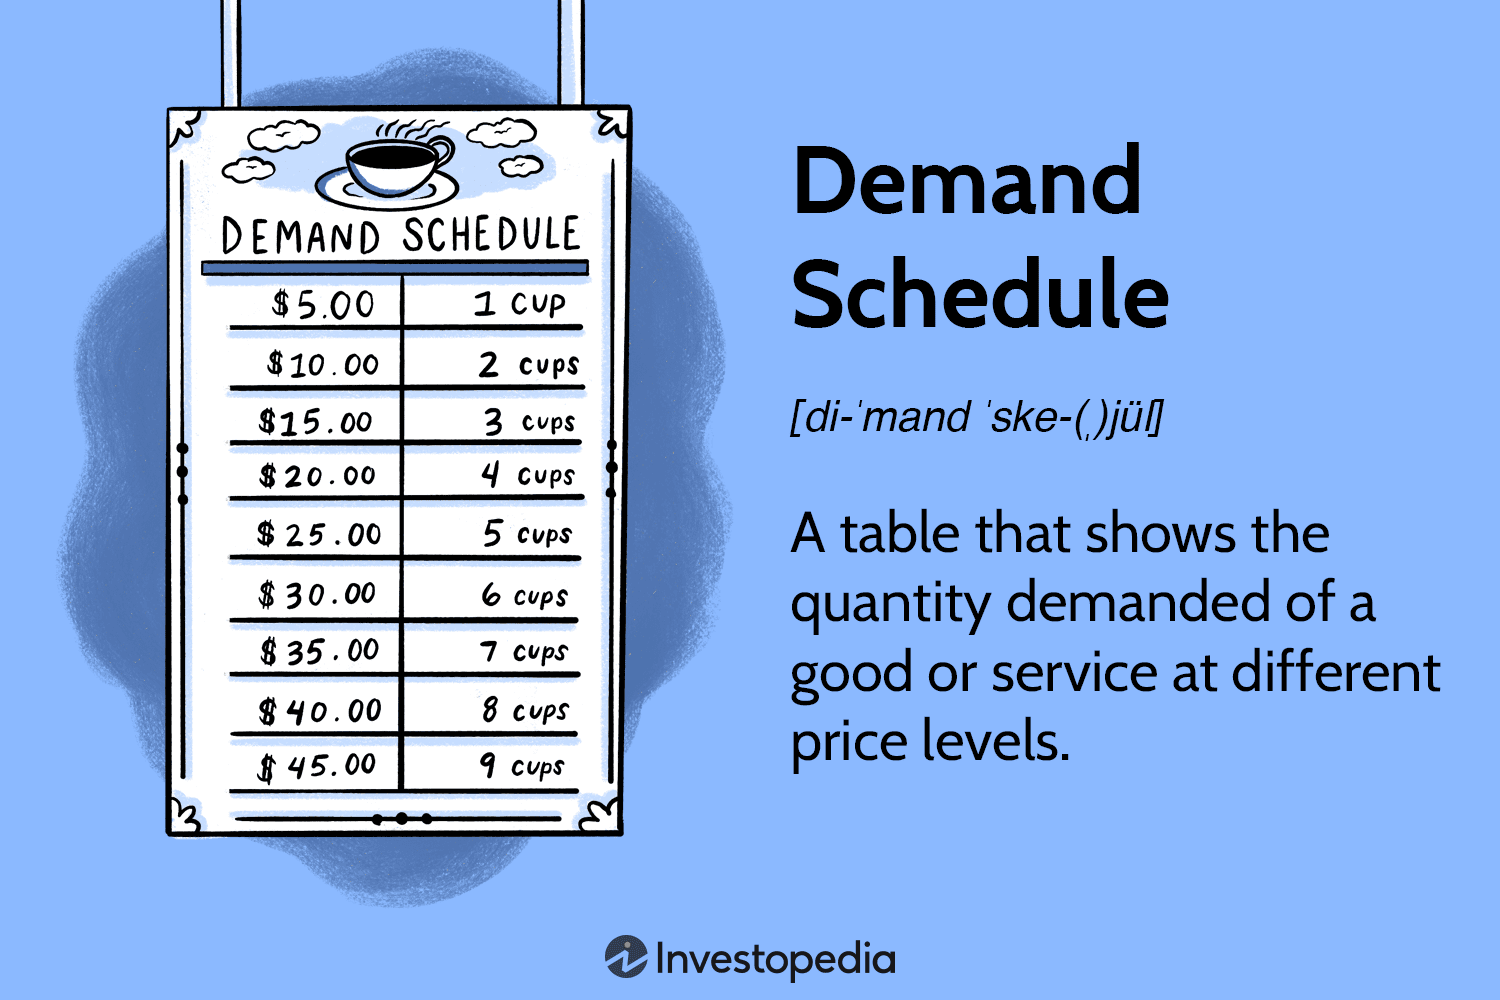
The Demand Schedule
Table shows how much of a good or service consumers will want to buy at different prices. Shows the quantity demanded of a good at various prices.
3
New cards
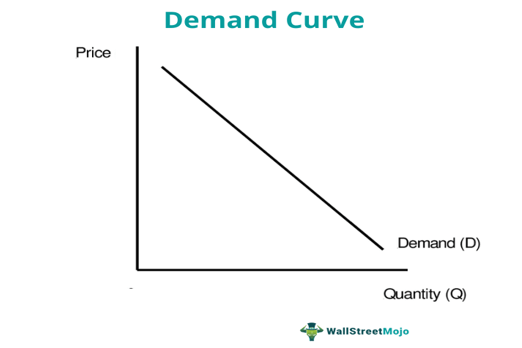
The Demand Curve
A curve in which graphically represents the quantity of a particular good a consumer is willing to buy at each price level. Summarizes relationships between quantity demanded of a good and the price of that good (holding all other factors constant)
4
New cards
True or False: No matter what the good is, we will eventually not want more of it.
True - think an all you can eat buffet.
5
New cards
True or False: A demand curve will not shift when your income goes up.
False. You are likely to buy more even if the price goes up - the curve shifts rightward since you can now afford more of that good.