Chapter 6
1/7
There's no tags or description
Looks like no tags are added yet.
Name | Mastery | Learn | Test | Matching | Spaced | Call with Kai |
|---|
No analytics yet
Send a link to your students to track their progress
8 Terms
Scatterplots
A ___________ shows the relationship between two quantitative variables measured on the same cases.
Timeplot
A ________ displays data that change over time. Often, successive values are connected with lines to show trends more clearly. Sometimes a smooth curve is added to the plot to help show long-term patterns and trends.
Association
• DIRECTION: A positive direction or ___________ means that, in general, as one variable increases, so does the other. When increases in one variable generally correspond to decreases in the other, the ___________ is negative.
• FORM: The form we care about most is straight, but you should certainly describe other patterns you see in scatterplots.
•STRENGTH: A scatterplot is said to show a strong ___________ if there is little scatter around the underlying relationship.
y-axis
response variable
x-axis
explanatory variable
In a scatterplot, you must choose a role for each variable. Assign to the ______ the ________ ________ that you hope to predict or explain. Assign to the ______ the ___________ or predictor ________ that accounts for, explains, predicts, or is otherwise responsible for the __________
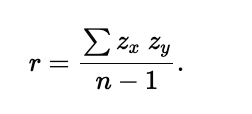
Correlation Coefficient
The ___________ ____________ is a numerical measure of the direction and strength of a linear association here:
Ladder of Powers
The ______ __ _______ places in order the effects that many re-expressions have on the data.
Re-expression
We __________ data by taking the logarithm, the square root, the reciprocal, or some other mathematical operation of all values of a variable.