Chapter 6
Scatterplots - A scatterplot shows the relationship between two quantitative variables measured on the same cases.
Timeplot - A timeplot displays data that change over time. Often, successive values are connected with lines to show trends more clearly. Sometimes a smooth curve is added to the plot to help show long-term patterns and trends.
Association -
• DIRECTION: A positive direction or association means that, in general, as one variable increases, so does the other. When increases in one variable generally correspond to decreases in the other, the association is negative.
• FORM: The form we care about most is straight, but you should certainly describe other patterns you see in scatterplots.
• STRENGTH: A scatterplot is said to show a strong association if there is little scatter around the underlying relationship.
Outlier - A point that does not fit the overall pattern seen in the scatterplot.
Response variable, Explanatory variable, x-variable, y-variable - In a scatterplot, you must choose a role for each variable. Assign to the y-axis the response variable that you hope to predict or explain. Assign to the x-axis the explanatory or predictor variable that accounts for, explains, predicts, or is otherwise responsible for the y-variable.
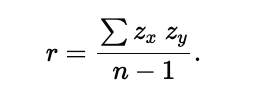
Correlation Coefficient - The correlation coefficient is a numerical measure of the direction and strength of a linear association here:
Lurking variable - A variable other than x and y that simultaneously affects both variables, accounting for the correlation between the two.
Re-expression - We re-express data by taking the logarithm, the square root, the reciprocal, or some other mathematical operation of all values of a variable.
Ladder of Powers - The Ladder of Powers places in order the effects that many re-expressions have on the data.