Comprehensive Psychology Study Notes (Transcript-Based)
1/83
There's no tags or description
Looks like no tags are added yet.
Name | Mastery | Learn | Test | Matching | Spaced |
|---|
No study sessions yet.
84 Terms
Humanistic Psychology
Personal growth and becoming your best self, with free choice and focusing on your own experiences and potential.
Cognitive Psychology
Studies how we think, perceive, remember, solve problems, and process information.
Behavioral Psychology
Learning from rewards and punishments — behavior shaped by consequences.
Biological Psychology
Looks at how the brain, chemicals, and genes control behavior.
Evolutionary Psychology
Analyzes traits and behaviors as adaptations shaped by natural selection to enhance survival and reproduction.
Psychoanalytic Psychology
Hidden desires and childhood issues shaping behavior.
Sociocultural Psychology
Explores how culture, norms, peers, and societal context shape behavior and mental processes.
Cultural Norms
Rules and expectations for behavior in a society.
Confirmation Bias
When you only notice or look for info that proves what you already believe.
Hindsight Bias
Perceiving events as having been predictable after they occur (the 'I knew it all along' effect).
Overconfidence
Overestimating one’s accuracy or knowledge.
Experimental Methodologies
Manipulate variables to test cause-and-effect relationships (change one thing to see if it causes another thing to happen)
Non-Experimental Methodologies
Observation, surveys, correlational studies; no manipulation of variables.
Case Study
In-depth examination of one person or a single group.
Correlation
Relationship between variables; does not imply causation (shows a connection between things, but doesn’t prove one causes the other)
Meta-Analysis
Statistical technique that combines results from multiple studies.
Naturalistic Observation
Observing subjects in their natural environment without interference.
Hypothesis
Testable prediction about a relationship between variables.
Falsifiable
The ability for a hypothesis to be proven wrong by data.
Operational Definitions
Clear, measurable definitions of variables (ex: happiness will be measured by the score on a 1–10 self-report survey.)
Replication
Repeating a study to assess reliability.
IV (Independent Variable)
The factor deliberately manipulated.
DV (Dependent Variable)
The outcome measured.
Confounding Variable
An outside variable that could affect results.
Population
Entire group to which results are intended to generalize.
Sample
The smaller group of people you actually test, taken from the bigger population.
Representative Sample
A small group that truly represents the bigger group.
Random Sampling
Everyone in the group has the same chance of being picked (example: putting all students’ names in a hat and drawing at random.)
Convenience Sampling
Picking people just because they’re easy to reach, but they don’t fully represent the whole group (example: only surveying your own classmates instead of students from many schools.)
Sampling Bias
Systematic error due to non-representative sampling (A mistake that happens when your sample doesn’t represent the whole group)
Generalizability
Extent to which findings apply to the broader population.
Experimental Group
Receives the treatment in an experiment.
Control Group
Does not receive the treatment in an experiment.
Placebo
Inactive treatment used to control for expectations (e.g., sugar pill).
Single-Blind
Participants do not know whether they are in the experimental or control group.
Double-Blind
Neither participants nor researchers know who is in which group.
Experimenter Bias
When researchers’ beliefs accidentally affect the results — prevented by double-blind studies (example: If a researcher expects a new drug to work, they might (without realizing it) treat those patients differently. In a double-blind study, neither the researcher nor participants know who gets the drug, so bias is reduced.)
Social Desirability Bias
Participants respond in ways they believe are socially acceptable.
Qualitative Data
Descriptive data in words.
Quantitative Data
Numerical data.
Structured Interviews
Pre-set questions asked in a fixed order.
Likert Scales
Attitude or opinion scales (e.g., 1–5).
Peer Review
Evaluation of research by other scientists.
Directionality Problem
Uncertainty about which variable causes the other in correlational studies (example: do kids watch more TV because they have lower grades, or do they have lower grades because they watch more TV)
Third Variable Problem
A separate variable explains the observed relationship between two other variables (ex: example: Ice cream sales and sunburns rise together — but the real cause is hot weather (the third variable))
Survey
Self-reported responses collected from participants.
Wording Effects
Question phrasing influences responses.
Self-Report Bias
Inaccuracies in self-reported data due to memory, social desirability, or other factors.
Institutional Review Board (IRB)
Committee that reviews and approves studies for ethical compliance.
Informed Consent
Participants understand risks and agree to participate voluntarily.
Informed Assent
Minor participants’ agreement (with parental consent) to participate.
Protection from Harm
Researchers must minimize risk and avoid lasting harm to participants.
Confidentiality
Keeping participants’ identities private.
Deception
May be used in research if necessary and harmless; participants must be debriefed afterward.
Confederates
Actors who secretly help carry out the study, posing as participants.
Debriefing
Post-study explanation of the study’s purpose and procedures.
Central Tendency
Measures of the center of a data set (Mean, Median, Mode).
Range
Difference between the highest and lowest values in a data set
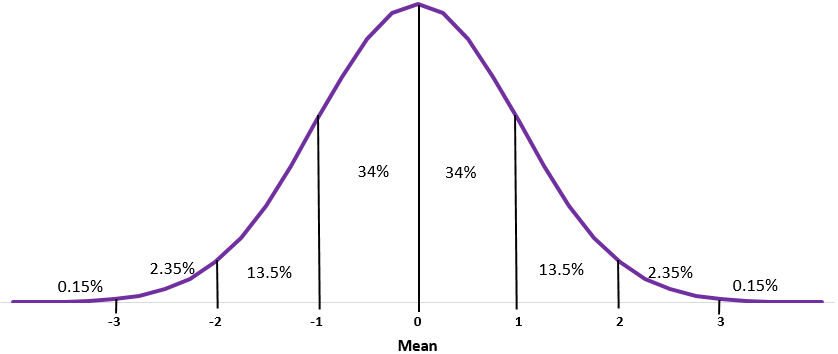
Normal Curve
A bell-shaped distribution of data where most scores fall near the mean; about 68% of scores fall within 1 standard deviation, 95% within 2, and 99% within 3.
Skewness
Asymmetry of a distribution (toward high or low values).
Bimodal Distribution
Distribution with two distinct peaks.
Percentile Rank
The percentage of people who scored the same or lower than a certain score (example: If you’re in the 70th percentile on a test, that means you scored better than 70% of the people who took it)
Regression to the Mean
Very high or low scores usually get closer to average if you test again (example: If you score unusually high on one quiz, your next score will probably be closer to your usual average, not that extreme)
Variation
Spread of scores around the center.
Standard Deviation
Typical distance of scores from the mean
Scatterplot
Graphical representation of the relationship between two variables.
Correlation Coefficient (r)
Strength and direction of a linear relationship between two variables, ranging from -1 to +1.
Effect Size
Tells you how big or strong a difference or relationship is (example: Two study methods both improve grades, but if one raises scores by 2 points and the other by 20 points, the second has a much larger effect size)
Statistical Significance (p < .05)
Probability that the observed result occurred by chance is less than 5%; a commonly used threshold for significance.
Participants
Individuals who take part in a study.
Appropriate Representation of Participants
Ensuring diversity/accuracy in the sample.
Variables (non-experimental)
Variables observed but not manipulated.
Qualitative Measurement Instruments
Tools for descriptive data (e.g., interviews, open-ended questions).
Quantitative Measurement Instruments
Tools for numerical data (e.g., surveys, scales)
Mean
Average
Median
Middle score
Mode
Most frequently occurring score.
Quantitative Inferential Data
Numerical data used to make predictions/generalizations.
Qualitative Inferential Data
Descriptive data interpreted for themes/patterns.
Variables (non-experimental)
Factors that are observed but not manipulated by the researcher. Example: studying stress levels and hours of sleep without changing either.
Central Tendency
A way to describe the “center” of a data set. Includes mean (average), median (middle score), and mode (most frequent score).
Measurement Instruments
The tools used to collect data.
Qualitative → interviews, open-ended questions, observations.
Quantitative → surveys, scales, tests, numerical measures.
Qualitative Inferential Data
Descriptive info used to find patterns/themes and make interpretations (e.g., analyzing interview transcripts).
Quantitative Inferential Data
Numerical info used to make predictions/generalizations about a population (e.g., statistical test results).