APES Unit 3 Study Guide
1/24
Earn XP
Description and Tags
Name | Mastery | Learn | Test | Matching | Spaced | Call with Kai | Chat |
|---|
No analytics yet
Send a link to your students to track their progress
25 Terms
Density Dependent
factors that affect population growth based on the population's size, such as competition, predation, and disease.
Density Independent
factors that affect population growth regardless of the population's size, such as natural disasters and climate changes.
R selected species
species that produce many offspring with low parental care, often thriving in unstable environments.
K selected
species that produce fewer offspring with high parental care, often thriving in stable environments.
Survivorship Curve
a graph that represents the number of individuals surviving at each age for a given species, illustrating patterns of mortality. Three types of survivor ship curves exist.
Type 1 Survivorship Curve
characterized by high survivorship in early and middle life, with a significant drop in survival in older age groups, typical of K-selected species.
Type 2 Survivorship Curve
characterized by a constant mortality rate throughout an organism's life, indicating that individuals are equally likely to die at any age. This curve represents species with a balanced reproductive strategy.
Type 3 Survivorship Curve
characterized by high mortality rates in early life, with only a few individuals surviving to adulthood. This curve is typical of r-selected species that produce many offspring but invest little in their care.
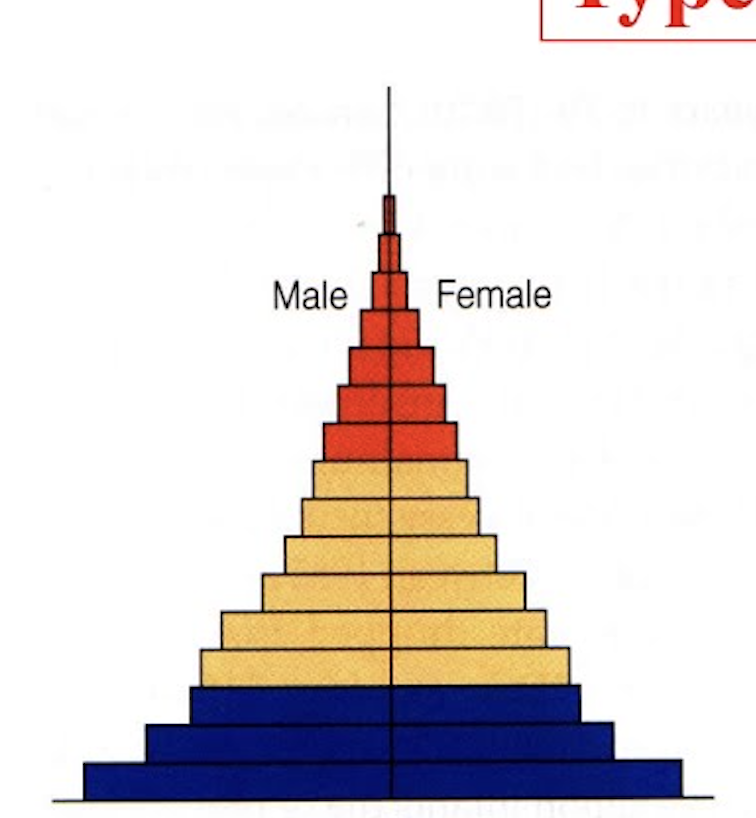
identify this age structure
Rapid growth due to a high birth rate and death rate, also characterized by a short life expectancy
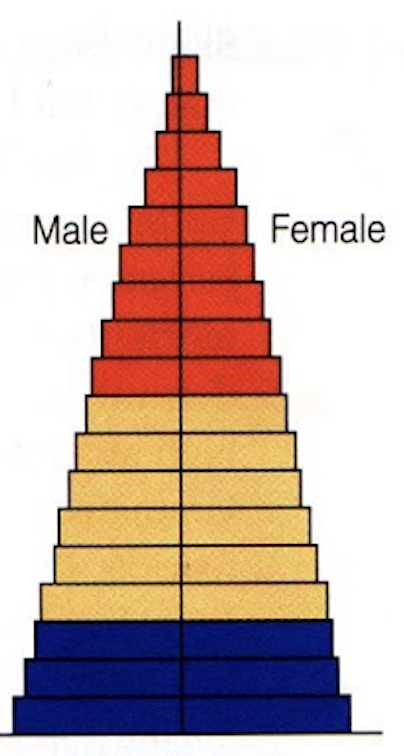
identify this age structure
Slow growth due to a high birth rate and a fall in the death rate; more people living into middle age
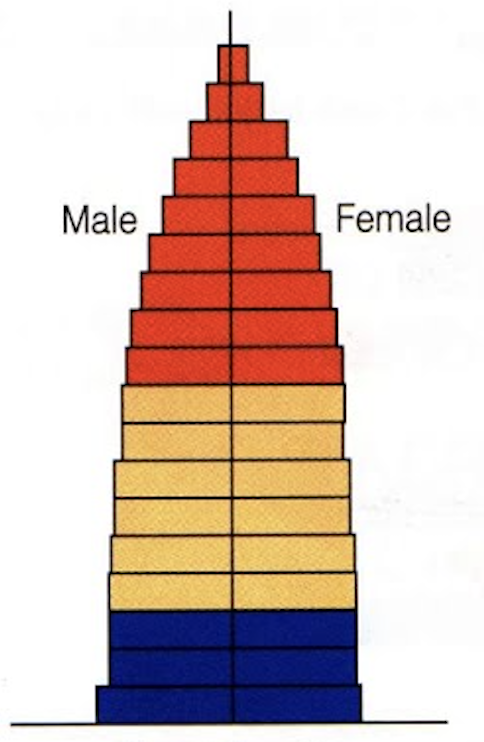
identify this age structure
Stable/Stationary growth due to a declining birth rate and low death rate; more people live into old age
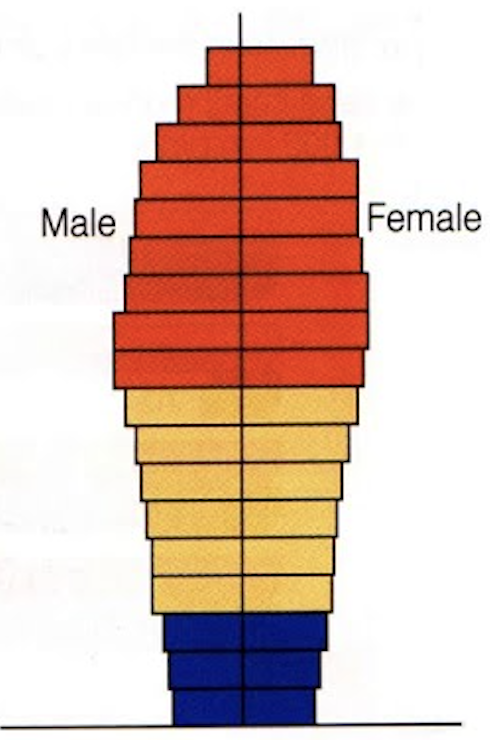
identify this age structure
Contracting/Declining growth due to a very low birth rate and an aging population; longer life expectancy and higher dependency ratio
Total Fertility Rate (TFR)
The average number of children a woman is expected to have during her lifetime, based on current birth rates.
Replacement Level Fertility
The level of fertility at which a population exactly replaces itself from one generation to the next, typically around 2.1 children per woman.
Infant Mortality Rate
The number of deaths of infants under one year old per 1,000 live births in a given year.
Stage 1 of DTM
Pre-Industrial; A stage characterized by high birth and death rates, resulting in a stable population size. TFR is high due to a lack of access to women’s education, contraceptives, family planning, and the need for agricultural labor.
Stage 2 of DTM
Industrializing/developing; A stage marked by declining death rates and high birth rates, leading to rapid population growth. Improvements in healthcare and sanitation contribute to lower mortality rates.
Stage 3 of DTM
Developed/Industrialized; A stage characterized by declining birth rates and low death rates, resulting in a slowing population growth. This decline in birth rates is often associated with increased access to education, women's rights, and family planning.
Stage 4 of DTM
Post-Industrial/Highly developed; A stage where both birth and death rates are low, leading to a stable or slowly growing population. This stage often features high levels of urbanization, advanced healthcare, and economic stability.
Doubling Rate Formula
70/r (r=growth rate)
Growth Rate (w/o migration)
births-deaths/total population x 100
Growth Rate (w/ migration)
(births+immigration)-(death+emigration)/total population x 100
Birth Rate
births/total population x 100
Death Rate
deaths/total population x 100
Population Density
population/area