microeconomics (all)
1/78
Earn XP
Description and Tags
Name | Mastery | Learn | Test | Matching | Spaced |
|---|
No study sessions yet.
79 Terms
scarcity
the reason the economy exists (conditions: desirable and limited in supply)
economic system
a system for allocating scarce resources
economics
the social science that studies the allocation of scarce resources between society’s competing wants & needs
how to deal with the problem of scarcity
3 basic economic questions
who will get the resources
what will be produced with the resources
who will receive the finished output of resources
opportunity cost
the value of the next-best alternative that you give up in order to get an item
what could have been done with resources when a decision is made about their use
the opportunity lost
production possibilities curve
a model that shows the tradeoffs society/individuals face in how to use scarce resources
shows what is possible in our use of scarce resources between 2 competing wants/needs
linear PPC curve
when variable1 and variable2’s trade-offs are equal
constant opportunity cost
the 2 goods produced are identical and require the same resources
1 million pizzas = 1,000 cars
inefficient uses of time/resources
inside the PPC curve

impossible use of time/resources
outside the PPC curve
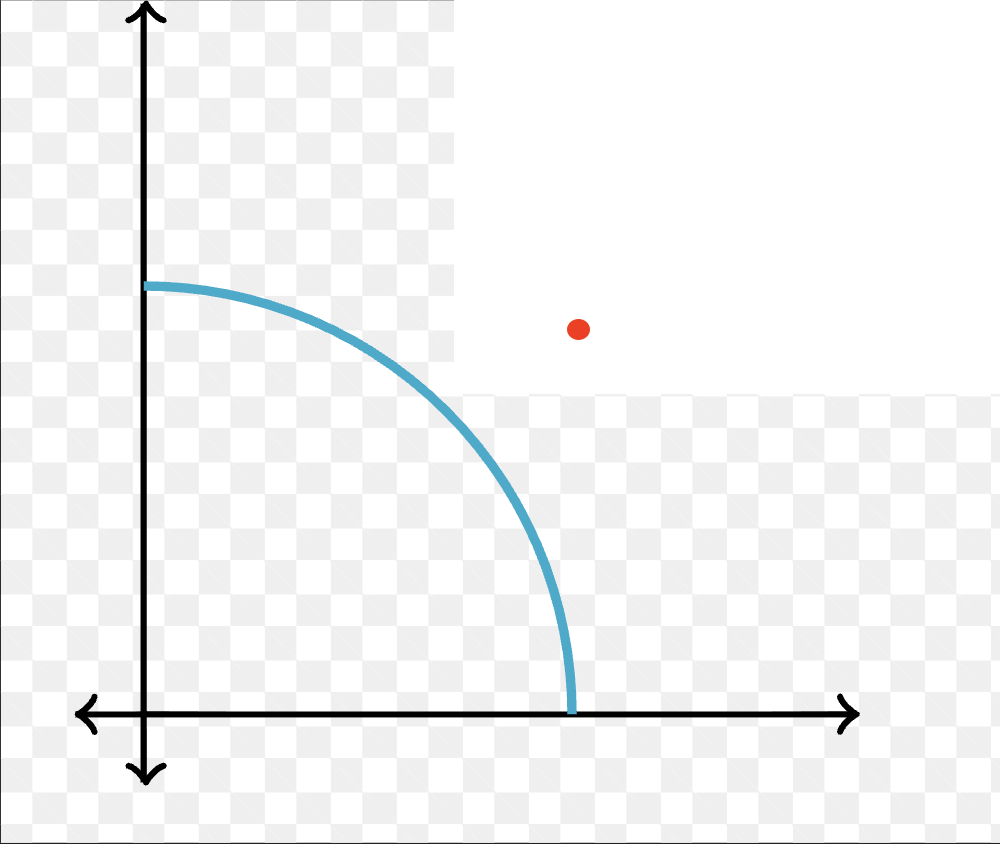
law of increasing opportunity cost
↑ production of a good/service = ↑ opportunity cost of producing each unit
bowed out PPC curve
this is because resources are not perfectly adaptable to all uses
the opportunity cost in terms of the other good that must be given up increases
decreasing opportunity costs in the PPC
as output for one good increases, the opportunity cost (in terms of how many units of the other good given up) decreases
resources needed to produce some goods become less scarce as outputs increases
therefore, the cost of additional units decreases
circular flow
a simplified diagram of macroeconomy
shows flow of money, goods/services, factors of production
flow of $ into each market/sector = flow of $ out of each market/sector
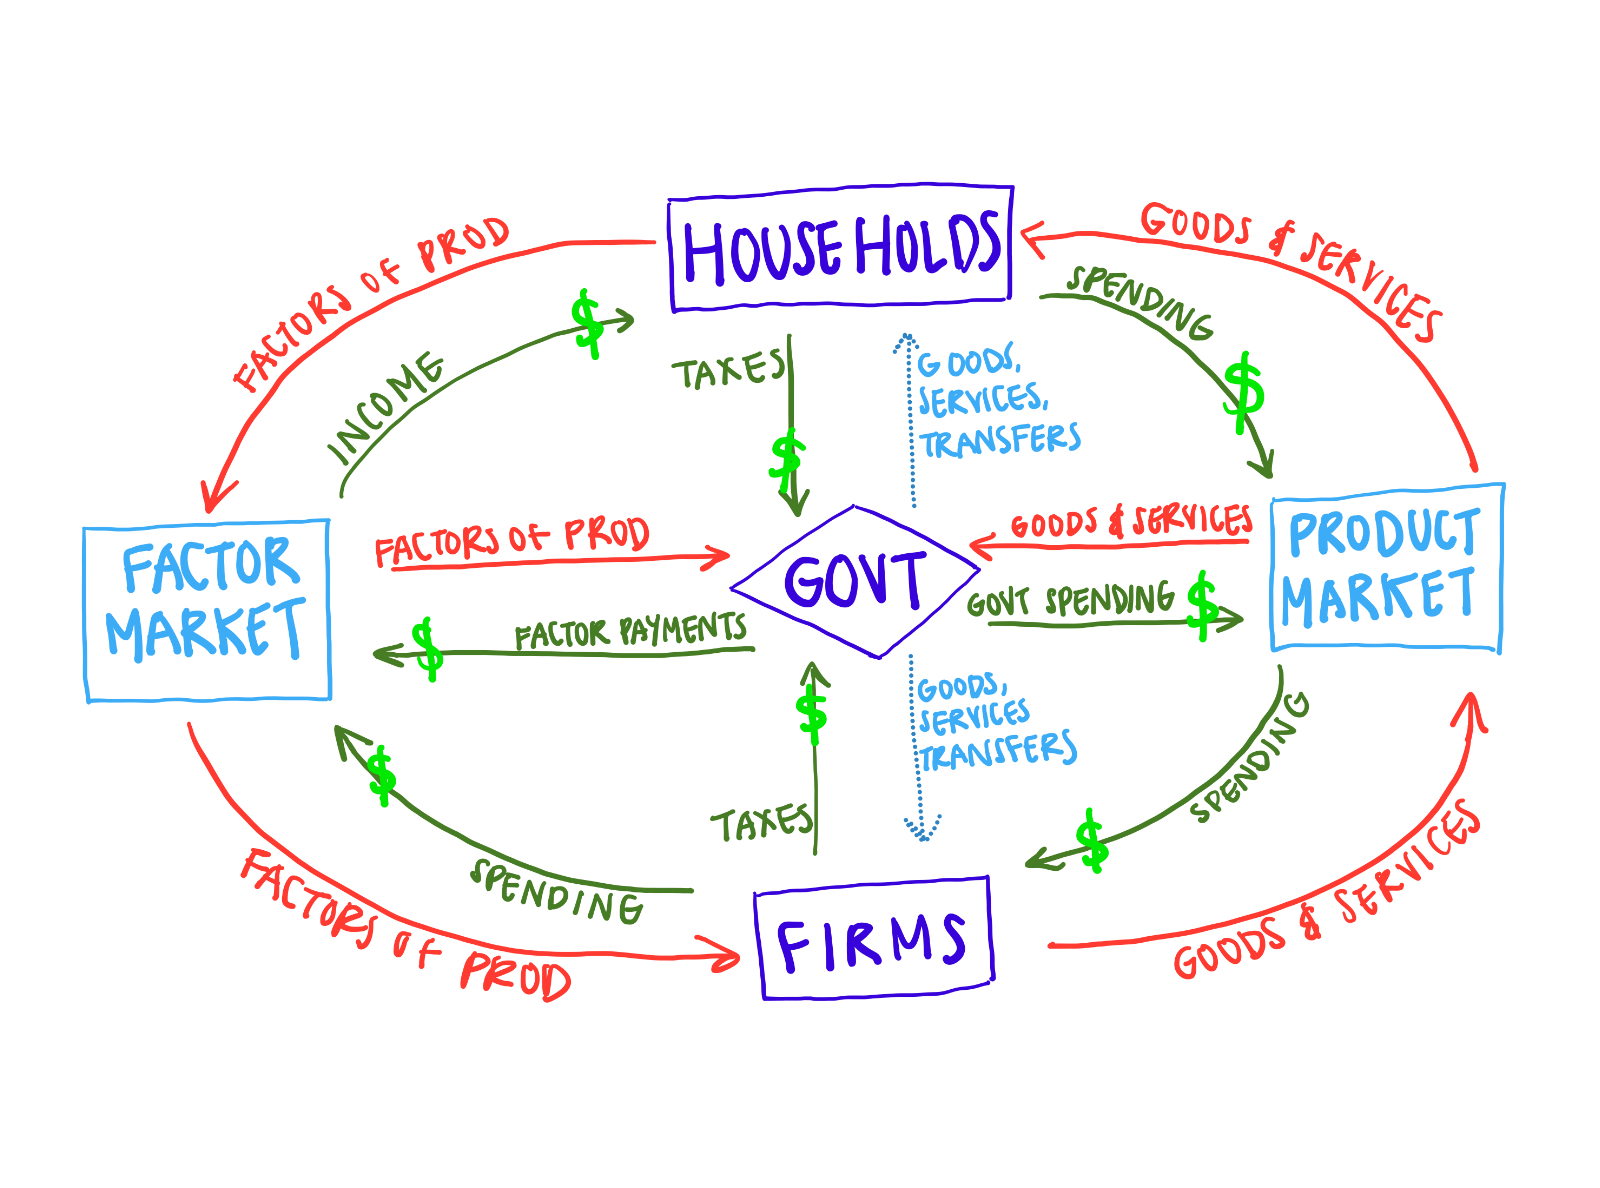
physical flow in the circular flow diagram (red)
goods, services, labor, raw materials
payment flow in the circular flow diagram
payment for goods, services, labor, raw materials
product markets
market where goods and services are
bought (by households)
sold (by firms)
consumer spending
household spending for goods and services
factor markets
market where resources are
bought (by firms)
sold (by households)
households own and receive income from all factors of production
government spending
everything spent on goods and services by federal, state, and local governments
taxes
required payments to the government from firms and households
tax revenue
the total amount of funds the government receives from taxes
factors of production
the economy’s resource
land, labor, capital, entrepreneurship
payments for factors of production
wages, rent, interest, profit
disposable income
(income + govt transfers) - taxes
total amount of household income available to spend on consumption
government transfers
payments the government makes to individuals without expecting a good/service in return
ex: unemployment insurance payments
private savings
disposable income - consumer spending
household income that’s not spent on consumption
financial markets
markets that channel private savings into investment spending and government borrowing
government borrowing
an amount of funds borrowed by the government in financial markets
investment spending
spending by firms on new productive physical capital
capital segways into future streams of $/output
buying machines, factories, houses
changes in inventory
inventory
stocks of goods and raw materials held to facilitate business operations
land
all natural resources (plants, water, minerals, raw materials)
labor
effort of workers
capital
manufactured goods used to make other goods and services
machinery, buildings, tools
entrepreneurship
risk-taking, innovation, organization of resources for production
marginal benefit
what you gain from doing something one more time
marginal cost
the cost of doing something one more time
marginal decisions
marginal benefit/cost
the gain/loss of doing something one more time
marginal analysis
the study of the costs/benefits of doing something a little more/less
“how much” should you do of an activity?
microeconomics
the study of how individuals, households, and firms make decisions and how those decisions interact
macroeconomics
the study of overall ups and downs of the economy
positive economics
economic analysis used to answer questions about how the economy works
has definitive right/wrong answers
descriptive
normative economics
economic analysis that involves saying how an economy should work
prescriptive
traditional economies
production and consumption are based on precedent
small villages, amish communities
market economies
factors of production are privately owned, and the decisions of individual producers and consumers largely dictate what, how, and for whom to produce
capitalist
free enterprise
a market economy with minimal government involvement
laissez-faire from the gilded age (late 1800s-1900)
command economies
factors of production are publicly owned, and a central authority makes production and consumption decisions
communism, socialism
mixed economies
combines elements of traditional, market, command economies
most modern markets (US, CHN, RUS, etc.)
incentives
rewards/punishments that motivate particular choices
property rights
establish ownership and grant individuals the right to trade goods and services with each other
applied to resources, goods, firms, intellectual property (inventions, art, etc.)
incentivize people to produce, keep, or trade for better things
ceteris paribus
“other things equal”
all other relevant factors remain unchanged in economic models
efficiency
there is no other way to make anyone better off without making at least one person worse off in an economy
no missed opportunities
productive efficiency
if an economy is producing at any point on its PPC
allocative efficiency
if an economy is producing at a point on its PPC that’s preferred by consumers
when a company produces goods/services that society desires most
economic growth
an increase in the maximum amount of goods/services an economy is able to produce
PPC shifts outwards
sources: tech, availability of resources used to produce g/s
economic shrinkage
a decrease in the maximum amount of goods/services an economy is able to produce
PPC shifts inwards
economy has shrunk
causes: loss of resources/tech, war, natural disasters
perfectly competitive market
a market with many buyers/sellers of the same good/service.
no individual’s actions have a noticeable effect on the price of a good/service sold
supply and demand model
a model that shows how a perfectly competitive market works
demand curve
factors that make the D curve shift
supply curve
factors that make the S curve shift
market equilibrium
eq price
eq quantity
the way the market changes when S or D curve shifts
demand schedule
a table that shows how much of a good/service consumers will be willing and able to buy at different prices
Law of Demand
a higher price for a good/service = less demand for that good/service
given ceteris paribus
change in demand
a shift of the demand curve
changes quantity demanded for any given price
increase in demand
a rightward shift of the D curve
consumers want a larger quantity of the good/service
decrease in demand
leftward shift of the D curve
consumers want less of a good/service
causes for a D curve shift
changes in taste, price of related goods/services, income, # of consumers, expectations that lead to a change in the economy
changes in taste
due to trends, beliefs, cultural shifts
changes price of related goods/services
when demand for a good changes due to changes in prices of substitutes or complements
complements
goods/services that are consumed together
cars + gas, phones + apps, etc.
changes in income
when demand for a good changes:
increased income = increased demand for normal goods
normal goods
demand for this good increases when consumer income increases
inferior goods
demand for this good increases when consumer income decreases
a less desirable version of more expensive dupes
changes in # of buyers
when demand for a good changes:
more consumers = more demand
less consumers = less demand
changes in expectation
when demand for a good changes because of expected changes in price/salary/other
equilibrium
an economic situation where no buyer/seller would be better off doing something different.
where S and D curves intersect
quantity of a good demanded = quantity supplied
equilibrium price
the price of an item that matches the quantity supplied and quantity demanded
price = Q demanded by consumers = Q supplied by sellers
“market-clearing prices”
equilibrium quantity
quantity bought/sold at the equilibrium price
disequilibrium
when the market price is above/below the price that equals the quantity demanded and quantity supplied
market price
all sellers receive and all buyers pay around the same price
surplus
quantity supplied (Qs) > quantity demanded (Qd)
occurs when the price is above equilibrium
“excess supply”
shortage
quantity demanded (Qd) > quantity supplied (Qs)
occurs when price is below equilibrium
“excess demand”
market response to changes in demand
increased demand = raised eq price & eq quantity
decreased demand = lowered eq price & eq quantity
market response to changes in supply
increased supply = decreased eq price & increased eq quantity
decreased supply = increased eq price. & decreased eq quantity