Data Analytics- Quiz 1
1/36
There's no tags or description
Looks like no tags are added yet.
Name | Mastery | Learn | Test | Matching | Spaced | Call with Kai |
|---|
No analytics yet
Send a link to your students to track their progress
37 Terms
What is data analytics
The science of examining raw data to conclude that information
A process of inspecting, cleansing, transforming and modeling data with the goal of discovering useful information, informing conclusion and supporting decision-making
Classical Statistics vs Data analytics
Classical statistics concentrates on “average” effect
Data analytics often makes predictions on an individual level
– which ad to display for THAT customer
– how likely for THAT student to drop out of college
Business Analytics
the process by which businesses use statistical methods and technologies for analyzing historical data in order to gain new insight and improve strategic decision making
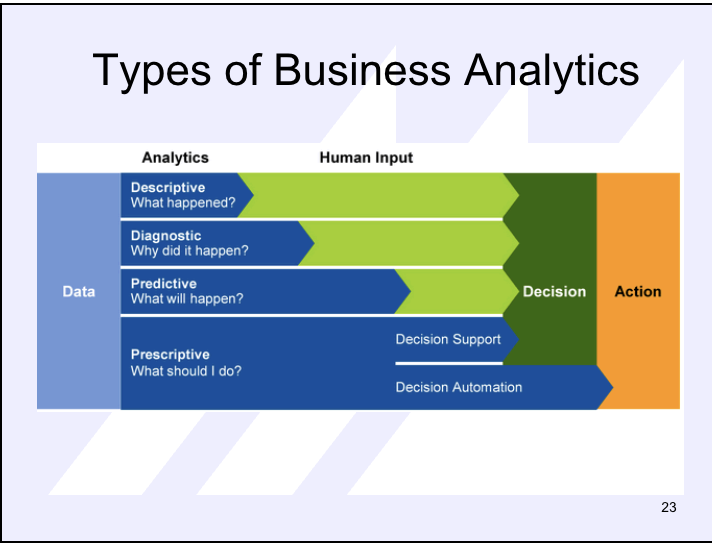
4 types of data analytics
Past
Descriptive analytics
Diagnostic analytics
Future
Predictive analytics
Prescriptive analytics
Descriptive analytics
Descriptive analytics- What is happening in my business
Summarize large data set
Get essential insights
Past type
Diagnostic Analytics
Diagnostic analytics- Why is it happening?
Take descriptive and dig deeper
Identify anomalies
Past
Predictive Analytics
Predictive analytics- What will happen in the future?
Historical patterns being used to predict specific outcomes
Business strategies have largely remained consistent over time
future
Prescriptive Analytics
Prescriptive analytics- What should be done?
Apply advanced analytical techniques and makes recommendations
By using insights from predictive analytics, data-driven decisions can be made
future
Know this graph about types of business analytics
Big Data
refers to massive complex structured and unstructured data sets that are rapidly generated and transmitted from a wide variety of sources.
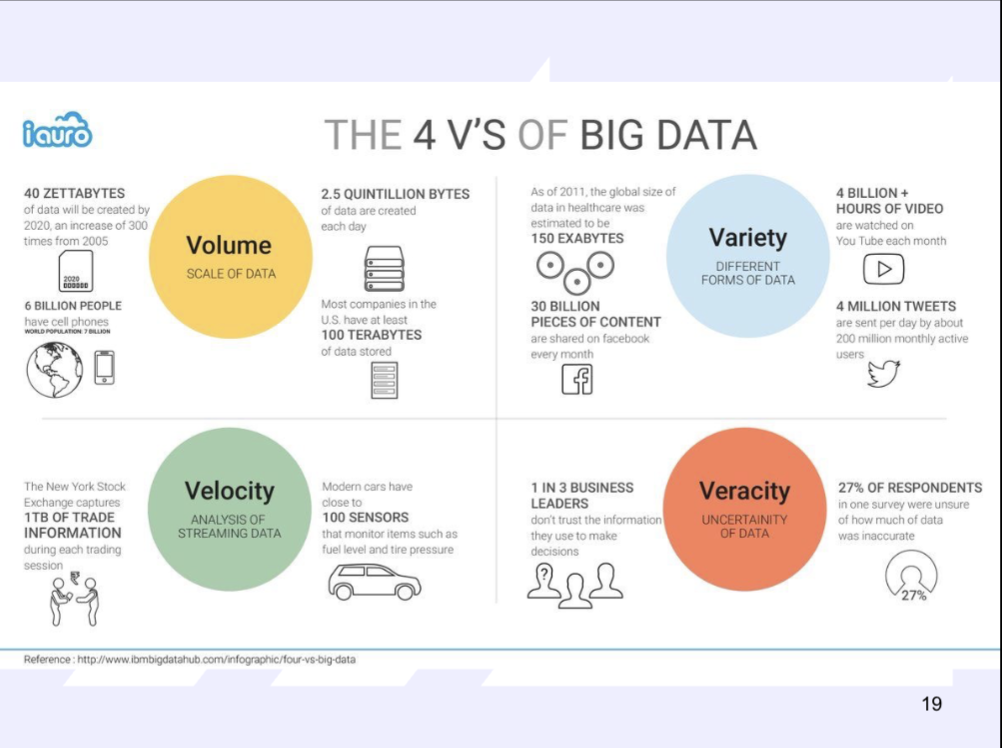
4 V’s of Big Data
volume
variety
velocity
veracity
Volume (and bytes of measurement)
Data at Rest
Terabytes to exabytes of existing data to process
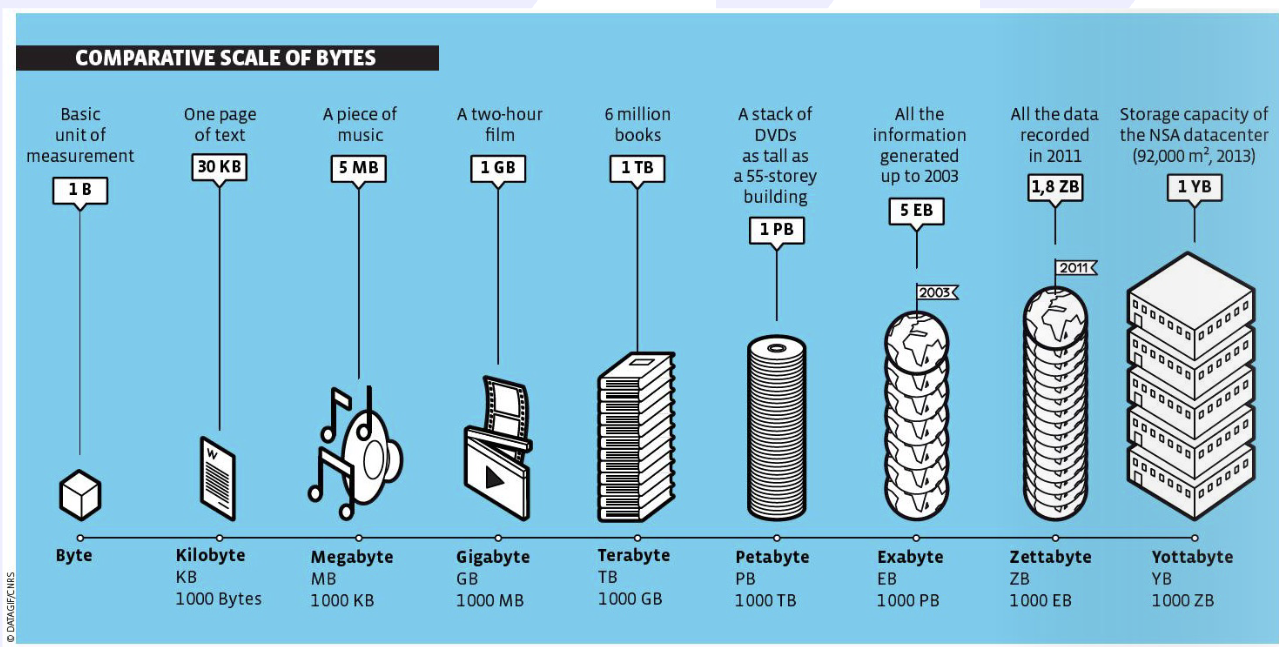
Measurements in Bytes
Byte- basic unit of measurement
Kilobyte (1024 byte)- 30KB is one page of text (2^10 of a byte)
Megabyte (1000KB) - 5 MB is a piece of music (2^10 MB)
Gigabyte (1000MB) - 1 GB is a two-hour film (2^10 MB)
Terabyte (1000 GB) - 1 TB is 6 million books
Petabyte (1000 TB) - 1 PB a stack of DVD’s as tall as a 55 story building
Exabyte (1000PB) - 5 EB all the information generated up to 2003
Zettabyte (1000EB) - 1.8 ZB is all the recorded data in 2011
Yottabyte (1000 ZB)
Variety
Data in many forms
Structured data- anything that can neatly be displayed in rows and columns
Requires less storage
Easier to manage and protect
Unstructured data - cannot be displayed in rows or columns- images, video, audio, word processing files
Requires more storage
More difficult to manage and protect
Text- words or written text (emails)
Multimedia- non-text (images, videos, audio)
Velocity
Data in Motion (speed at which data is processed)
Streaming data, milliseconds to seconds to respond
How fast data goes from point A to point B
Ex: Facebook users upload more than 900 million photos a day
Measurements
bits/sec = bps
kilobits/sec = kbps (10^3, or 1000 bits/sec)
megabits/sec = mbps (10^3, or 1000 kbps/sec or 1,000,000 bps (a million bits per second))
gigabit/sec = gbps (10^3, 1000 mbps, 1B bps)
Download content more than you can push content up
Veracity
Data in doubt
Uncertainty due to data inconsistency & incompleteness, ambiguities, latency, deception, model approximations
Refers to quality, trustworthiness of data, lack of bias, noise, and abnormalities
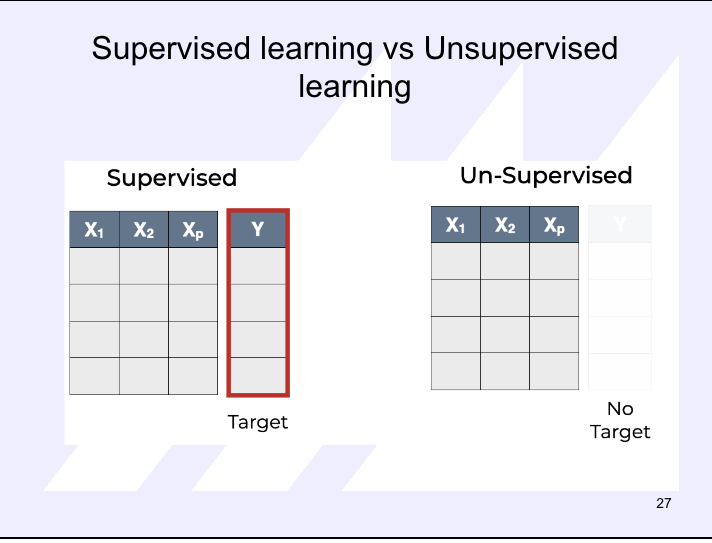
Supervised vs Unsupervised learning
supervised learning has a target and you train the machine using data which is well “labeled”
involves building a model to estimate or predict an output based on one or more inputs
end goal: predict new values or understanding existing relationships between explanatory and response variables
classification and regression
Unsupervised learning does not have a target and you do not need to supervise the model
involves finding structure and relationships from inputs. there us no “supervising” output
end goal: place observations from a dataset into a specific cluster or to create rules to identify associations between variables
clustering and association
Data Privacy
branch of data security related to the proper collection, usage, and transmission of data
concerns around how data is legally collected and stored
if and how data are shared with third parties
how data collection usage and transmission meet regulations
also called information privacy
Three key principles of data privacy
Confidentiality
Customer data and identify remain private
Medical and financial data are highly sensitive
Transparency
Data processing and automated decisions are transparent
Risks including are understood: social and ethical
Accountability
Reflective, reasonable, and systematic use and protection of data
protections against unauthorized or unlawful processing or accidental loss or destruction
Data Mining
a set of statistical and machine learning methods that inform decision making, often in an automated fashion
Data Mining for broad public may mean “Digging through vast stores of data in search of something interesting”
Also known as predictive modeling
Data Ethics
a branch of ethics that studies moral problems related to data
Evaluates if data are being used for doing the right thing for people and society.
there are two key considerations:
a. Human first: the human being stays at the center and human interests always outweigh institutional and commercial interests.
b. No biases: the algorithms do not absorb
bias or amplify them in analysis
Data
compilations of facts, figures, or other content.
• Numerical and non-numerical.
• Often we have a large amount of data.
• Even small data can give insights
Information
Data that have been organized, analyzed, and processed in a
meaningful and purposeful way
Knowledgeable
Use a blend of data, contextual information, experience, and
intuition
Population
consists of all items of interest in an analytics application.
• Not feasible to collect data that comprise a population.
• Too expensive or too big.
Sample
a subset of the population.
• Representative of the population.
• Compute a sample statistic to estimate the unknown population parameter.
• Make inferences about the unknown population parameter
cross-sectional data
Record a characteristic of many subjects at the same point in time,or without regard to time.
People, households, firms, industries, regions.
ex: Batting averages of all MLB players during the 2025 season
Home runs hit by each team in a single season
normally some type of chart/bar graph
time series data
Collected over several time periods focusing on certain groups of people, specific events, or objects.
Hourly, daily, weekly, monthly, quarterly, or annual observations.
Attendance at a stadium each home game over a season
normally a line graph
types of data (human or machine)
• Data can be human- or machine-generated.
• Structured human: price, income, retail sales.
• Structured machine: sensors, speed cameras, web server logs.
• Unstructured human: email, text, social media, presentations.
• Unstructured machine: satellite images, video data, camera images
Variable
characteristic of interest that differs in kind of degree among various observations
two types of variables
categorical (categories, names, labels) or qualitative number values)
numeric or quantitative
Discrete: assumes a countable number of values. (number of goals in a soccer game, number of emails today)
Continuous: assumes an uncountable number of values within an interval. (height, weight)
File formats
Formatting data in a standardized manner allows people to understand data files.
Two common layouts for text files:
Fixed-width format.
Delimited format.
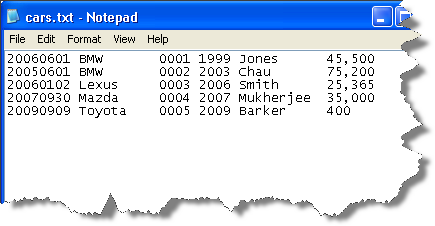
Fixed width format
each column starts and ends at the same place in every row.
• Specific data can be found at the exact location
for every record.
• The data are stored as plain text characters.
• Simple files that are smaller in size.
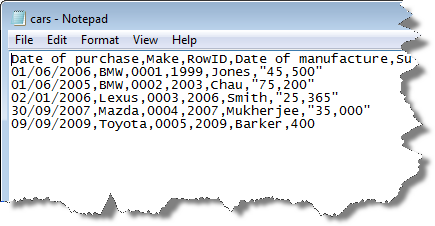
Delimited format
each column is separated by a delimiter
•Delimiter is a character to separate fields.
• A comma is typical giving C S V files.
• Each column can contain as many characters as applicable
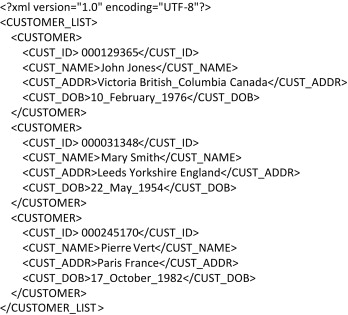
Extensible Markup Language (XML)
a simple text-based markup language for representing structured data
• XML is widely used to share structured information.
• It uses user-defined markup tags to specify the structure of data.
• Each piece of data is enclosed in a pair of tags.
• Designed to support readability.
• Because of tags, files are much larger
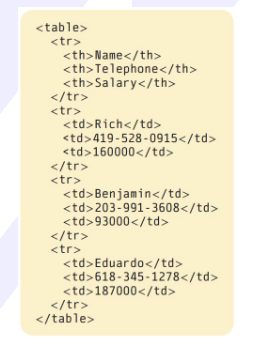
HyperText Markup Language (HTML)
is a mark-up language that uses tags to define data for web pages
• Gives information on how to display the data.
• Different tags for different elements.
• Conforms to standards maintained by organizations such as the World Wide Web Consortium.
• For example, <table> provides structure for textual data
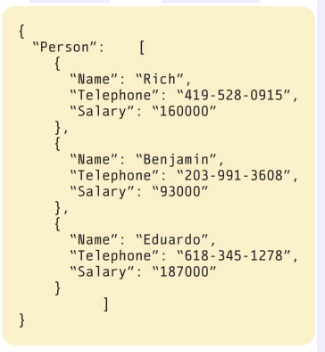
JaveScript Object Notation (JSON)
standards for transmitting human-readable data
•Popular alternative to XML.
• Supported by many programming languages such as C and Python.
• Not as verbose as XML, making files smaller.
• Supports wide range of data types.
• Parsing is faster and less resource intensive
Generative AI
create new content like music and text
Interval vs Ratio scale
interval- can categorize and rank to find meaningful differences between them (60* is hotter than 50*)
ratio- same as interval but 0 holds importance (sales, profit, inventory, weight, time, distance)
strongest level of measurement