Unit 0
 AP Practice
 Call Kai
1/118

Earn XP
Description and Tags
Name | Mastery | Learn | Test | Matching | Spaced | Call with Kai | Chat |
|---|
No analytics yet
Send a link to your students to track their progress
119 Terms
Empirical Evidence
Information acquired by observation or experimentation; makes psychology a science.
Perspectives
Ways of understanding and explaining human behavior & mental processes.
Psychology
Scientific study of mental process & behavior.
Evolutionary Perspective
Taking principles of evolution (such as natural selection), applying them to psychological phenomena.
Psychodynamic Perspective
Behaviors based on past experiences left in childhood or the unconscious mind; crucial in shaping adult personality.
Behavioral Perspective
Focuses on observable & learned behaviors, humans/animals are controlled by their environment and how they are conditioning is based off rewards/punishments.
Cognitive Perspective
Focuses on internal processes (memory, intelligence, perception, problem-solving, etc) which influences behavior.
Sociocultural Perspective
Society and culture shapes behavior and cognition, social customs, beliefs, values, etc shapes a person’s identity and reality.
Biopsychology
Influence of genetics and brain chemistry on thinking/behavior, physical and biological processes and evolves over time.
Biopsychosocial
Combining multiple approaches, links between genetics and environments. (Biological, Psychological, and socio-cultural influences).
Peer Reviewers
Experts in the same field who evaluate a research study before published.
Theory
Explains or predicts behaviors/events by organizing observations.
Hypothesis
Testable predictions often implied by theories (If… then…)
Falsifiability
Theory/hypotheses that can be tested wrong. (Must have one for a claim to be scientifically valid.)
Operational
Exact description of how a researcher measures or manipulates a variable in a study
Replication
Repeating the essence of a research study with different situations/participants.
Case Study
An in-depth examination of an individual or group.
Naturalistic Observation
Recording behavior in a natural setting, no changes.
Survey
Recording self-reported behaviors of a group; commonly through questioning.
Social Desirability Bias
People responding in way sthey presume a researcher expects.
Self Report Bias
When people report their behavior inaccurately.
Sampling Bias
A flawed sampling process that produces an unrepresentative sample.
Random Bias
Fairly represents a population because each person has a chance of equal inclusion.
Population
All those in a group being studied where samples can be drawn.
5 Research Designs
Experiment, Case Study, Naturalistic Observation, Correlational Study, & Meta-Analysis.
Descriptive Research
Describing research/analysis
Correlational Research
Searching for relationships between variables (no cause & effect)
Experimental Research
Manipulating variables in a situation
Basic Research
Increasing scientific knowledge base (active research)
Applied Research
Research to find solutions to certain problems.
Quantitative Data
Numerical type of data & helps us understand patterns precisely.
Qualitative Data
Non-numerical; descriptive & gives deep insight on topics.
Cognitive Bias
Can distort our thinking and lead to incorrect conclusions.
Confirmation Bias
The tendency to look for or notice information that supports what you already believe.
Hindsight Bias
People believe that they knew something was going to happen after it has already happened even if they didn’t actually predict it.
Overconfidence
When people have too much faith in their own judgements.
What prevents cognitive bias?
Empirical Evidence
Reliability
When a test produces consistent results when under similar conditions.
Validity
When a test meets the concept it’s designed to measure.
R.R.R
Repeated, Reliable Results
V.E.T
Valid Evidence, True
APA
American Psychological Association—Leading professional organization dedicated to the field of psychology.
Correlation
Extent of how two factors vary together.
Correlation Coefficient
Statistical index of the relationship between two things (-1.00 —> +1.00)
Variable
Anything that can vary; possible to measure.
Scatterplot
Graphed cluster of dots—amount/distance suggests the strength and direction.
Weak Correlation
When dots on a scatterplot are more spread out.
Strong Correlation
When dots on a scatterplot are tightly clustered around the line.
Illusory Correlation
Believing two things are related when they’re not.
Experiment
Where an investigator manipulates one or more factors to observe mental behaviors.
Experimental Group
Group exposed to change, the first version.
Control Group
Group with no change, servers as comparison.
Random Assignment
Randomly assigning participants to experimental or control groups.
Double-blind procedure
Where participants/researchers don’t know who is in the control or experimental group.
Placebo Effect
Experimental results caused by expectations.
Independent Variable
The manipulated variable.
Dependent Variable
The measurable outcome after the independent variable was changed.
Confounding Variable
A non-studied variable that might’ve influenced a study’s results.
Validity
The experiment will test on what it’s supposed to test.
Institutional Review Board (IRBs)
Committee responsible for reviewing research proposals to ensure ethical standards are met and protect participants.
Safeguard Human Research Participant (Guidelines)
Informed Consent, Protection from Harm, Debriefing, Right to Withdraw, and Confidential
Protect Participants from Harm
Emphasizes researches to minimize risks and ensure well-being of participants throughout the process; carefully assess potential risks with study procedures.
Informed Consent
Which individuals voluntarily agree to participate in a research study after being provided with information about the study.
Informed Assent
Similar to informed consent but applied through underage people (mentally and/or physically).
Confidentiality
Requires researchers to handle sensitive data and personal information with the utmost confidentiality.
Deception
May involve misleading participants about the true purpose or nature of the study.
Confderates
People a part of a research study but are actually working with the researcher and is aware of the study’s purpose.
Debriefing
Provides participants about the study’s true nature, purpose and procedures after their participation.
Statistics
Large amount of data that’s collected in research studies; a tool to make sense of data into organizable information.
Descriptive Statistics
Refers to numerical measures used to summarize and describe characteristics of a data set
Inferential Stats-Generalization
Using data from a sample to make inferences or predictions about a larger population
Measures of Central Tendency
Provides single value representing the “center” or typical value of a distribution
The Three Measures of Central Tendency
Median, Mean & Mode
Median
Representing the middle value of a data set when the values are in ascending or descending order.
Mean
Representing the average value of a set of data
How do you calculate the mean?
Add up all the values and divide the sum by total # of values.
Mode
Representing the most frequently occurring value in a data set.
Unimodal
A set with one mode.
Multimodal
A set with multiple modes.
No Modes
If all values occurr with the same frequency. (No repeating #’s)
Range
Represents the difference between the highest and loewst values in a data set.
How can you calculate range in a data set?
Highest Value subtracted by the Lowest Value
Normal Curve or Bell Curve
A symmetrical distribution where most scores are near the average, and fewer scores are farther from the average.

Left Side of the Bell Curve
Below Average
Right Side of the Bell Curve
Above Average
Mean Regression
When extreme scores tend to get closer to the average when measured again; happens because those scores are often due to temporary factors.
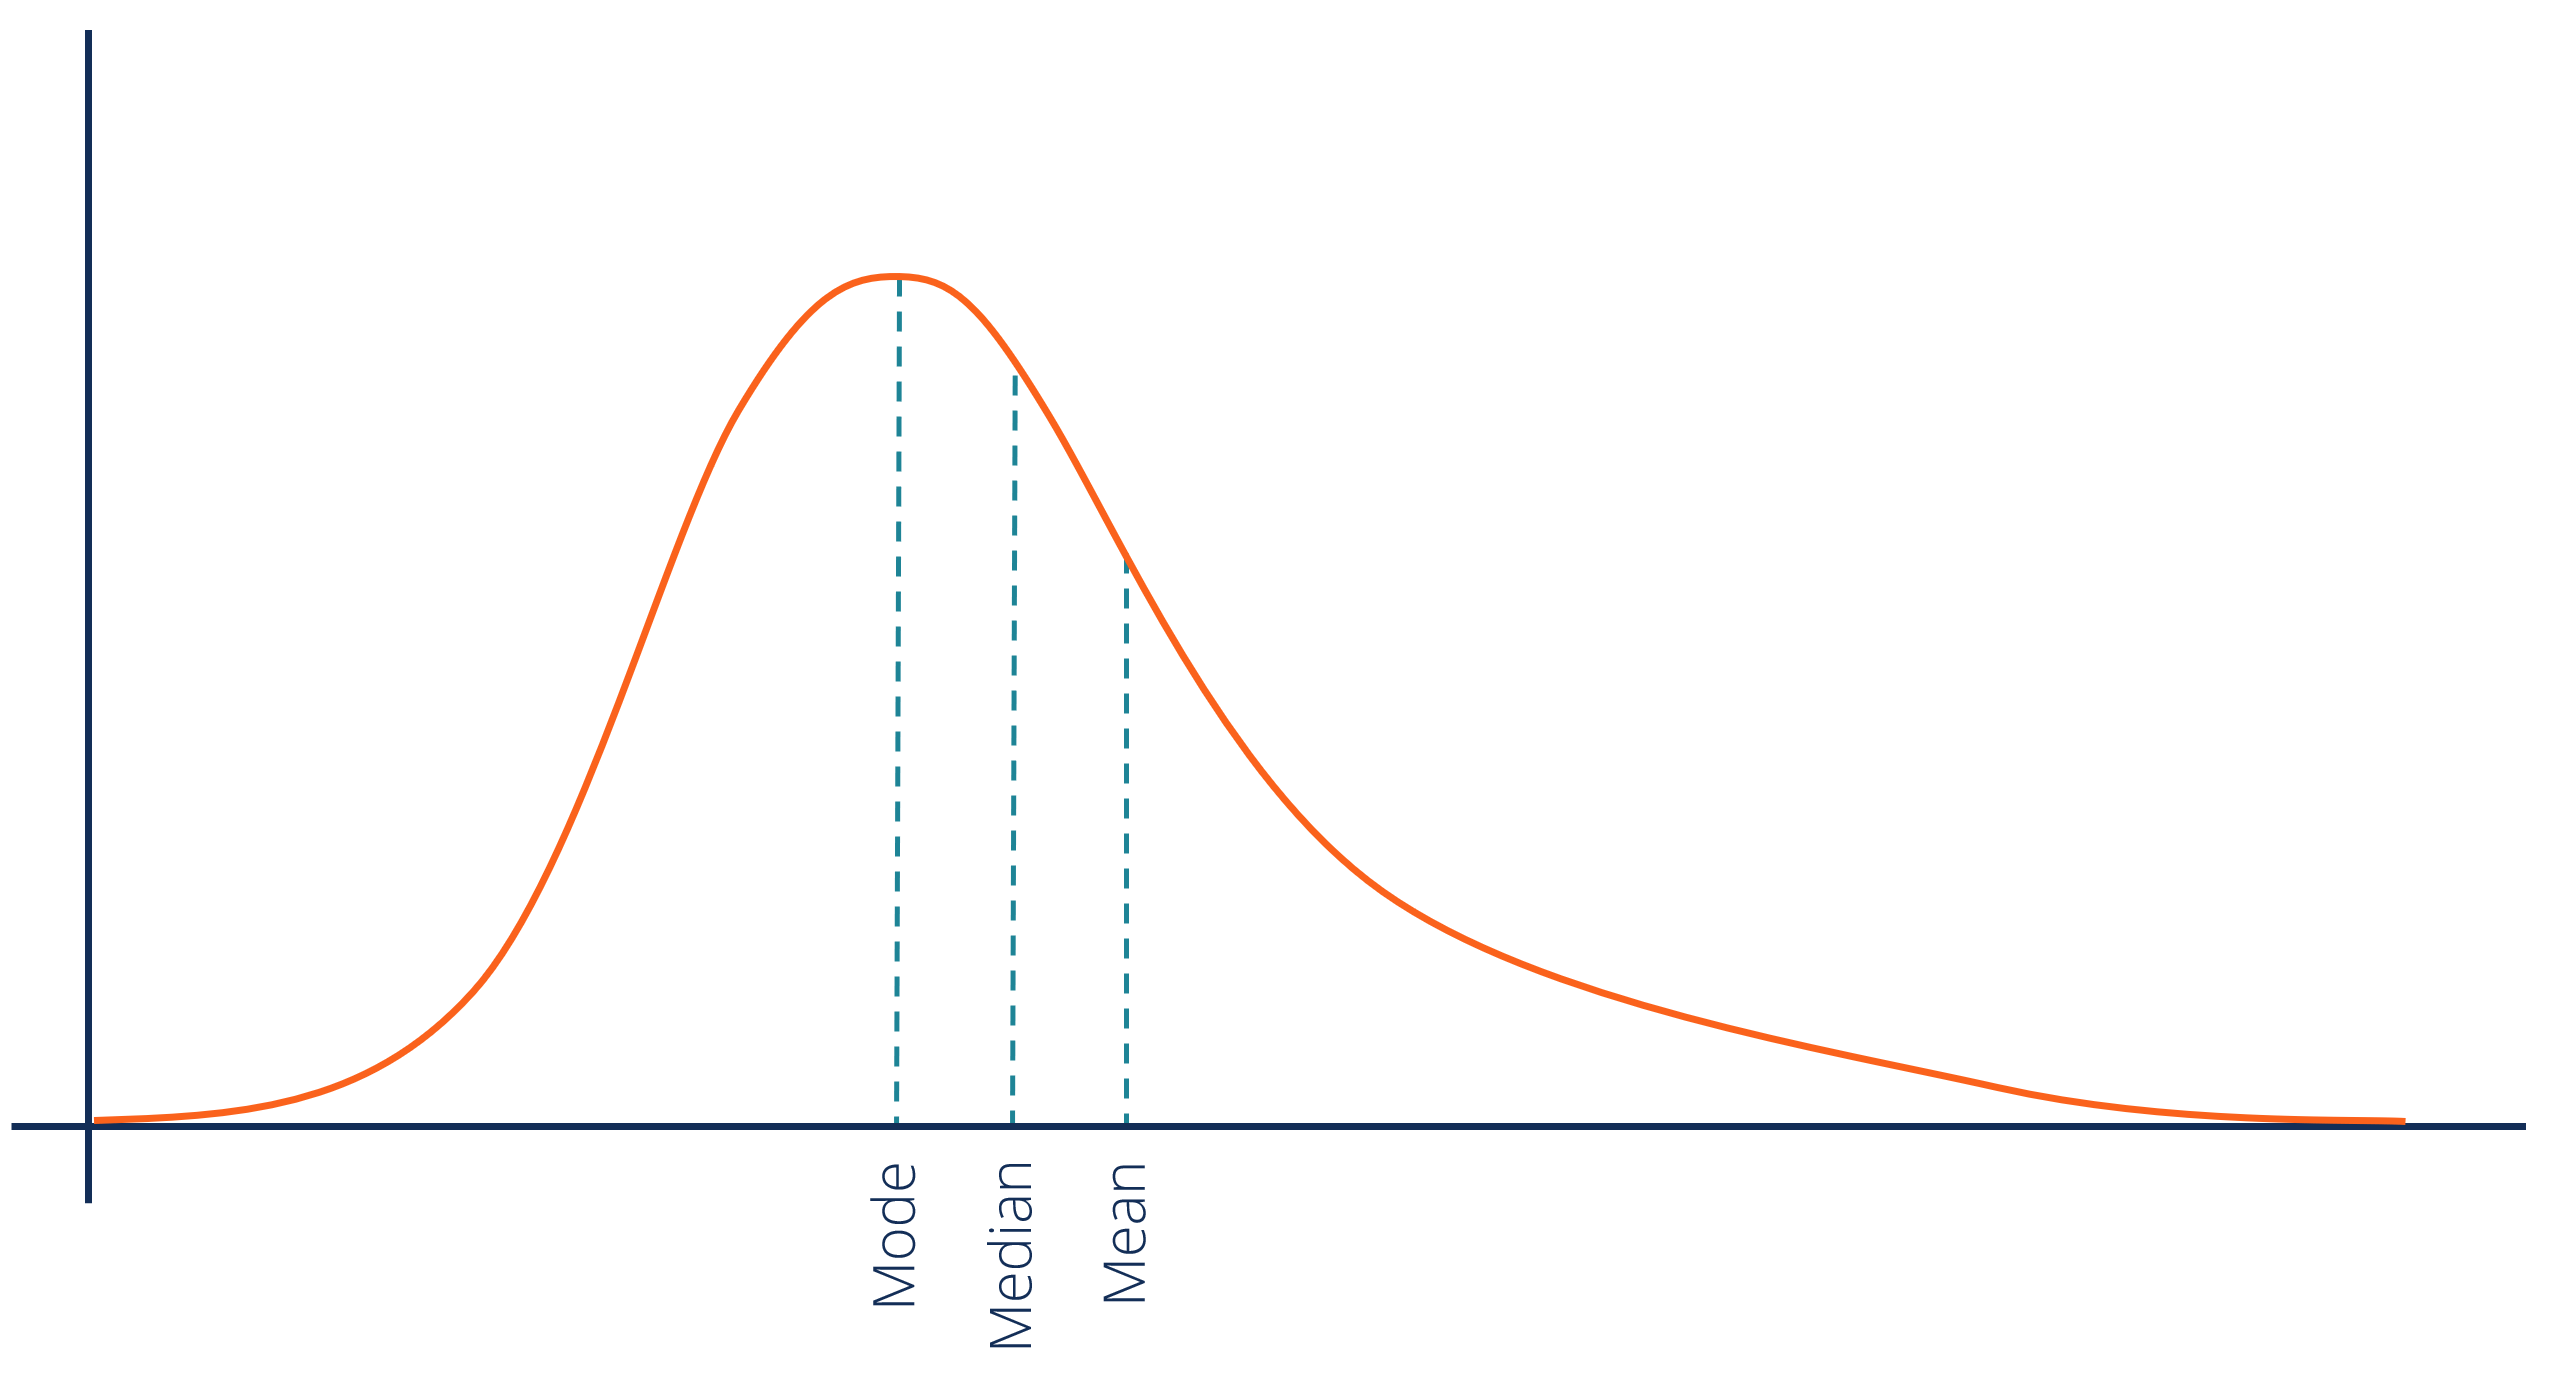
Positive Skew
Majority of the data clusters on the left side, with the tail extending to the right; suggests unusually high values.
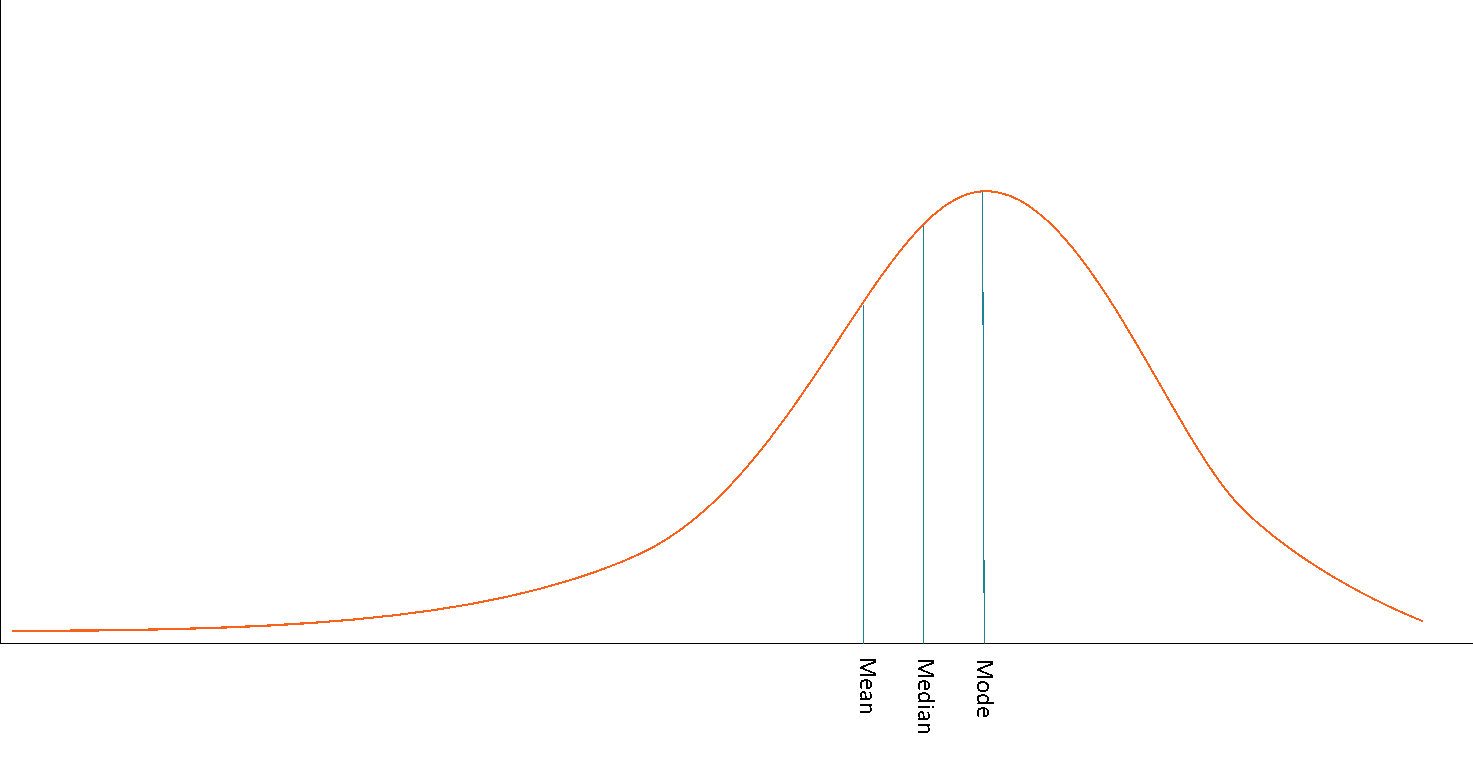
Negative Skew
Majority of the data clusters on the right side, the tail extending toward the left.
Standard Deviation
A way to measure how spread out or close together numbers are in a group
Small Standard Deviation
Most scores are close to the average (48,49,50,51,52…)
Large Standard Deviation
Most scores are more spread out. (50,81,90,92,100)
Percentile Rank
Statistical measure indicating score percentages of scores in a distribution that are equal to or below a certain value.
Bimodal Distribution
ata distribution which there are two distinct peaks/high points on a histogram or frequency distribution graph. (Data is more evenly distributed & multimodal)

Statistical Significance
The likelihood that observed results in a research study aren’t due to chance. (Not randomized.)
Statistical significance is typically assessed using statistical tests such as t-tests is represented by a _______
P-Value
P-Value < .05
Statistically Significant Difference
P-Value > .05
No Statistically Significant Difference
Large Effect Size
A substantial difference or relationship; independent made a huge impact.
Small Effect Size
A minimal difference or relationship; limited effect on dependent variable
Meta-Analysis
Combines data from various studies to draw conclusions.