L4 - Probability - IQR & box plots
1/12
There's no tags or description
Looks like no tags are added yet.
Name | Mastery | Learn | Test | Matching | Spaced | Call with Kai |
|---|
No analytics yet
Send a link to your students to track their progress
13 Terms
How would you find the mean?
Add all the numbers up and divide it by how many there are.
What is the mode?
Number that occurs most frequently
What is the median?
Middle number (if two then find average of both)
What is the interquartile range?
Measure of spread & dispersion around the middle 50% of data.
Not affected by large outliers.
Difference between upper and lower quartile: Q3 - Q1
What is the lower quartile?
Value at the first quarter. Median of lower half of the data.
(n +1) / 4
Put data in order first.
What is the upper quartile?
is the median of the upper half of the data.
which is three quarters of the way into our data:
3(n + 1) /4
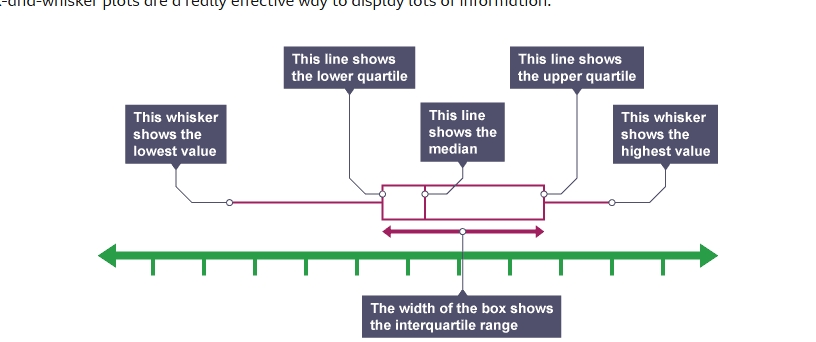
What is a box plot?
a standardized way of displaying the dataset based on: the minimum value, the maximum value, the sample median, and the first and third quartiles.
What is the minimum Q0 in a box plot?
the lowest data point in the data set excluding any outliers
What is the maximum Q4 in a box plot?
the highest data point in the data set excluding any outliers
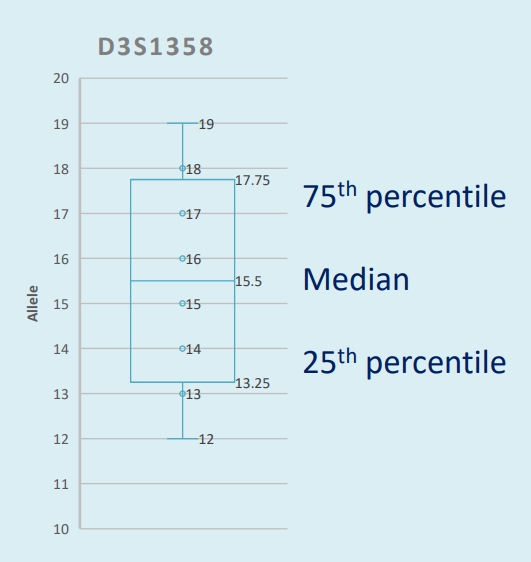
What is the Median (Q2 or 50th percentile)
Middle of data set
What is the First quartile (Q1 or 25th percentile)?
lower quartile qn(0.25)
where the lowest 25% data lies below this point
What is the Third quartile (Q3 or 75th percentile)?
upper quartile qn(0.75)
where the lowest 75% data lies below this point
What is found on a box plot diagram?