Population and Migration
1/81
Earn XP
Description and Tags
Name | Mastery | Learn | Test | Matching | Spaced | Call with Kai |
|---|
No analytics yet
Send a link to your students to track their progress
82 Terms
Birth rate
The number of people being born in a population. For example, 14.7 per thousand in Brazil.
Death rate
The number of people dying in a population. For example, 8.8 per thousand in the UK.
Life expectancy
The average number of years of life remaining at a given age. For example, 84 years for women in Switzerland.
Infant mortality rate
A population measure of the number of deaths of children aged less than one year old. For example, 4.5 per thousand in the UK.
Population density
The number of people in a given area. For example, 250 people per one km2 in the UK.
Natural increase
The difference between the birth and death rates. For example, 3.01 per thousand in the UK.
Pull factors
Reasons a person might be attracted to an area, such as access to well-paid employment.
Push factors
Reasons a person might leave an area, such as lack of access to medical services.
Population distribution
Where the people are living, for example, a high density of people in urban areas.
Population growth rate
How a population is changing over time. For example, 1.26% per year in Brazil.
Birth Rate
The frequency of live births within a population, typically expressed per thousand people. For instance, in Brazil, the birth rate is 14.7 per thousand.
Death Rate
The rate at which deaths occur in a population, usually measured per thousand individuals. For example, the UK's death rate is 8.8 per thousand.
Life Expectancy
The average duration of life remaining for individuals at a specific age, exemplified by 84 years for women in Switzerland.
Infant Mortality Rate
A statistic relating to the number of deaths among children under one year of age, such as the UK’s rate of 4.5 deaths per thousand live births.
Population Density
The measure of how many individuals reside within a specific area, exemplified by 250 people per square kilometer in the UK.
Natural Increase
The growth of a population calculated by subtracting the death rate from the birth rate, with the UK demonstrating a natural increase of 3.01 per thousand.
Pull Factors
Elements that attract individuals to a new location, including job opportunities and desirable living conditions.
Push Factors
Circumstances that drive individuals away from their current location, such as inadequate healthcare access.
Population Distribution
The way in which people are spread across different areas. For instance, urban areas tend to have a high concentration of residents.
Population Growth Rate
The rate at which a population is increasing or decreasing over time, as seen in Brazil's growth rate of 1.26% per year.
Migration
The movement of people from one place to another, which can be influenced by various social, economic, and environmental factors.
Urbanization
The process by which an increasing percentage of a population comes to live in urban areas, typically associated with industrialization.
Carrying Capacity
The maximum number of individuals that an environment can sustainably support, factoring in available resources.
High Stationary Stage: (where, birth/death rates, natural increase)
- Stage 1
- Remote groups
- High birth and death
- Slow/stable natural increase
- Reason (Birth Rate): Many children are needed for farming, infant mortality, and society/religion.
- Reason (Death Rate): Disease, famine, poor healthcare
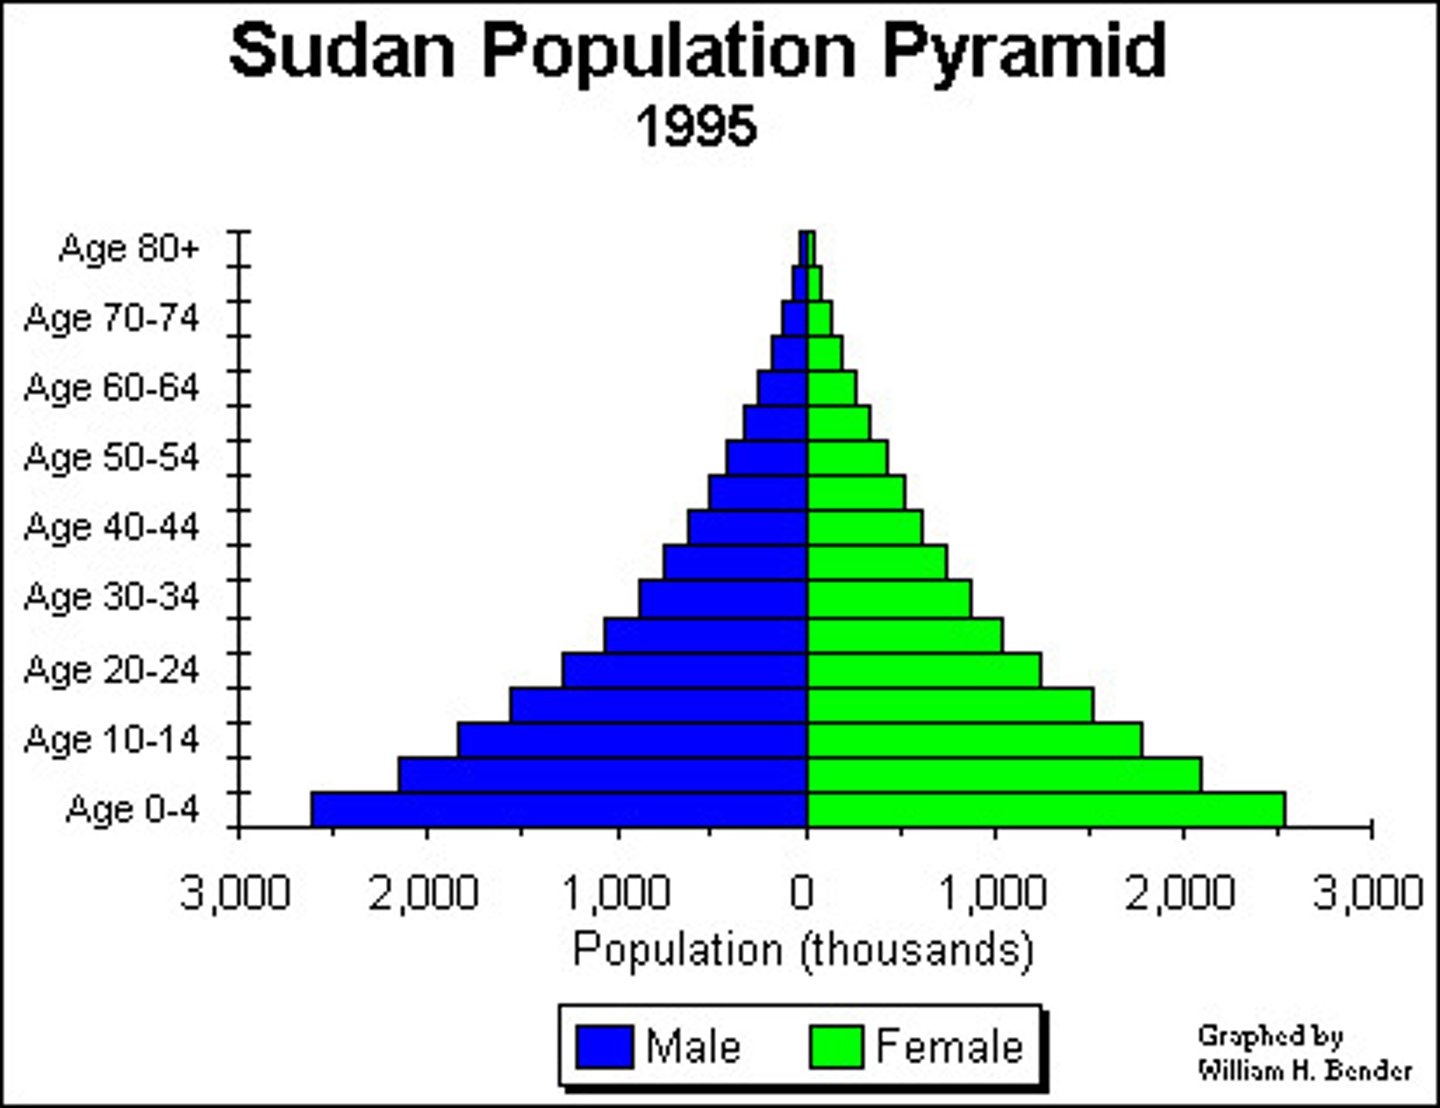
Early Expanding Stage: (where, birth/death rates, natural increase)
- Stage 2
- Yemen, Afghanistan
- High birth, rapidly falling death
- Very rapid natural increase
- Reason (Birth Rate): Many children are needed for farming, infant mortality, and society/religion
- Reason (Death Rate): Improved healthcare, water supply & sanitation, fewer children die.
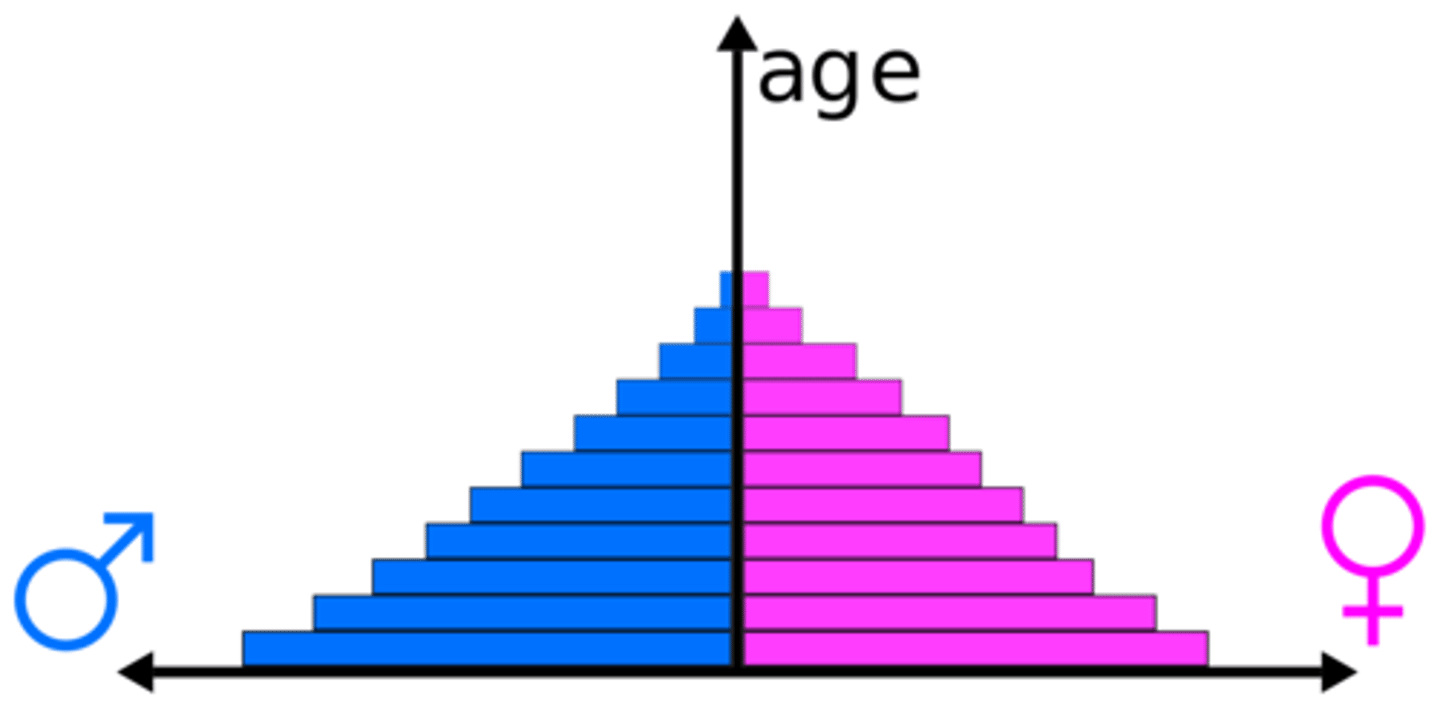
Late Expanding Stage: (where, birth/death rates, natural increase)
- Stage 3
- India, South Africa
- Falling birth, slower falling death
- Slow natural increase
- Reason (Birth Rate): Improved medicine and health, fewer children needed
- Reason (Death Rate): Improved healthcare, water supply & sanitation, fewer children die.
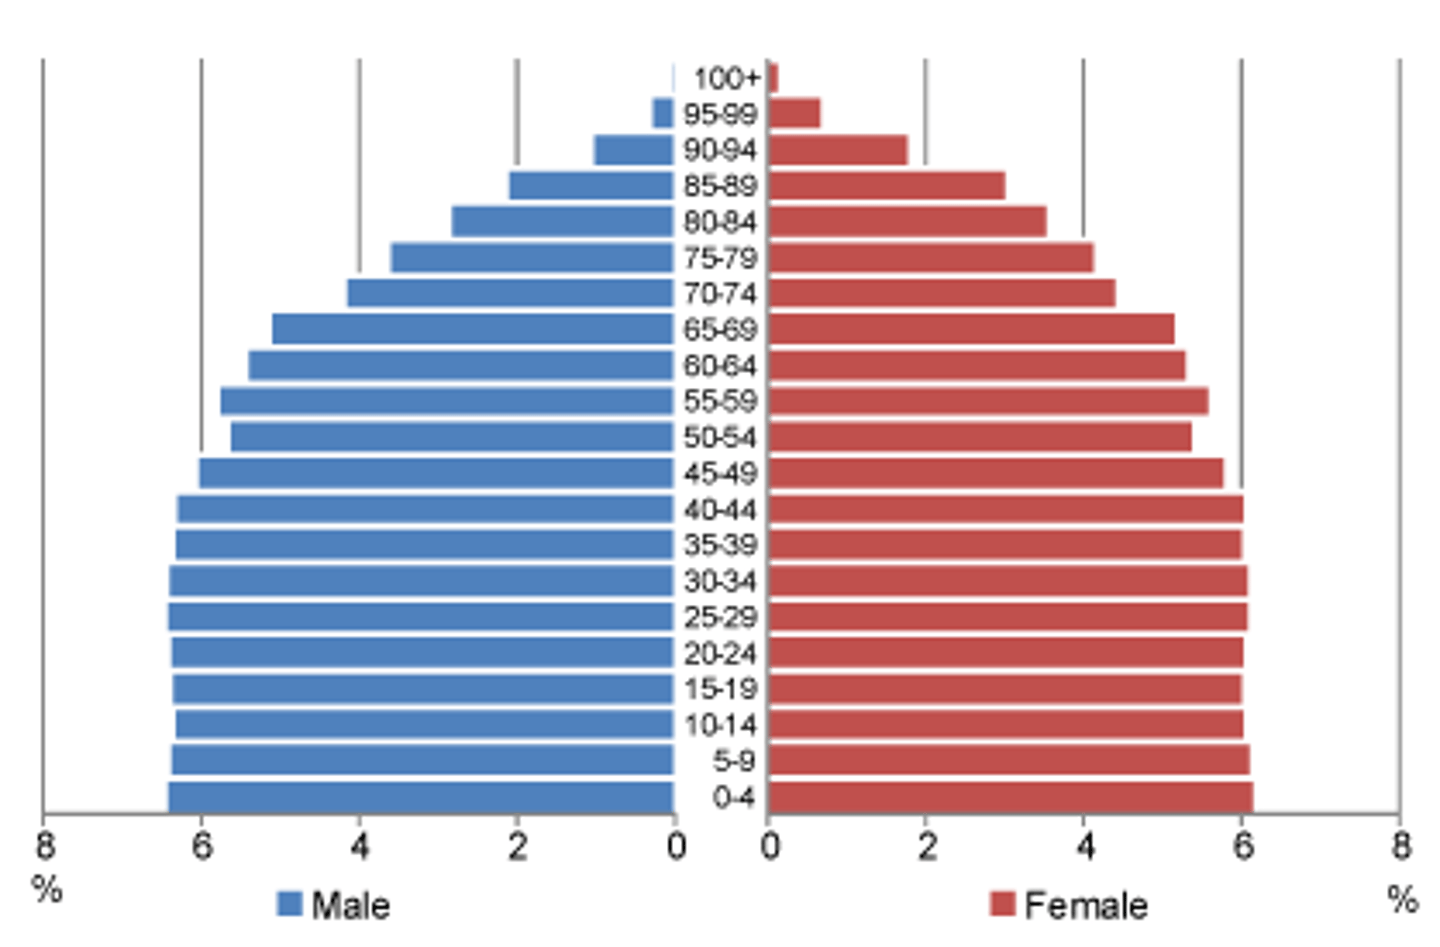
Low Stationary Stage: (where, birth/death rates, natural increase)
- Stage 4
- USA, France
- Low birth/death
- Stable/slow natural increase
- Reason (Birth Rate): Family planning, good health, improving status of women, later marriage
- Reason (Death Rate): Good healthcare, reliable food supply
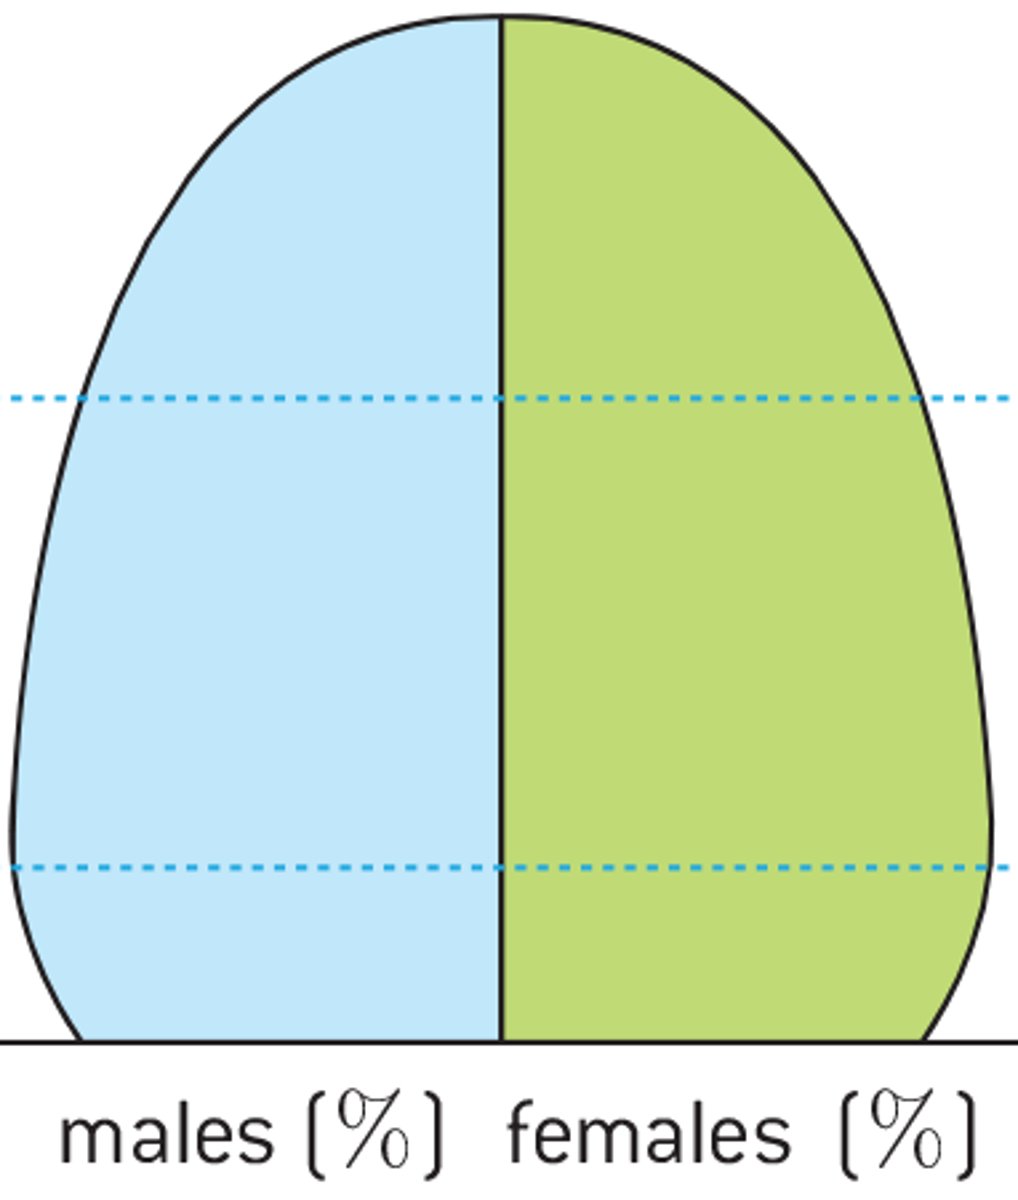
Declining?
- Stage 5?
- Germany
- Very low birth, low death
- Slow decrease
- Reason (Birth Rate): Family planning, good health, improving status of women, later marriage
- Reason (Death Rate): Good healthcare, reliable food supply
Migrant
A person who moves from one place to another in search of work/better living conditions
Immigrant
Someone who moves into a country
Emigrant
moves out of a country
Internal Migration
moving from one place to another within the same country
International Migration
where a person moves from one country to another
Overpopulation
excessive population of an area that leads to overcrowding
Birth rate
No. of births per 1000 people
Death Rate
No. of deaths per 1000 people
Source Country
Country that migrants originally come from
Asylum Seeker
Person who leaves a country for fear of safety
Host Country
Country where the migrant has settled
Densely Populated
A large number of people who live within the same area (in square miles)
Sparsely Populated
A small number of people who live within the same area (in square miles)
Population Density
No. of people who live within a square mile
Sitting Factors
Factors like water supply, food supply and energy that influence how many people can live in an area
One Child Policy
Recently relaxed to allow parents to have 2 children
1979
Restricted parents to only one child
Little Emperor Syndrome
Children with no siblings receiving excessive attention from parents and grandparents, making them demanding
Gender Imbalance
When there is a greater no. of males than females for a variety of reasons within a society
DTM
A graph that shows the rising/falling birth and death rate for each developmental stage of a country
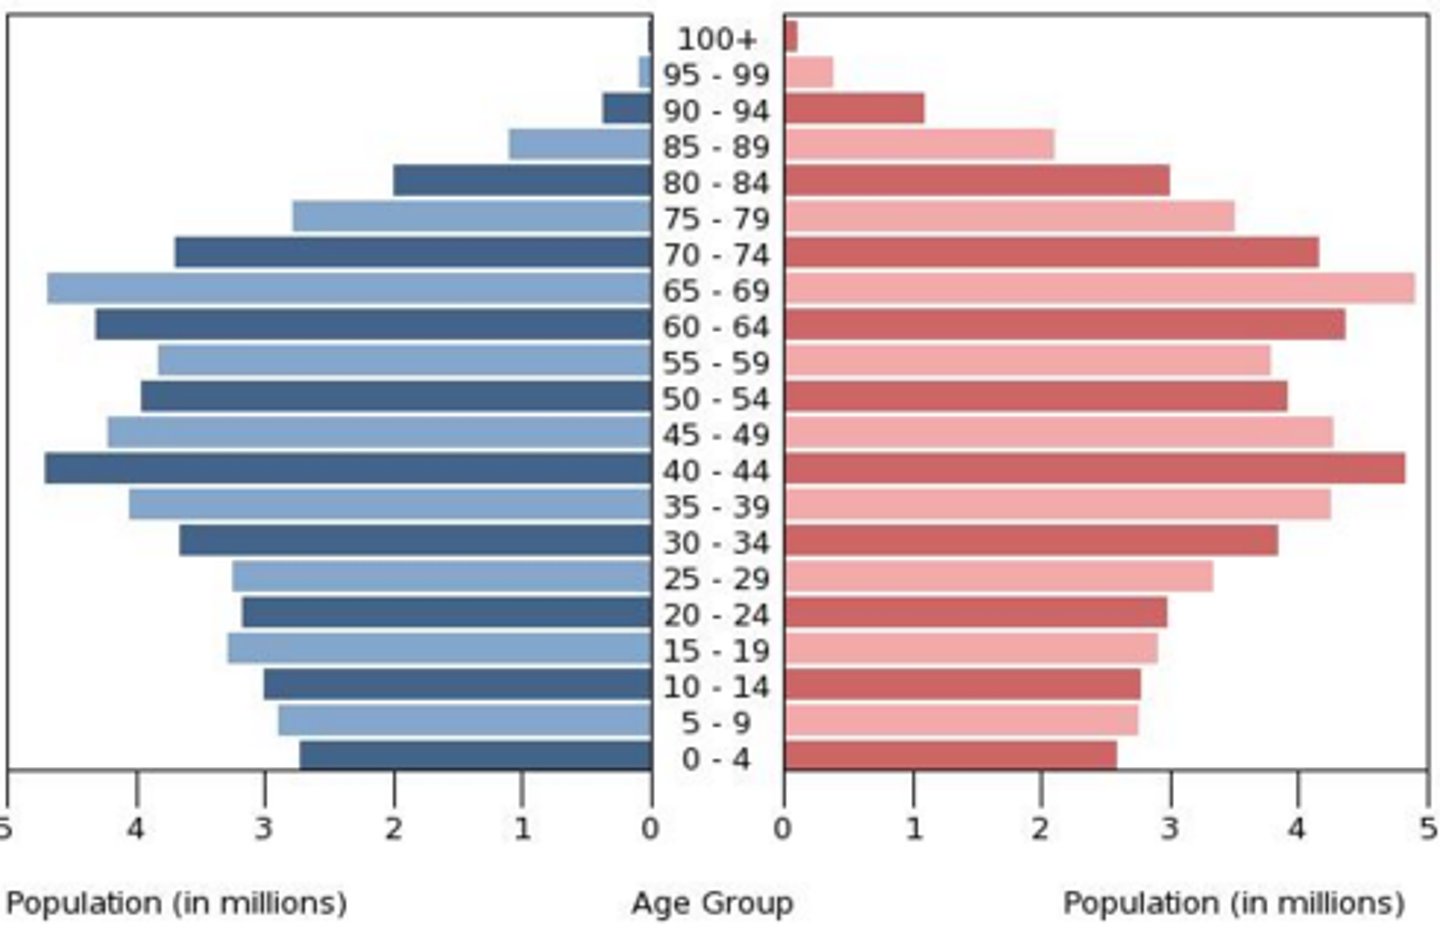
Population Pyramid
A graph that shows the population structure of a country (separating males and females into different groups)
Economically Active
16-65
Working age
Capable of paying taxes
Economically Dependant
1-15 and 65+
too old/young to work
dependant on state for education/welfare
Factors that increase population
More children needed to work on farms
Improved healthcare
Good harvest=reliable food source
Cultural tradition
Factors Decreasing Population
War
Expensive childcare
Widespread disease
Education
Food shortage/famine
Features of Population Pyramid
Gender
% of Population
Age (in 5-year age bands)
Dependants
The very old/very young who can’t support themselves
Natalist Policy
Scheme or law that a govt. may adopt in order to control their population.
Pro-natalist Policy
Encouraging families to have more children. Ex: Sweden, Iran and France
Anti-Natalist Policy
A policy that would encourage families to have fewer children. Ex: One-child policy in China, introduced in 1978-1980
Migration
Movement of people from one place to another
Voluntary Migration
People choose to leave an area
Forced Migration
People have no choice but to leave an area
International Migration
People move from one country to another
Rural-Urban Immigration
People move from the countryside to the city
Push Factors
Negative factors that make people want to leave an area
Pull Factors
Positive factors that attract people to an area
Economic Migration
Migrating for better employment/money opportunities
Refugee
Person who migrates to escape conflict, war or natural disasters
Reasons for Migration
Economic: work
Social: family
Political: war
Environmental: natural disasters
China’s One Child Policy Introduced
1979
In the first half of the 19th century, children were wanted for:
Agriculture
Military Strength
Reasons for One Child Policy
Famine in 1956-61, killed 35M
Population had doubled, reached around 1M
Chinese favoured sons
Not enough food, water and resources
Rules for One Child Policy
one child.
if you lived in rural China and your firstborn was a daughter, you could have a son
Penalties: One Child Policy
10% pay cut
Second child abroad couldn’t be a citizen
Colleagues would have their pay cut
Healthcare and Education weren’t free
‘Granny Police’ were in charge of enforcing it
Positive Effects: One Child Policy
Food is readily available
Standard of living improved
Prevents famine
Tech/Education
Development of women
Negative: One Child Policy
Fertility rate dropped from 2.9 to 1.8
Gender imbalance
Girls were unwanted
60M more men than women
Aging population
Little Emperor Syndrome
Effectiveness: One Child Policy
Population decreased (250 M)
Higher standards of education
Little Emperor Syndrome
Gender Imbalance
France Code de la Famille: Introduced
1939
Country Details: France Code de la Famille
21% of the population was over 60
By 2050, 1/3rd of the population would have been over 60+
The support ratio fell from 7.8 to 4.4 between 1901 to 1995
Costs the govt. €12.9B each year to support the elderly
Reasons for Introduction: France Code de la Famille
Very few economically active people
Over 21% of the population is over 60, and by 2050 1/3rd would’ve been 60+
Govt. was paying €12.9 for social security and healthcare of the elderly
Reasons for reduction in the fertility rate in France
increased population of educated women
Women having children later
Women choosing not to have children
Incentives: France Code de la Famille
20-40 weeks paid maternity leave
About €1000 if you have 3 or more kids
free entrance to public pools and facilities
subsidised childcare for children of upto 3 months
full pensions for mothers of multiple children
Effects: France Code de la Famille
Fertility rate increased to 1.98 from 1.67 in 1992
Costs the govt. billions of euros/ a year
Strain on treasury and offering services due to costs
How successful has the France Code de la Famille been?
Costs money anyway
Increased fertility rate
Some say population rise is due to immigration
UN predicts it won’t rise to predicted levels of 75M
Unsustainable in long term