MDM4U: Unit 3 - One Variable Statistics Test
0.0(0)
Studied by 2 people Call Kai
 Learn
Learn Practice Test
 Spaced Repetition
 Match
Match Flashcards
 Knowt Play
Card Sorting
1/50

Earn XP
Description and Tags
Last updated 2:03 AM on 11/17/22
Name | Mastery | Learn | Test | Matching | Spaced | Call with Kai | Chat |
|---|
No analytics yet
Send a link to your students to track their progress
51 Terms
1
New cards
Frequency
the number of times a value for a variable occurs in a data set.
2
New cards
Frequency Table
a table listing a variable together with the corresponding frequency of each value. It can be used for numerical or categorical data.
3
New cards
Stem & Leaf Plot
A way to organize a collection of numbers. Particularly useful for a data set that is large and has a large range of values. Useful for numerical data only.
4
New cards
Relative Frequency
the frequency of each class as a proportion/percent of the entire data set. The number of items divided by the total.
5
New cards
culmulative frequency
the total/sum of all the frequencies up to and including a certain value of the variable in an ordered set of measures.
6
New cards
Frequency table
Best for organizing
7
New cards
Stem and leaf plot
Best for trends
8
New cards
Mean
the sum of all variables in a data set, divided by the number of values
9
New cards
Median
the middle value of an ordered data set
10
New cards
Mode
value that occurs the most frequently in a data set
11
New cards
Outlier
a value in a data set that is very different than all others.
12
New cards
Outliers
will affect the mean the most
13
New cards
Outliers
Use the median to avoid misrepresenting the data.
14
New cards
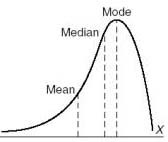
mean < median < mode
Left skewed
15
New cards
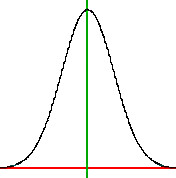
mean = median = mode
symmetrical
16
New cards
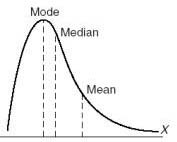
mean > median > mode
right skewed
17
New cards
Quartiles
divide an ordered data set into four equal sized groups
divided into - lower quartile (Q1), the median (Q2) & upper quartile (Q3)
divided into - lower quartile (Q1), the median (Q2) & upper quartile (Q3)
18
New cards
Interquartile Range (IQR)
Contains the middle 50% of the data
Calculated using Q3 - Q1
Calculated using Q3 - Q1
19
New cards
The larger the interquartile range
the larger the spread of the middle portion of the data
20
New cards
Semi-Interquartile Range
to help us determine if the data set is symmetrical or skewed
21
New cards
Box-and-whisker plot
illustrates these measures of: Q1, Median, Q3, IQR and Range
22
New cards
Data contains outlier
use modified box-and-whisker plot
23
New cards
Outlier
if value is
> Q3 + 1.5IQR
> Q3 + 1.5IQR
24
New cards
Outlier
if value is
< Q1 - 1.5IQR
< Q1 - 1.5IQR
25
New cards
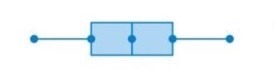
Data is Symmetric
Median is centred to the box plot
Whiskers are equal length
S-IQR will be equal
Whiskers are equal length
S-IQR will be equal
26
New cards
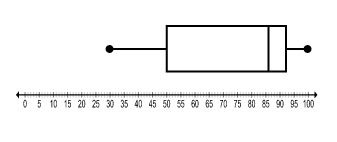
Left Skewed
- box is located further to the right
- left whisker is generally longer
- median is further to the right of the box
- Q2 - Q1 > Q3 - Q2
- left whisker is generally longer
- median is further to the right of the box
- Q2 - Q1 > Q3 - Q2
27
New cards
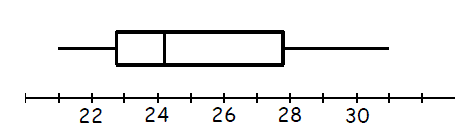
Right skewed
- box located further left
- right whiskers generally longer
- media further to the left in the box
- Q2 - Q1 < Q3 - Q2
- right whiskers generally longer
- media further to the left in the box
- Q2 - Q1 < Q3 - Q2
28
New cards
Five number summary
useful in descriptive analyses or during the preliminary investigation of a large data set.
29
New cards
Five number summary
- Median identifies the centre of a data set.
30
New cards
Five number summary
upper and lower quartiles span the middle half of a data set
31
New cards
Five number summary
highest and lowest observations provide information about the dispersion of data
32
New cards
Percentiles
divide an ordered data set into 100 equal sized groups
33
New cards
z-SCORES
the number of standard deviations that a data point is from the mean
34
New cards
Range
the difference between the largest and smallest score in the data set
it indicates how spread out the data is from two extreme values in the data set
it indicates how spread out the data is from two extreme values in the data set
35
New cards
Deviation
the difference (distance) between an individual value in a data set and the mean for the data
36
New cards
Deviation
= value - mean
37
New cards
Average Deviation
Sum all dev / number of values
38
New cards
Larger the size of the deviation
the greater the spread in the data
39
New cards
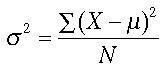
Variance
the average of the squared deviatioins.
40
New cards
Variance
Take all the deviations of an entire data set, square each deviation and find the means of these values
41
New cards
Variance Formula
42
New cards
Standard Deviation
measure of spread that approximates the standard/typical distance each value is from the mean
43
New cards
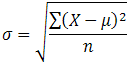
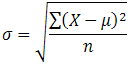
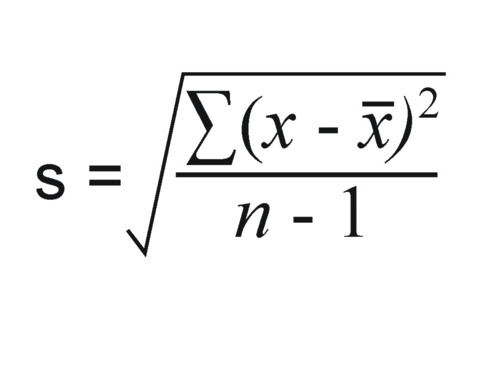
Standard Deviation Formula
the square root of the variance
- go to formula
- go to formula
44
New cards
Standard Deviation for entire population formula
45
New cards
Standard Deviation for sample population formula
46
New cards
Calculating Variance
1. Calculate the mean of the data set
2. Calculate the deviation for each data point, and then square them
3. Calculate the average of these squared deviations
2. Calculate the deviation for each data point, and then square them
3. Calculate the average of these squared deviations
47
New cards
Calculating Standard Deviation
1. Calculate the Variance
2. Calculate the square root of the variance
2. Calculate the square root of the variance
48
New cards
Coefficient of variation
refers to a statistical measure of the distribution of data points in a data series around the mean.
49
New cards
Coefficient of variation
Represents the ratio of the standard deviation to the mean.
50
New cards
Coefficient of variation
helpful in comparing the degree of variation from one data series to the other, although the means are considerably different from each other
51
New cards
Coefficient of variation
is a measure of spread that describes the amount of variability relative to the mean.