11. Visualizing in 3D
1/29
There's no tags or description
Looks like no tags are added yet.
Name | Mastery | Learn | Test | Matching | Spaced | Call with Kai |
|---|
No study sessions yet.
30 Terms
What is meant by 3D visualization?
3D visualization is the process of transforming complex (sometimes abstract) 3D data into an intuitive graphical representation with the goal of gaining insight - not just producing visually appealing graphics.
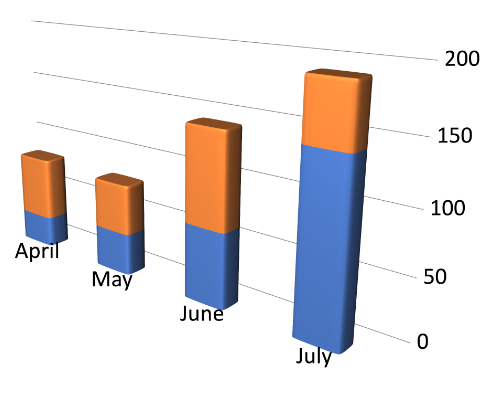
Why is 3D visualization often criticized in information visualization?
Because it frequently adds visual clutter, occlusion, perspective distortion, and cognitive load without improving understanding - especially when used for inherently 2D data like bar charts.
When does 3D visualization actually make sense?
When the data is inherently spatial or volumetric so spatial relationships are critical.
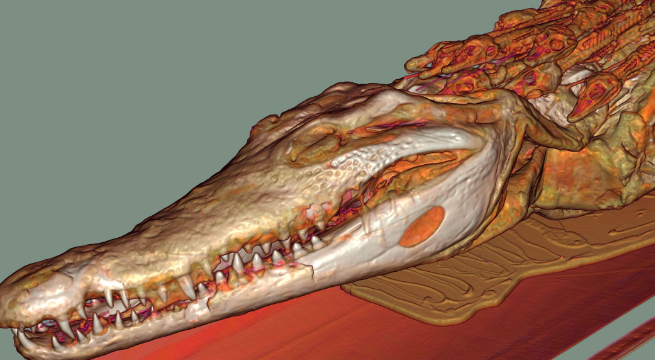
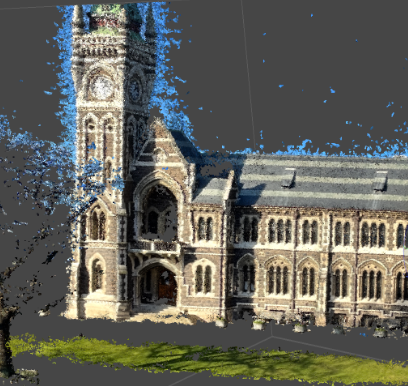
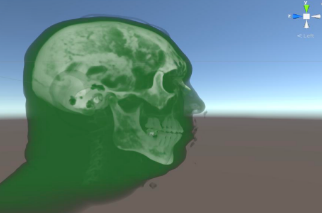
Give examples of domains that naturally produce 3D data.
Medicine (CT/MRI), geoscience, photogrammetry
Why can 2D projections be insufficient for 3D data?
They can obscure spatial correspondence, hide internal structures, and make occluded surfaces invisible, which leads to loss of information.
What is occlusion and why is it a core challenge in 3D visualization?
Occlusion occurs when objects block the view of other objects in 3D scenes. It makes it difficult to perceive structure and relationships without interaction or additional visual cues.
What is depth ambiguity?
Depth ambiguity occurs when users cannot accurately judge which objects are closer or farther away due to missing or insufficient depth cues.
Why does navigation in 3D increase cognitive load?
Because users must continuously manipulate viewpoint, orientation, and scale (rotate, pan, zoom), which adds mental effort compared to static 2D views.
Name key depth cues used in 3D visualization.
Shading, shadows, occlusion, relative size, height in the visual field, motion parallax, and perspective projection.
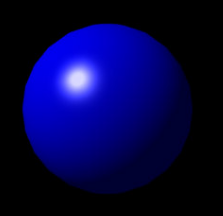
Why are shading models like Phong or Blinn-Phong important?
They convey surface shape and curvature by modeling how light interacts with geometry, making 3D form perceptually understandable.
What is the main goal of the 3D visualization pipeline?
To transform raw 3D data into a meaningful visual representation through filtering, mapping, and rendering in order to support insight.
What are the main stages of the 3D visualization pipeline?
Raw data → filtering (data preparation) → mapping to visual properties → rendering (lighting, shading, projection).
Why is the mapping step often called the “artistic” step?
Because design decisions are made about how data values map to visual variables such as color, opacity, and geometry, strongly influencing interpretation.
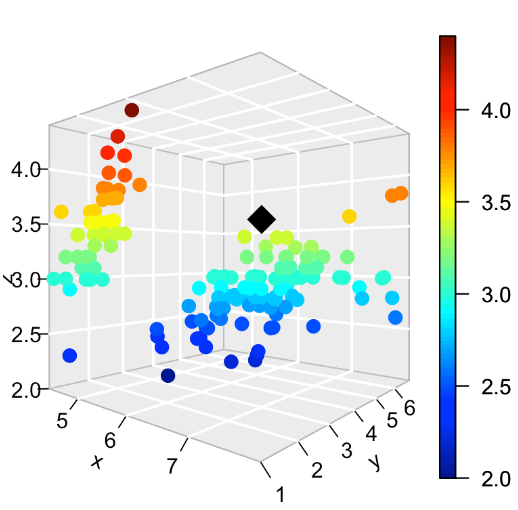
What is meant by data density in 3D visualization?
3D allows encoding more information using x, y, z plus additional channels like color, size, and opacity - but this must be used carefully to avoid overload.
Why is 3D visualization “not always better”?
Because occlusion and projection issues can obscure data, and hybrid approaches (linked 2D + 3D views) often outperform pure 3D.
What are the main types of 3D data?
Scalar fields (volumes), vector fields (flows), geometric data (meshes, point clouds), and multivariate spatial data (geometry + attributes).
How do scalar fields differ from vector fields?
Scalar fields store a single value per location (e.g. density), while vector fields store magnitude and direction (e.g. wind velocity).
How do 2D visualization concepts map to 3D?
2D positions map to 3D coordinates, marks map to geometry and materials, projections become camera models, and interactions expand to orbiting and slicing.
What is the role of the camera model in 3D visualization?
It defines viewpoint, field of view, and projection type, determining how 3D data is transformed into a 2D image.
Compare perspective and orthographic projection.
Perspective projection mimics human vision with distance-based scaling.
Orthographic projection preserves size and parallelism and is used in CAD and engineering.

Why are point clouds hard to interpret visually?
Because points alone lack surface information, making shape perception difficult without shading, normal estimation, or splatting.
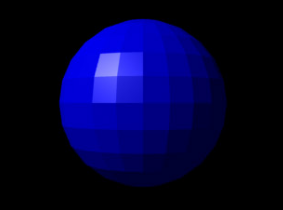
What are common techniques for rendering polygonal surfaces?
Wireframe rendering, flat shading, smooth shading (Gouraud/Phong), and texturing.
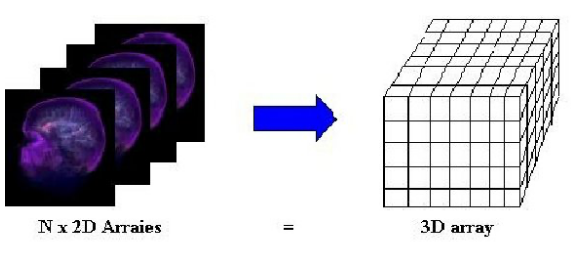
What is volume data?
Data defined on a 3D grid of voxels, often originating from simulations or medical imaging, where each voxel contains a value like density.
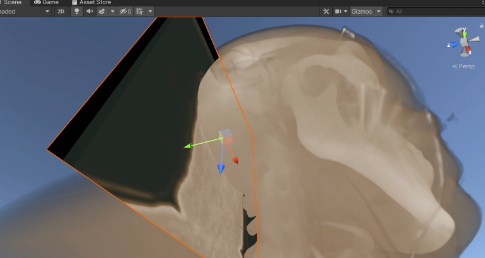
What is volume slicing?
An interactive technique that displays 2D slices through volume data to explore internal structures layer by layer.
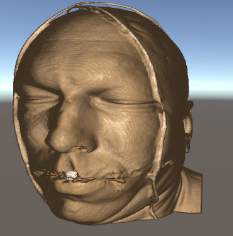
What is indirect volume rendering?
A technique that extracts surfaces (isosurfaces) from volume data, often using algorithms like marching cubes.
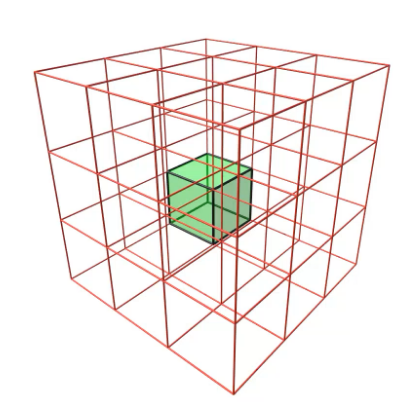
What is the marching cubes algorithm?
An extension of marching squares to 3D that extracts isosurfaces by evaluating voxel configurations and constructing triangle meshes.
What is direct volume rendering?
A technique that renders volume data directly by casting rays through the volume and computing color and opacity contributions from voxels.
What is a transfer function in volume rendering?
A mapping from data values (e.g. density) to visual properties like color and opacity, crucial for revealing structures such as bone or tissue.
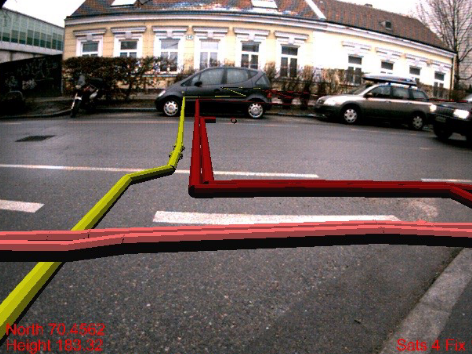
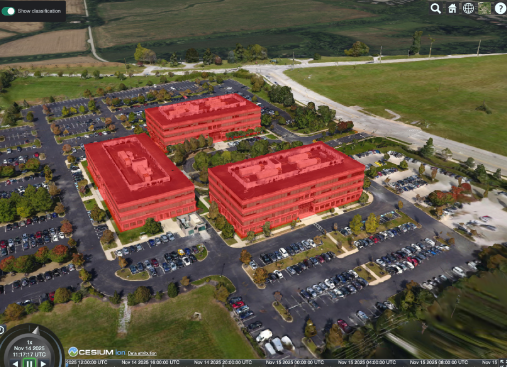
What is meant by situated visualization in AR?
A visualization that is spatially embedded in and semantically related to the physical environment in which it is viewed.
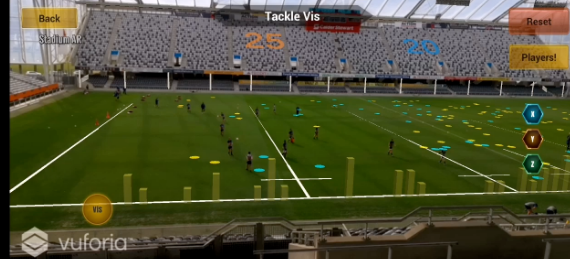
Why is visual coherence a major challenge in AR visualization?
Because missing depth cues (occlusion, shadows) and inaccurate registration can make virtual objects appear to float or detach from the real world.