C1.3: Photosynthesis | IB Biology HL
1/49
Earn XP
Description and Tags
Name | Mastery | Learn | Test | Matching | Spaced |
|---|
No study sessions yet.
50 Terms
Outline how light energy is converted to chemical energy in carbon compounds.
C1.3.1: Transformation of light energy into chemical energy when carbon compounds are produced in photosynthesis.
Light energy is converted to chemical energy in carbon compounds through photosynthesis.
This process of photosynthesis requires inorganic molecules (CO2 and H2O) in the presence of sunlight to synthesize them into organic compounds (glucose). It requires chlorophyll.
List three reasons why living organisms need energy for cell activities.
C1.3.1: Transformation of light energy into chemical energy when carbon compounds are produced in photosynthesis.
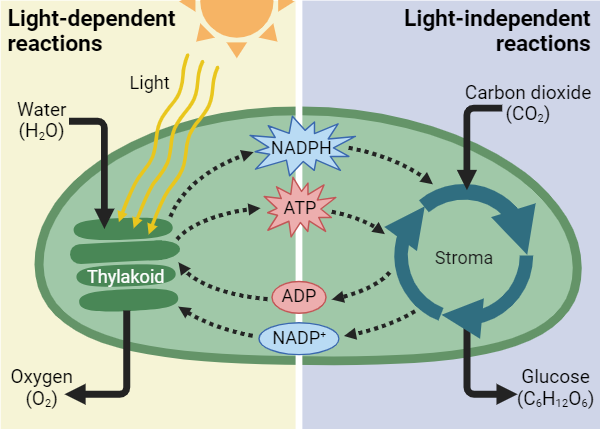
Cells need to synthesize large molecules like DNA and proteins.
Cells need to actively transport molecules and ions across the cell membrane.
Cells need to move structures (like vesicles and chromosomes) within a cell.
State the principal energy source in most ecosystems.
C1.3.1: Transformation of light energy into chemical energy when carbon compounds are produced in photosynthesis.
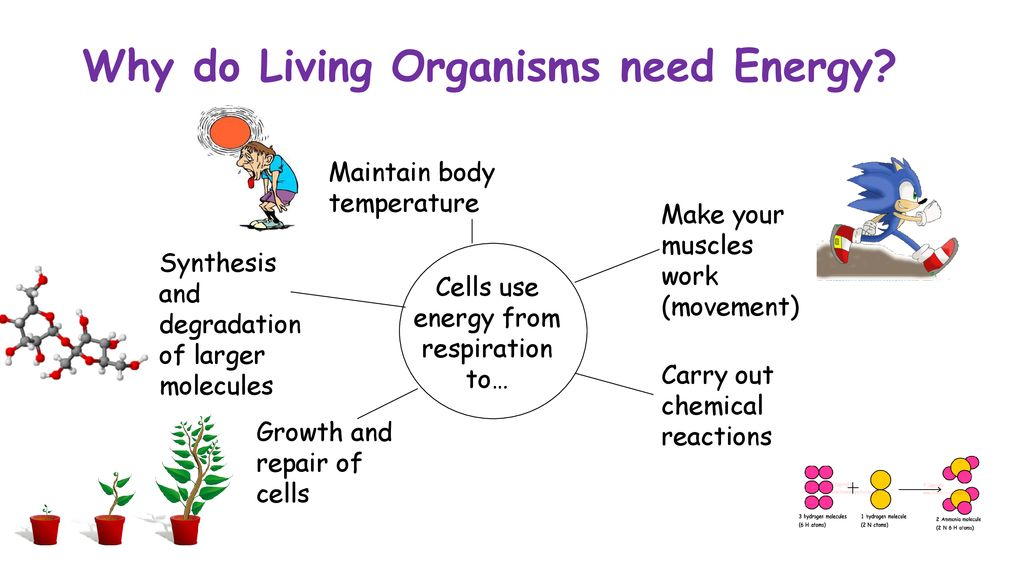
Sunlight is the principal energy source in most ecosystems.
Draw a flowchart to illustrate the flow of energy between living organisms.
C1.3.1: Transformation of light energy into chemical energy when carbon compounds are produced in photosynthesis.
State the chemical equation for photosynthesis
C1.3.2: Conversion of carbon dioxide to glucose in photosynthesis using hydrogen obtained by splitting water.
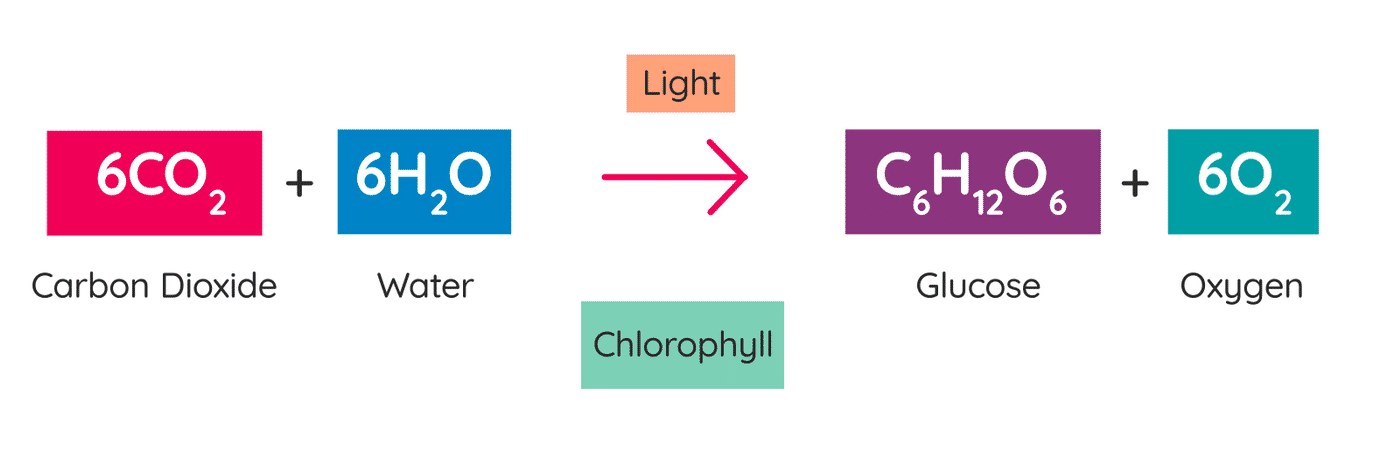
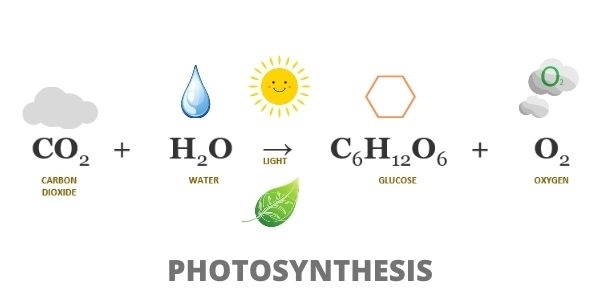
Carbon dioxide + Water —(light)—> Glucose + Oxygen
6 CO2 + 6 H2O —> C6H12O6 + 6 O2
Outline the source of the atoms used to form glucose (C6H12O6) during photosynthesis.
C1.3.2: Conversion of carbon dioxide to glucose in photosynthesis using hydrogen obtained by splitting water.
The carbon atoms come from carbon dioxide (6 CO2 = 6 C atoms).
The hydrogen atoms come from water (6 H2O = 12 H atoms).
The oxygen atoms come from carbon dioxide and water (6 CO2 gives 12 O atoms + 6 H2O gives 6 O atoms, so there is a total of 18 O atoms, 12 in the form of O2 and 6 in glucose).
Define photolysis.
C1.3.2: Conversion of carbon dioxide to glucose in photosynthesis using hydrogen obtained by splitting water.
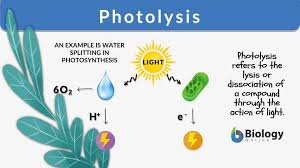
The splitting of water into hydrogen and oxygen gas using light energy absorbed by chlorophyll.
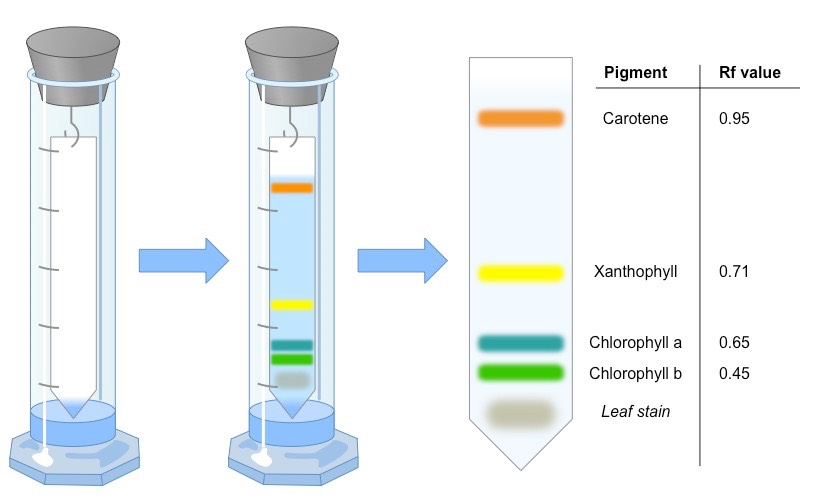
Outline the process of separating pigments using chromatography.
C1.3.4: Separation and identification of photosynthetic pigments by chromatography.
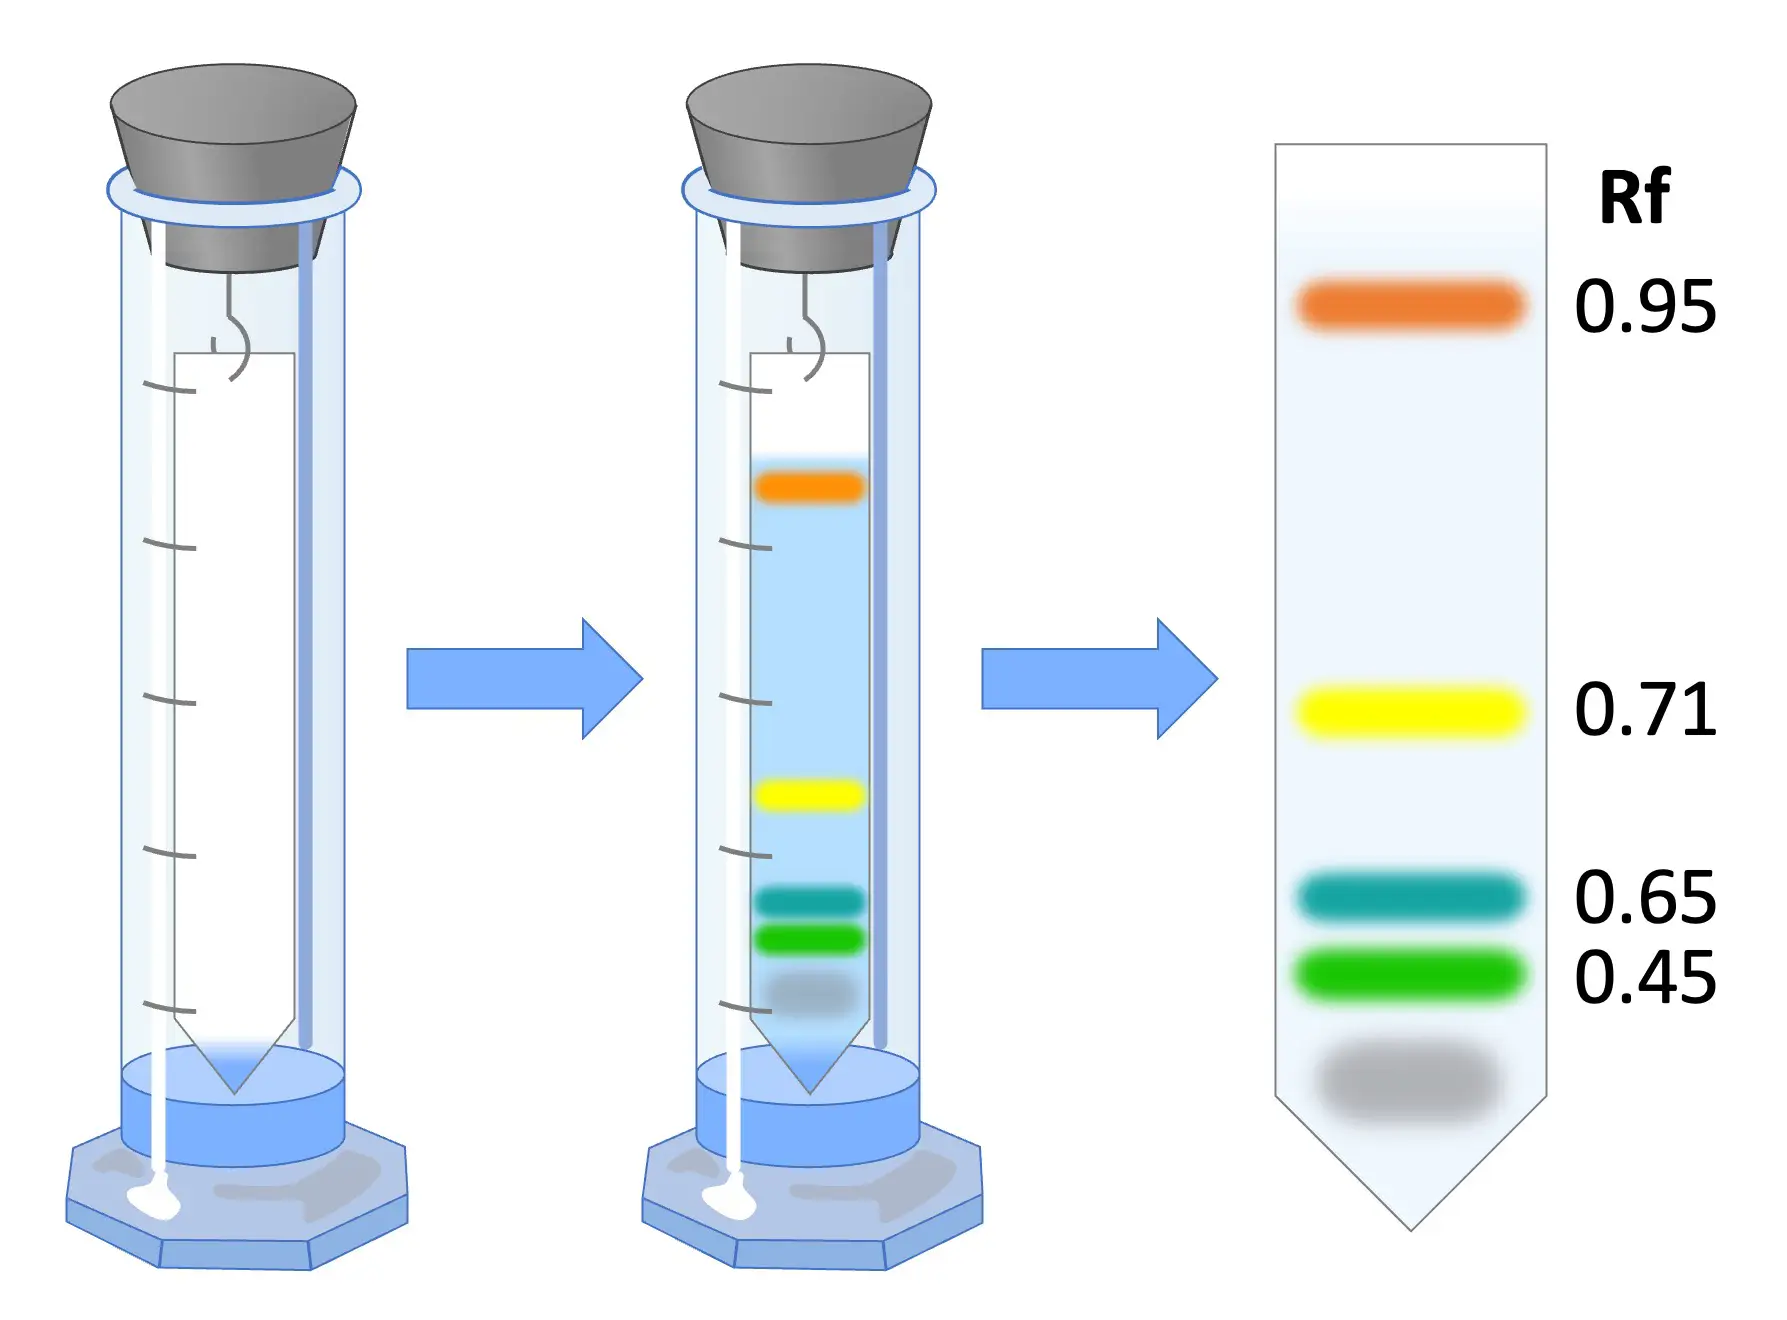
Pigments can be separated using chromatography, an experimental technique.
The pigment is dissolved in a fluid (mobile phase) and rises up through a static material (the stationary phase, like a piece of paper) through capillary action.
Because the different components of the pigment have different densities and masses and compositions, they travel at different speeds. As a result, the components separate.
The 2 most common chromatography techniques include paper chromatography (using paper) and thin-layer chromatography (using a thin layer of adsorbent like silica gel).
Calculate the Rf value.
C1.3.4: Separation and identification of photosynthetic pigments by chromatography.
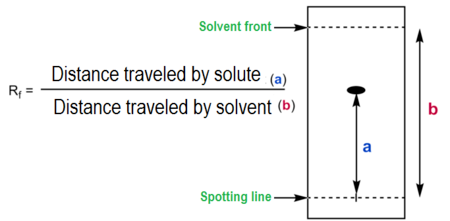
Measure the difference from the origin to the solvent front. This is the distance traveled by the running solvent.
Measure the distance from the origin to the center of the outlined pigment. This is the distance traveled by the pigment.
Calculate the Rf value using the formula
Rf = (Distance traveled by the pigment) / (Distance traveled by the running solvent)
Identify pigments that result from chromatography by color and calculated Rf value.
C1.3.4: Separation and identification of photosynthetic pigments by chromatography.
Chlorophyll is the main pigment in leaves. Chlorophyll a has a typical Rf value of 0.59 and is darker green. Chlorophyll b has a typical Rf value of 0.42 and is lighter green.
Carotenes are an orange-red color that typically has an Rf value of 0.95.
Xanthophylls are a deep yellow color that typically has a Rf value of 0.71
State the range of wavelengths that fall within the visible spectrum.
C1.3.5: Absorption of specific wavelengths of light by photosynthetic pigments.
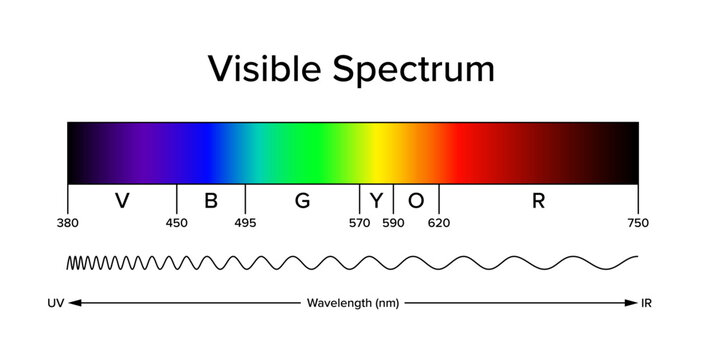
Light in the visible spectrum have wavelengths from 380-700 nm.
Outline the function of pigments.
C1.3.5: Absorption of specific wavelengths of light by photosynthetic pigments.
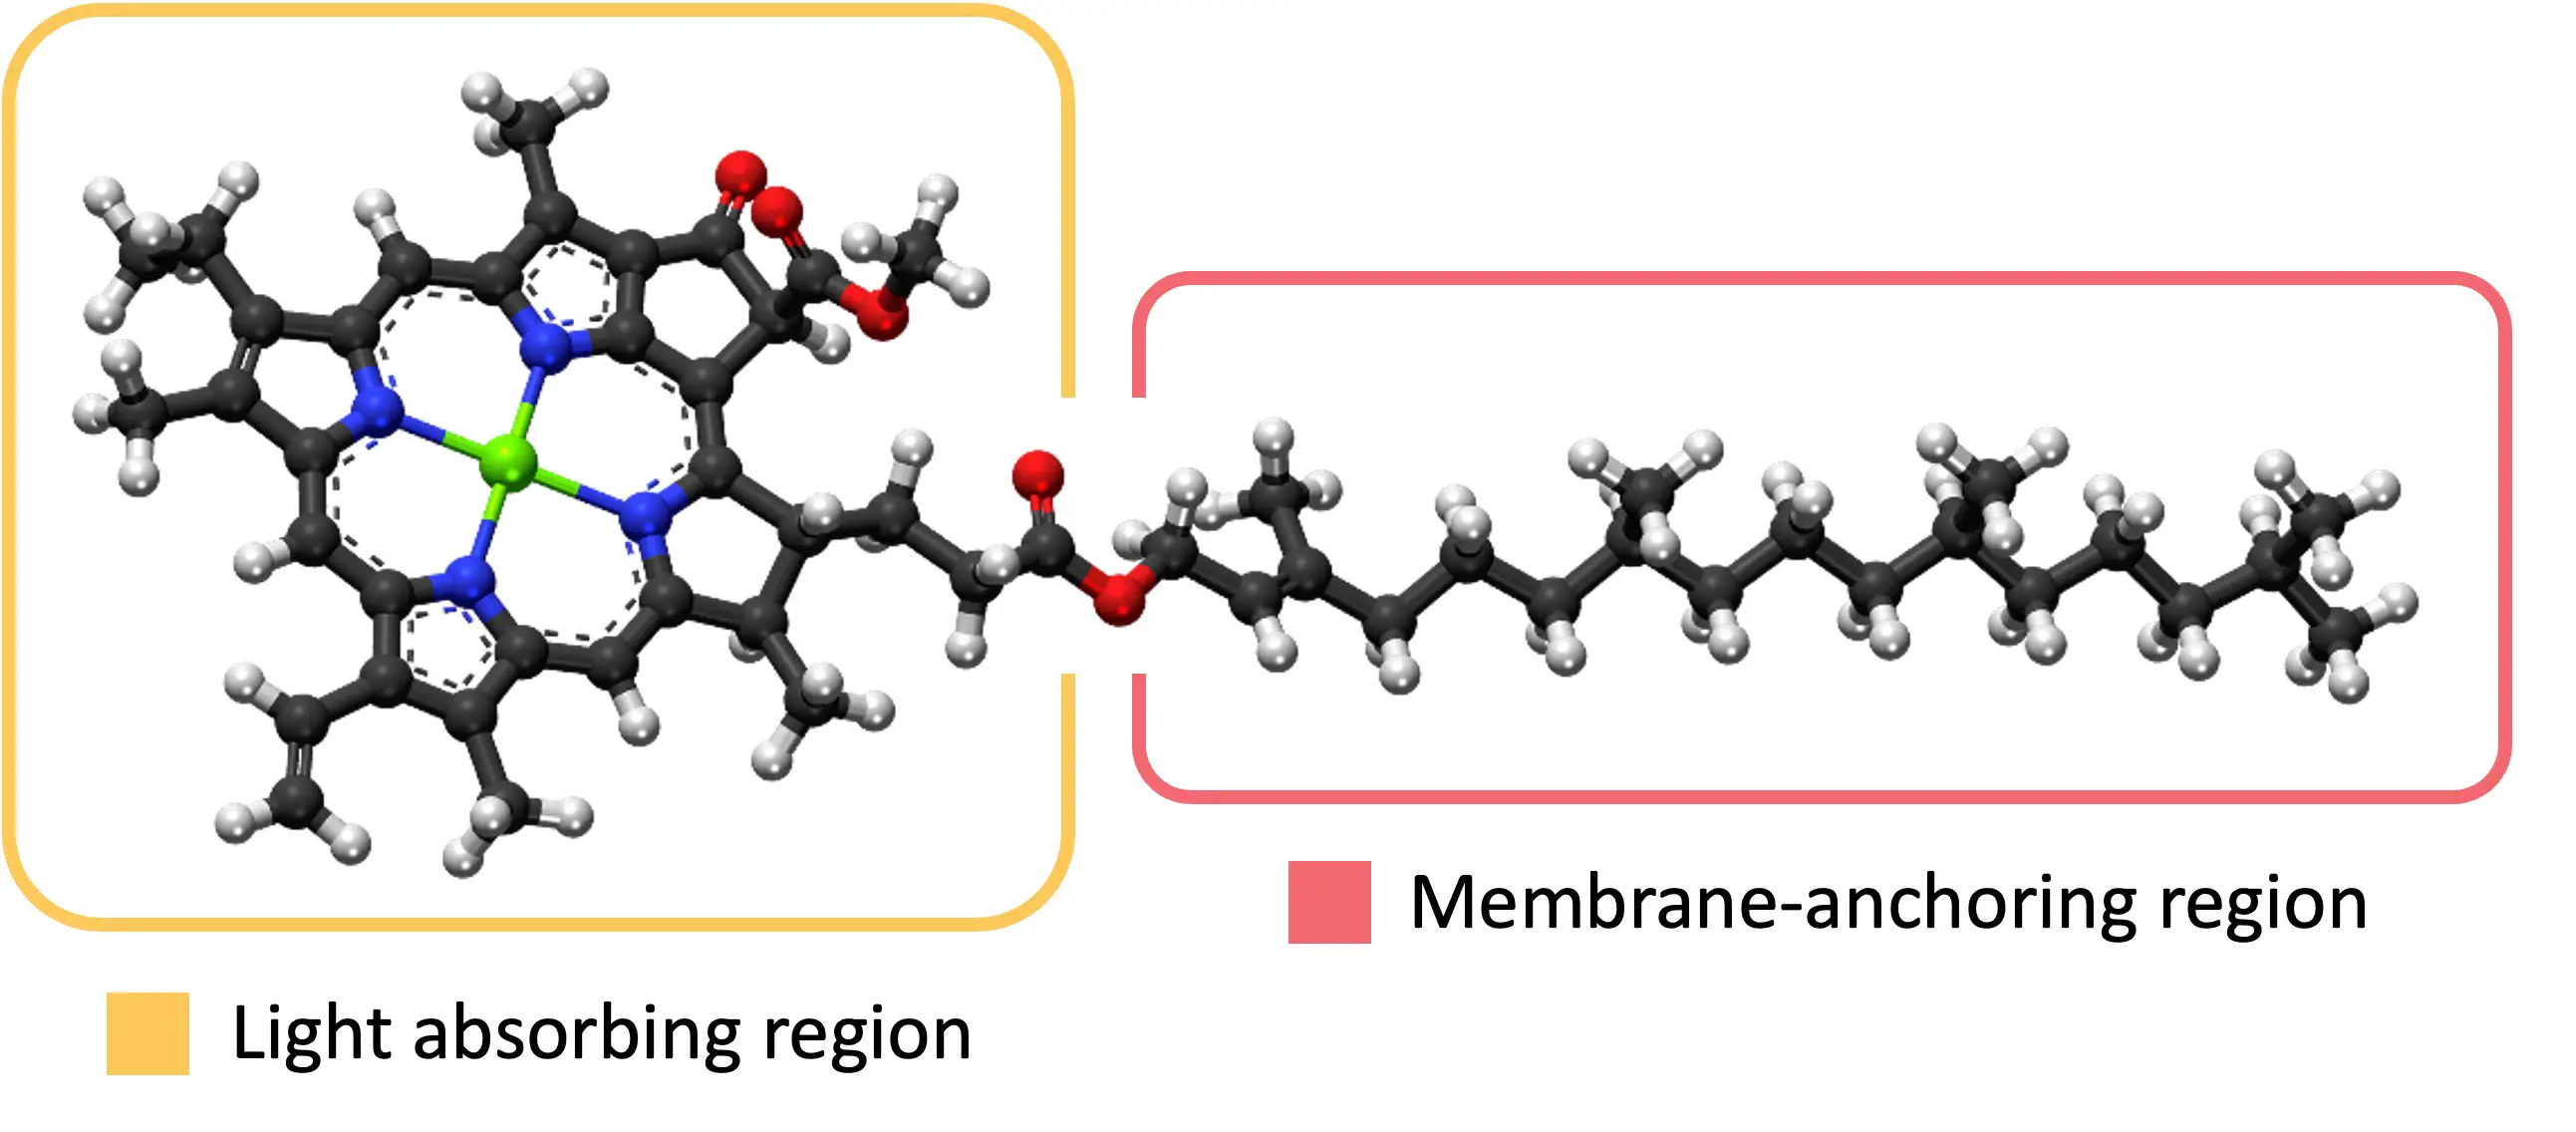
Photosynthetic pigments absorb light. The light energy excites electrons in the pigment, and the cell harnesses this energy to transform light energy to chemical energy
State the primary and accessory pigments found in chloroplasts.
C1.3.5: Absorption of specific wavelengths of light by photosynthetic pigments.
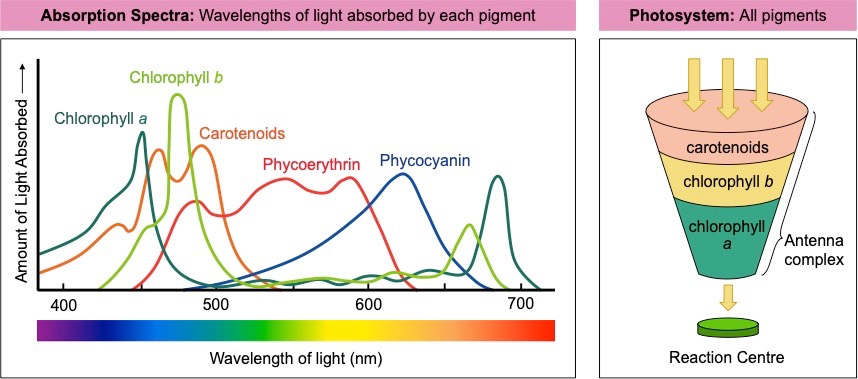
Chlorophyll a is the primary pigment.
Chlorophyll b and carotenoids are accessory pigments.
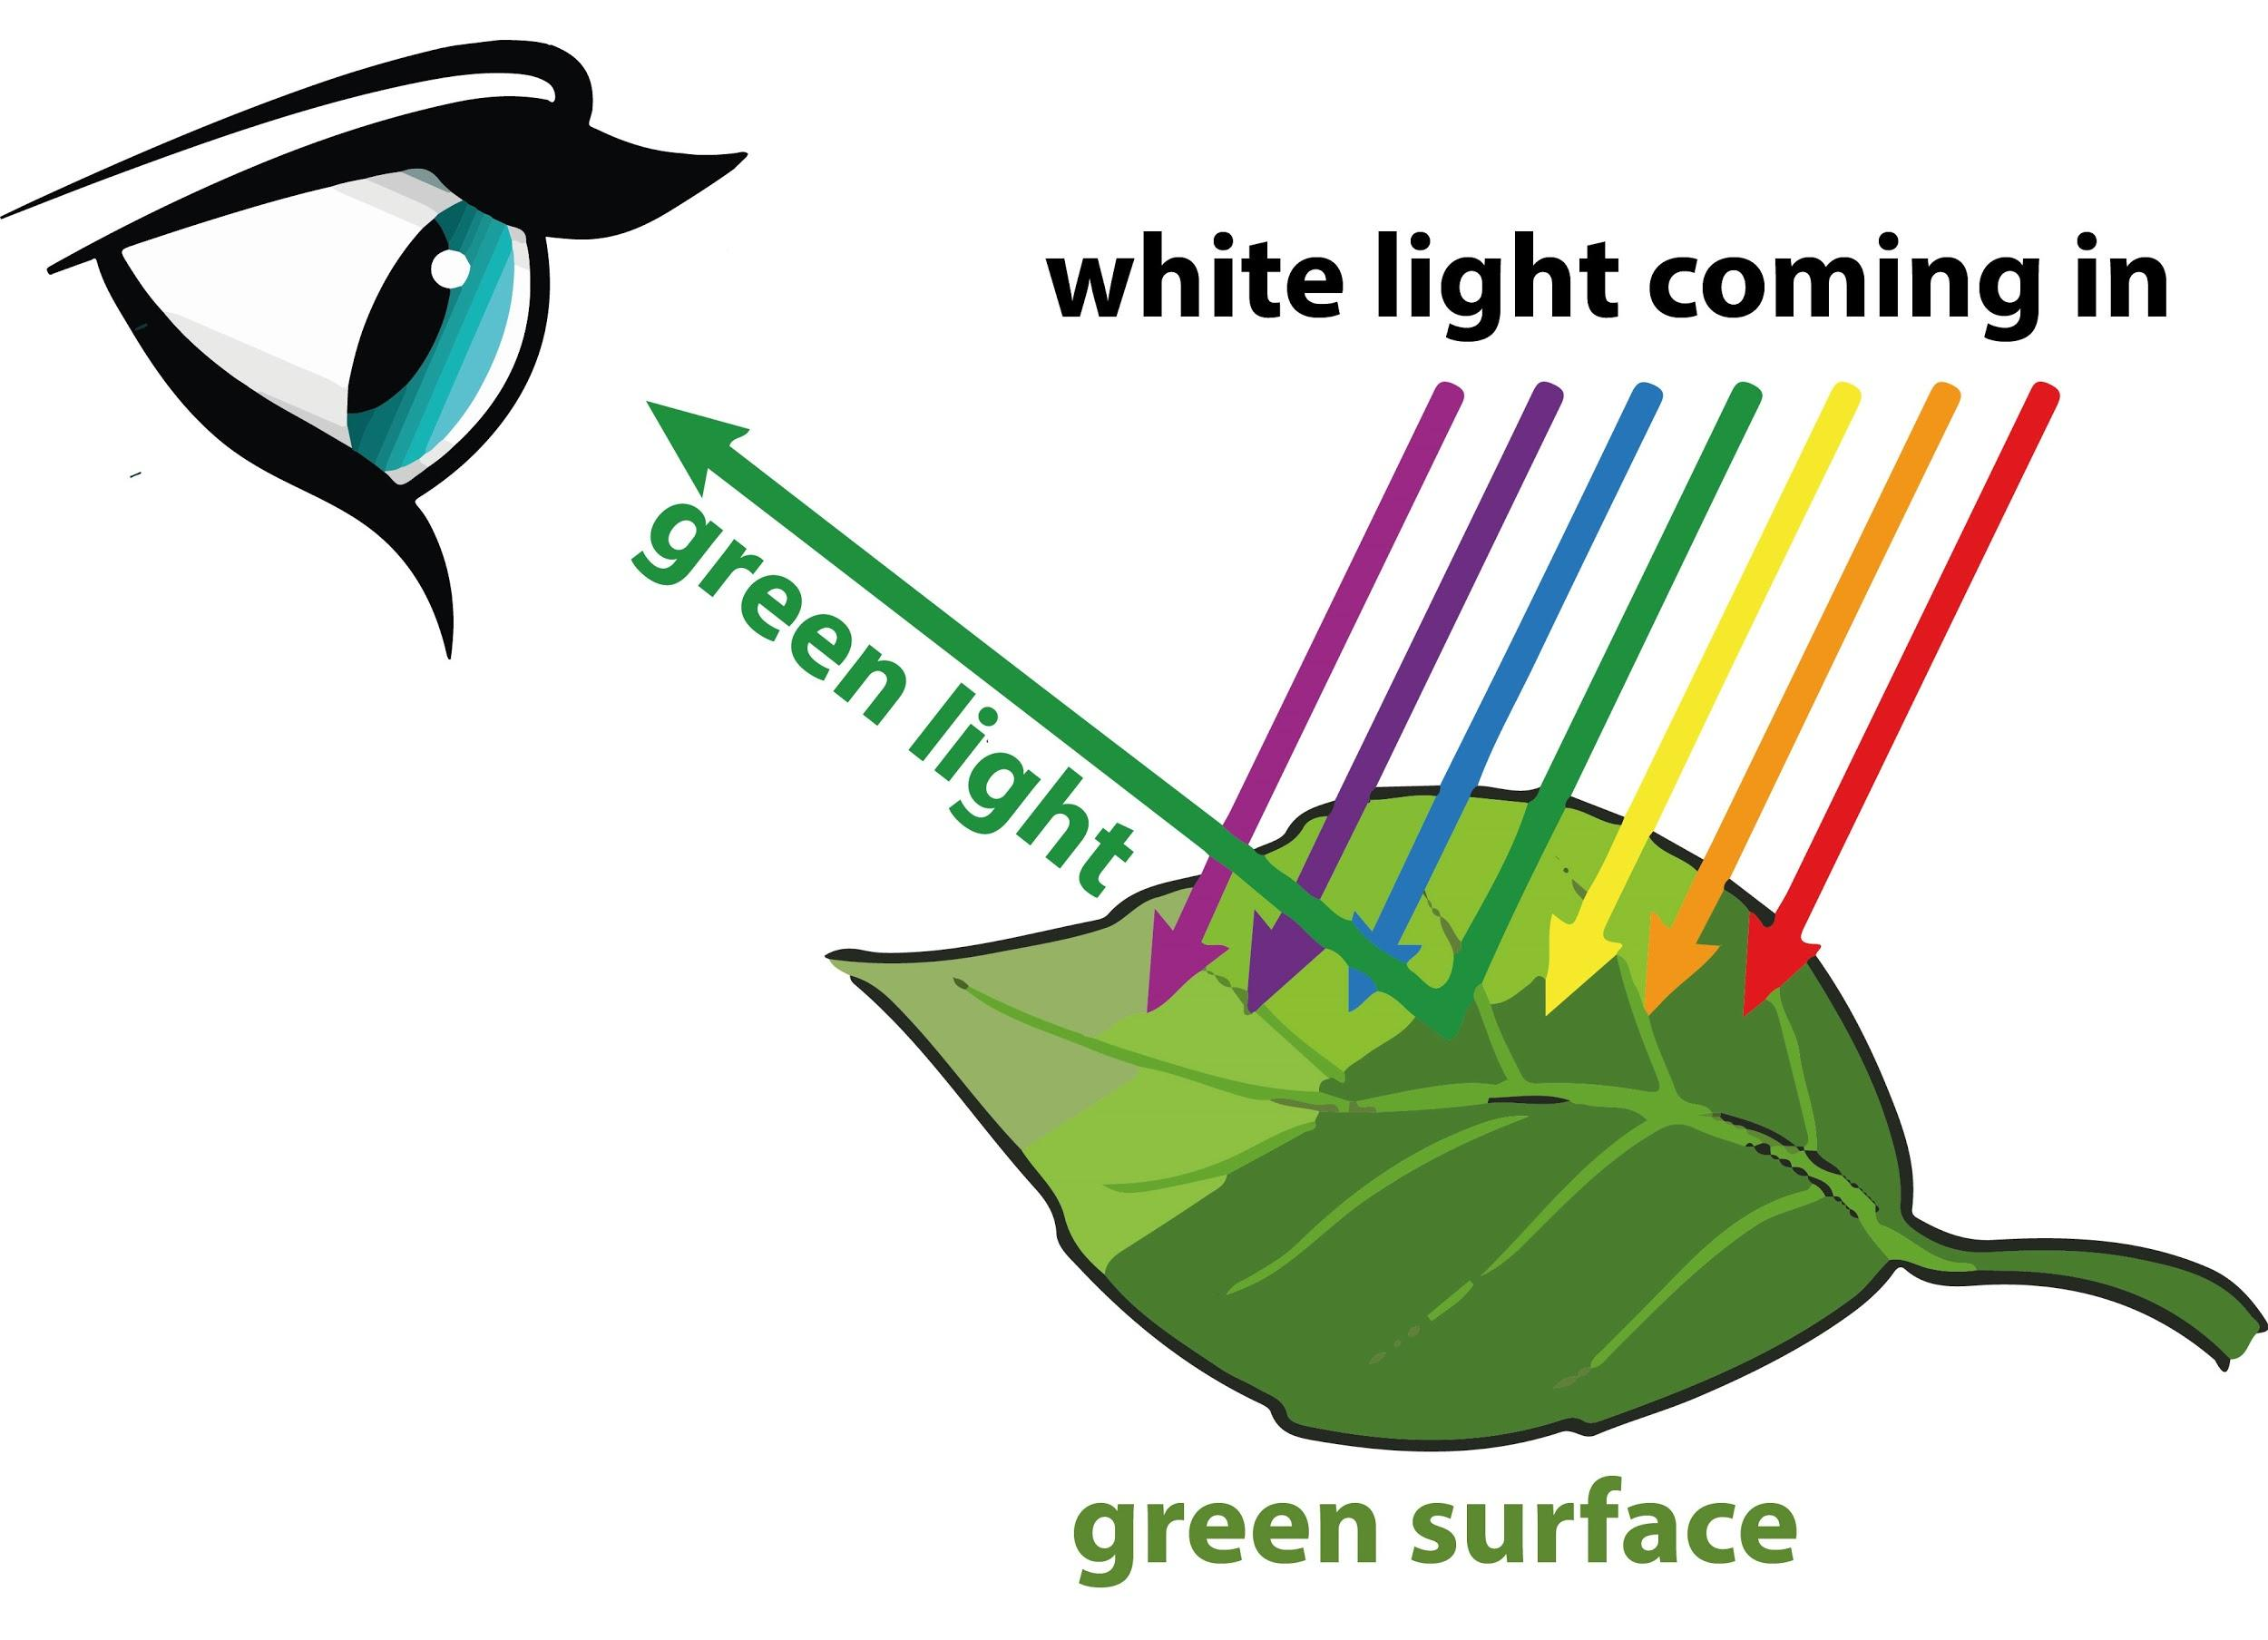
Explain why most plants look green.
C1.3.5: Absorption of specific wavelengths of light by photosynthetic pigments.
A pigment’s structure determines which wavelengths of light it absorbs and which it reflects. Thus, a pigment can only absorb some wavelengths of light.
Chlorophyll a can absorb all wavelengths of light, but it reflects green wavelengths. Because chlorophyll a is the dominant pigment in most plants, most plants primarily reflect green light. This makes plants look green.
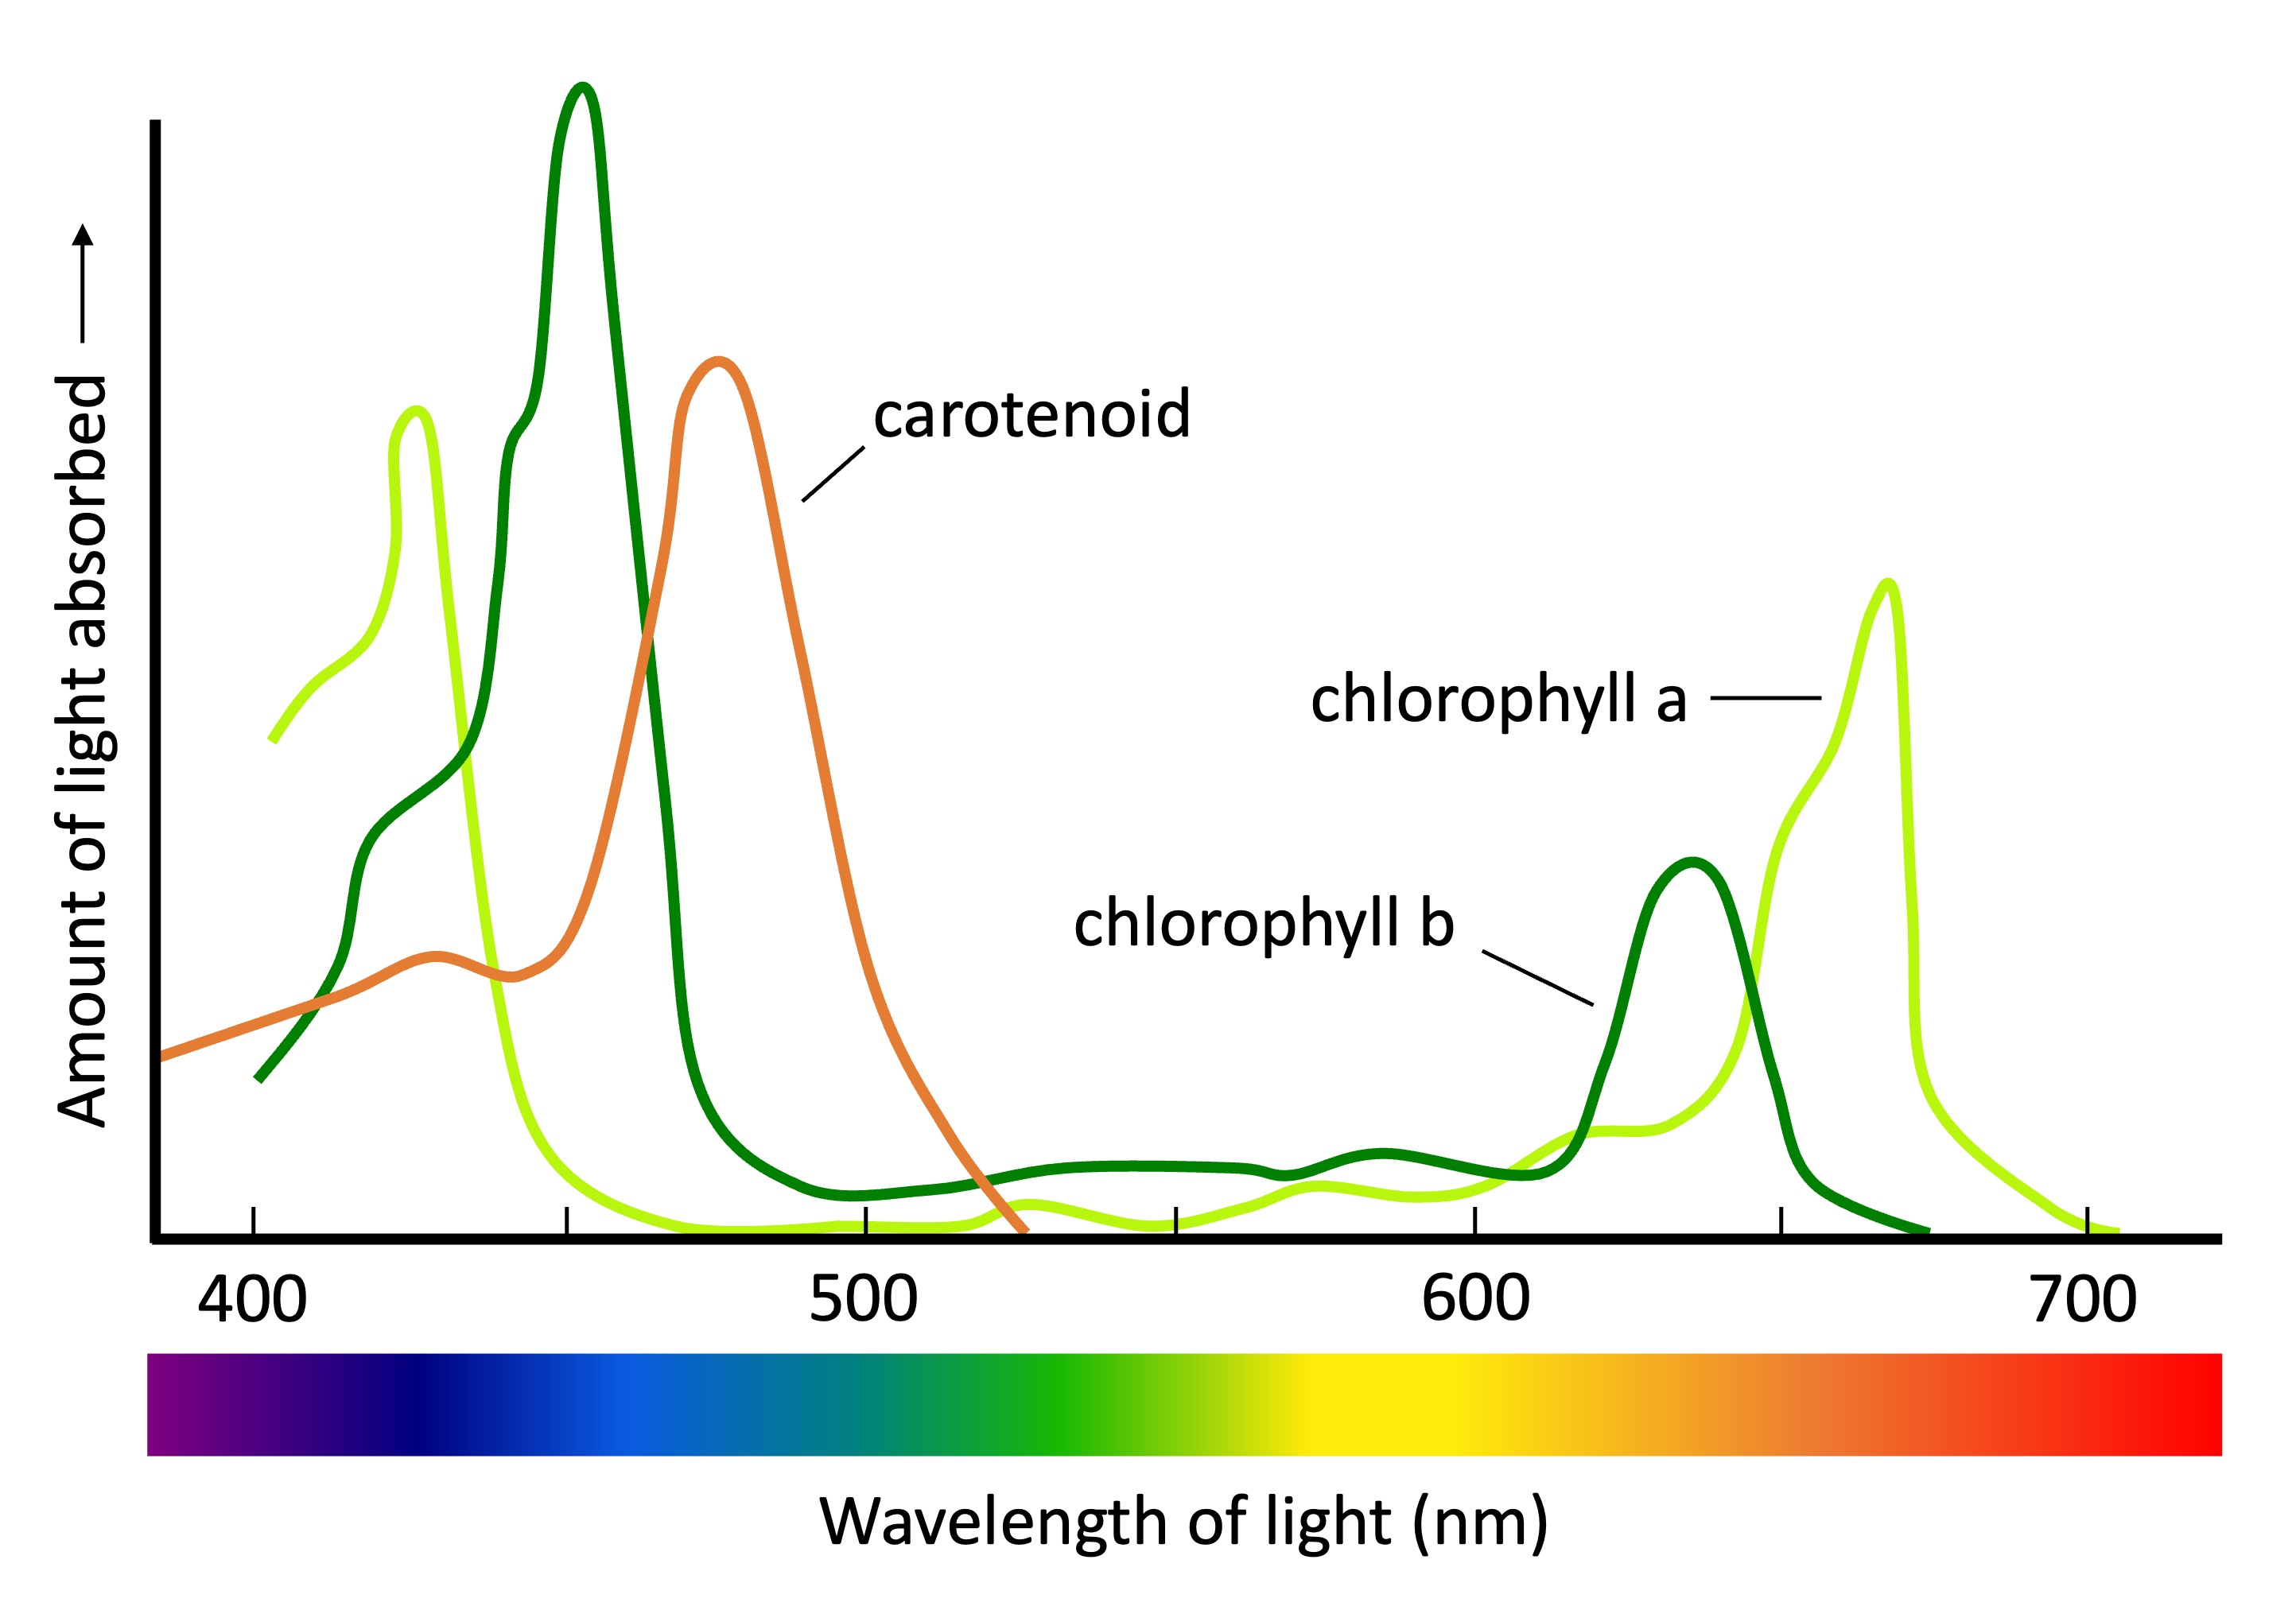
Sketch the chlorophyll pigment absorption spectrum, including both wavelengths and colors of light on the X-axis.
C1.3.5: Absorption of specific wavelengths of light by photosynthetic pigments.
The absorption spectrum shows the wavelengths of light absorbed by a pigment.
On the x-axis is the wavelength of light (nm) and colors of light.
On the y-axis is the amount of light absorbed.
Chlorophyll absorbs blue light (400-500 nm) and red light (650-680 nm) best. It reflects green light (500-570 nm).
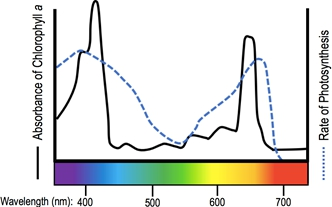
Compare and contrast the action spectrum and absorption spectrum.
C1.3.6: Similarities and differences of absorption and action spectra.
The action spectrum shows the rate of photosynthesis at different wavelengths. On the other hand, the absorption spectrum shows the wavelengths of light absorbed by a pigment.
They are similar in that the peaks for the action and absorption curve are for blue and red wavelengths and a trough for green light.
They are similar in that both of their x-axes is the wavelength of light (nm).
They are different in that the y-axis in an action spectrum is the rate of photosynthesis, while the y-axis in an absorption spectrum is the amount of light absorbed.
They are also different in that the rate of photosynthesis for green light is higher than the light absorbed due to the role of accessory pigments, so the y-value for the action spectrum will be higher than that of the absorption spectrum.
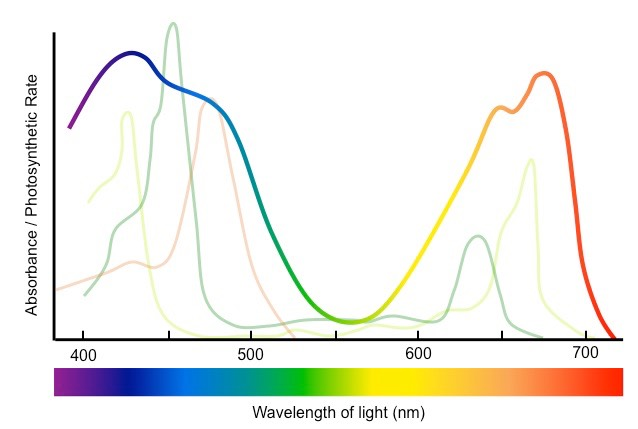
Explain the shape of the curve of the photosynthesis action spectrum.
C1.3.6: Similarities and differences of absorption and action spectra.
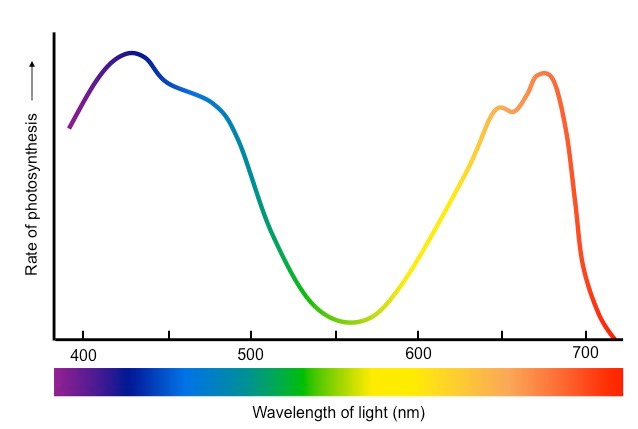
The photosynthesis action spectrum has peaks at blue and red wavelengths because chlorophyll best absorbs blue and red light. As a result, photosynthesis is the most efficient at those wavelengths.
The photosynthesis action spectrum is lowest at green light because chlorophyll poorly absorbs green light, so photosynthesis is the least efficient with green light.
Outline techniques for calculating the rate of photosynthesis.
C1.3.6: Similarities and differences of absorption and action spectra.
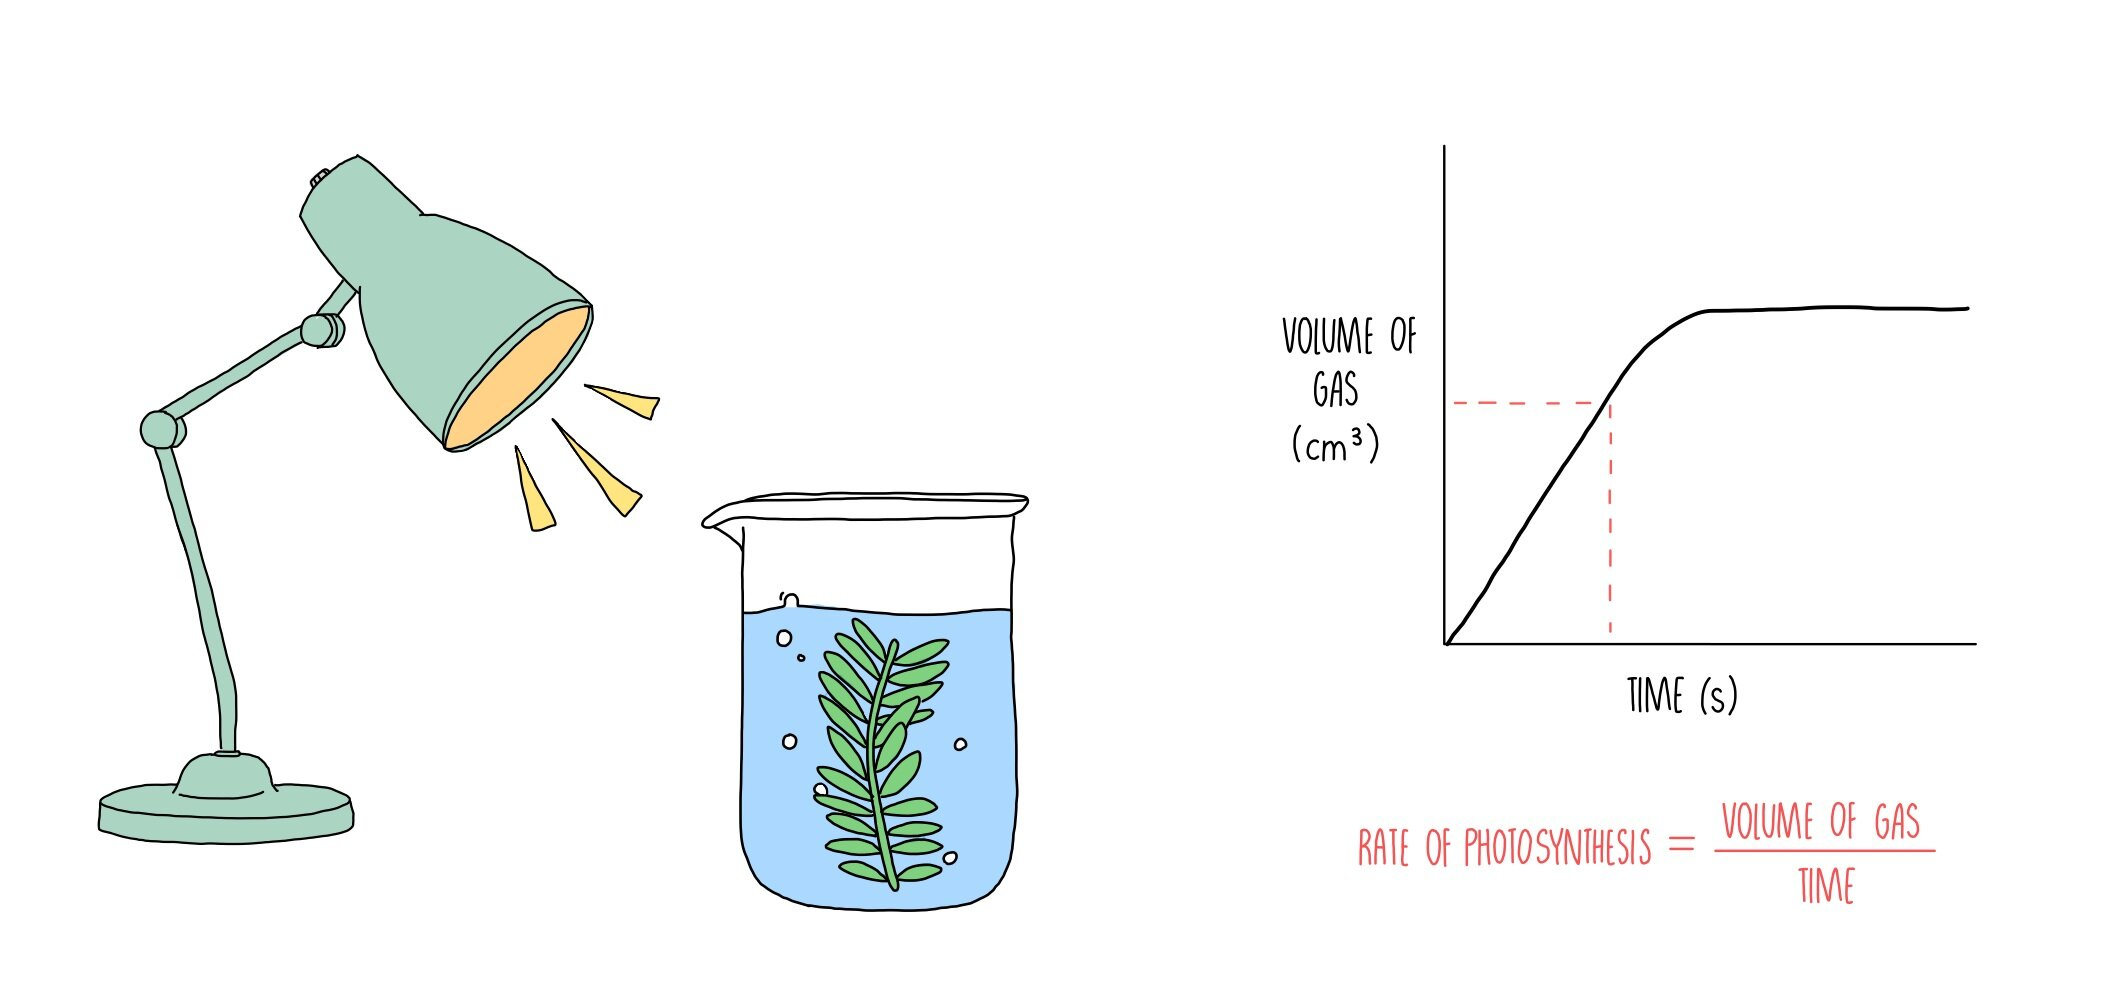
The rate of photosynthesis can be calculated by directly measuring the increase in oxygen or the decrease in carbon dioxide.
Because oxygen is produced by photosynthesis, it can indicate the rate of photosynthesis.
Because carbon dioxide is used during photosynthesis, it can also indicate the rate of photosynthesis.
Rate of reaction = (Change in reactant or product) / Time
More indirectly, the rate of photosynthesis can be calculated by indirectly measuring the increase in biomass from photosynthesis.
Define “limiting factor.”
C1.3.7: Techniques for varying concentrations of carbon dioxide, light intensity, or temperature experimentally to investigate the effects of limiting factors on the rate of photosynthesis.
Anything in short supply which prevents photosynthesis at its maximum rate.
Explain how carbon dioxide concentration limits the rate of photosynthesis.
C1.3.7: Techniques for varying concentrations of carbon dioxide, light intensity, or temperature experimentally to investigate the effects of limiting factors on the rate of photosynthesis.
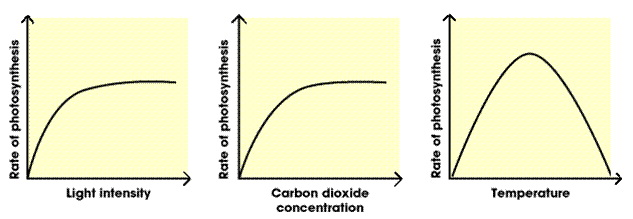
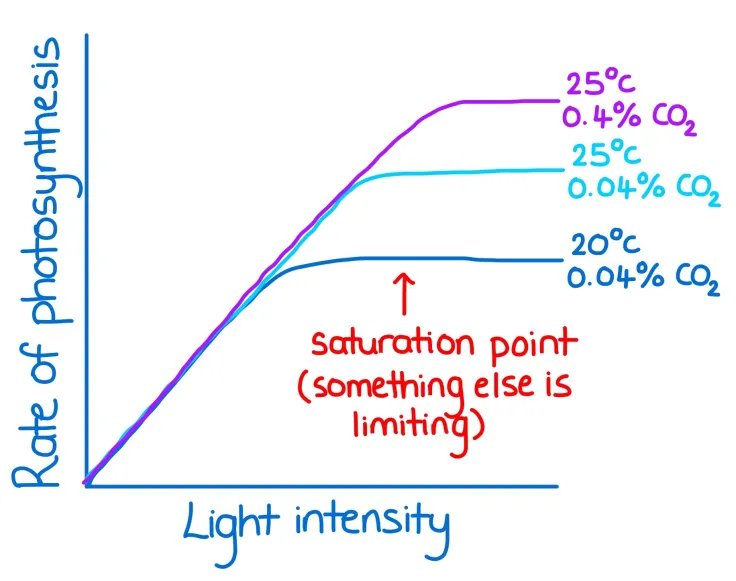
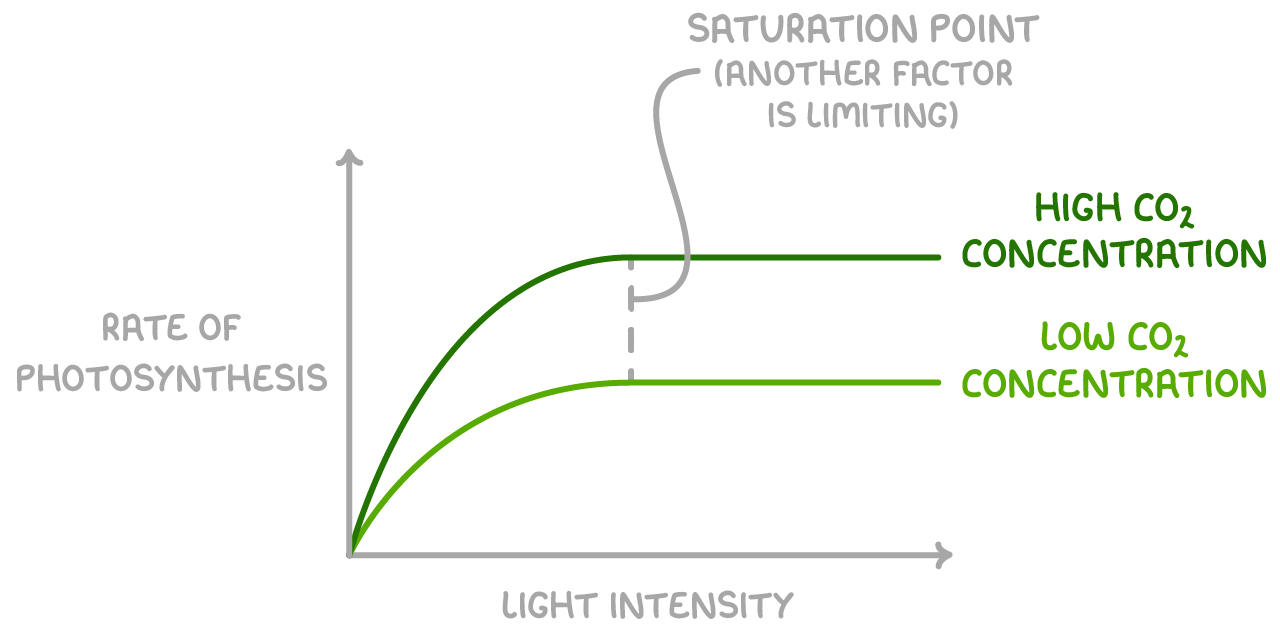
As CO2 concentration increases, more reactant becomes available, so there are more collisions with enzymes. Thus, as CO2 concentration increases, the rate of photosynthesis increases.
The rate of photosynthesis eventually plateaus when another limiting factor prevents its increase.
Outline a technique to measure the rate of photosynthesis while manipulating carbon dioxide concentration.
Identify manipulated (independent), responding (dependent), and controlled variables in experiments testing carbon dioxide concentration on the rate of photosynthesis.
C1.3.7: Techniques for varying concentrations of carbon dioxide, light intensity, or temperature experimentally to investigate the effects of limiting factors on the rate of photosynthesis.
The effect of CO2 concentration can be investigated in aquatic plants by changing the concentration of sodium hydrogen carbonate dissolved in water.
In this experiment, the independent variable is the concentration of carbon dioxide. The dependent variable is the rate of photosynthesis. The controlled variables include other limiting factors like light intensity and temperature.
Explain how light intensity limits the rate of photosynthesis.
C1.3.7: Techniques for varying concentrations of carbon dioxide, light intensity, or temperature experimentally to investigate the effects of limiting factors on the rate of photosynthesis.
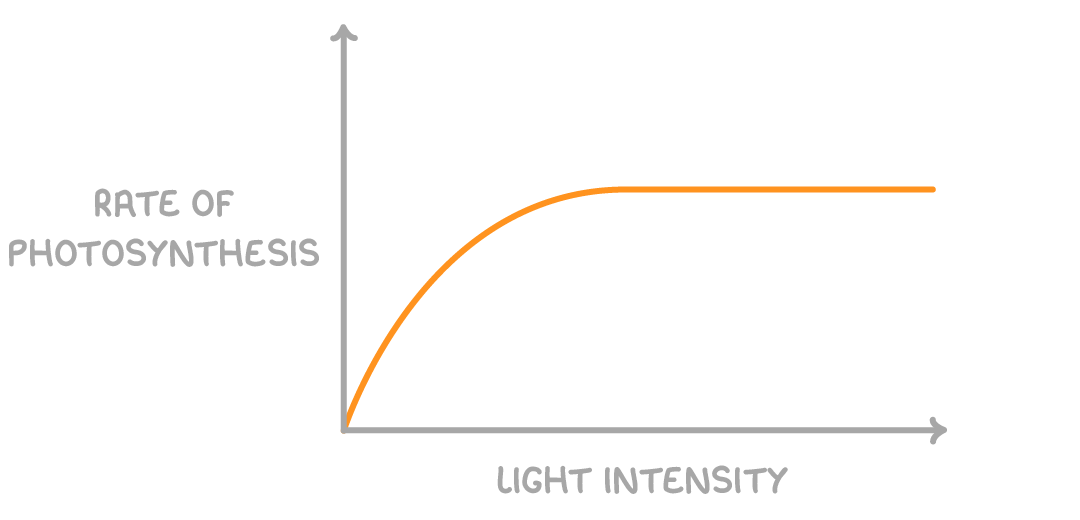
As light intensity increases, the energy available increases. Thus, as light intensity increases, the rate of photosynthesis increases.
The rate of photosynthesis eventually plateaus because of other limiting factors preventing further increase.
Outline a technique to measure the rate of photosynthesis while manipulating light intensity.
Identify manipulated (independent), responding (dependent), and controlled variables in experiments testing light intensity on the rate of photosynthesis.
C1.3.7: Techniques for varying concentrations of carbon dioxide, light intensity, or temperature experimentally to investigate the effects of limiting factors on the rate of photosynthesis.
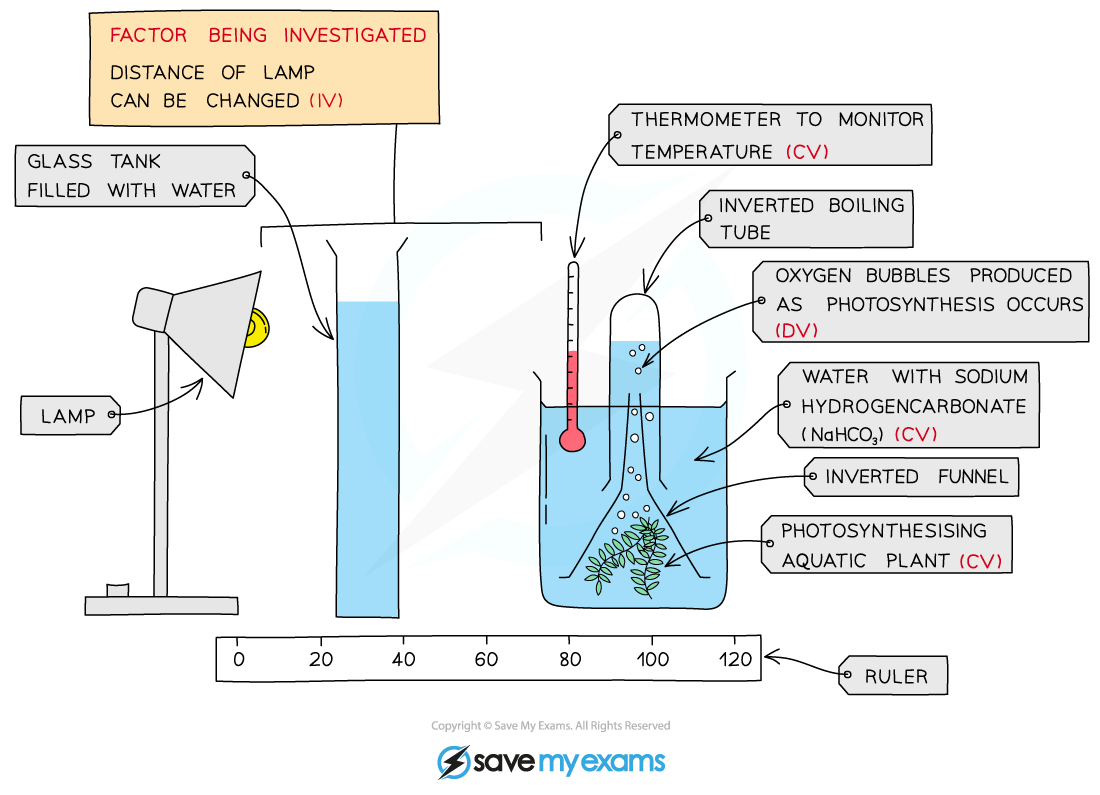
Light intensity’s effect on rate of photosynthesis can be tested by changing the distance of the light source from the photosynthesizing organism.
In this experiment, the independent variable is the light intensity. The dependent variable is the rate of photosynthesis. The controlled variables include other limiting factors such as carbon dioxide concentration and temperature.
Explain how temperature limits the rate of photosynthesis.
C1.3.7: Techniques for varying concentrations of carbon dioxide, light intensity, or temperature experimentally to investigate the effects of limiting factors on the rate of photosynthesis.
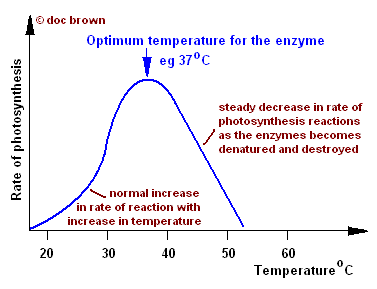
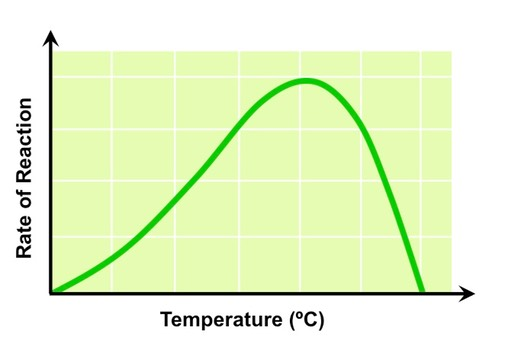
As temperature increases, faster-moving particles collide with more enzyme active sites. This increases the rate of photosynthesis.
The rate of photosynthesis reaches a max when other factors limit it.
At high temperatures, the rate of photosynthesis decreases because enzymes denature.
Outline a technique to measure the rate of photosynthesis while manipulating temperature.
Identify manipulated (independent), responding (dependent), and controlled variables in experiments testing temperature on the rate of photosynthesis.
C1.3.7: Techniques for varying concentrations of carbon dioxide, light intensity, or temperature experimentally to investigate the effects of limiting factors on the rate of photosynthesis.
Temperature can be investigated by changing the temperature of water surrounding an aquatic plant. It could also be investigated by changing the distance of a heat source from a photosynthesizing organism.
The independent variable in such an experiment is the temperature. The dependent variable is the rate of photosynthesis. The controlled variables include other limiting factors such as light intensity and carbon dioxide concentration.
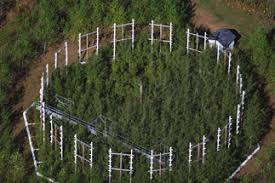
Compare enclosed greenhouse and free-air carbon dioxide enrichment (FACE) experiments.
C1.3.8: Carbon dioxide enrichment experiments as a means of predicting future rates of photosynthesis and plant growth.
In both enclosed greenhouses and FACE Experiments, carbon dioxide concentration’s effect on plants is tested.
Enclosed greenhouses experiments control all factors, and the plants are not in their natural environment. On the other hand, FACE experiments are field experiments, so they are carried out in the plants’ natural environment.
Outline benefits of large-scale experiments.
C1.3.8: Carbon dioxide enrichment experiments as a means of predicting future rates of photosynthesis and plant growth.
Scientists can test how carbon dioxide affects photosynthesis and plant growth in small, easy-to-control laboratory experiments. However, large-scale experiments are valuable because it shows the effect of increasing atmospheric carbon dioxide levels (even though they are harder to control). Some experiments can only be done in the field.
Suggest variables that scientists would want to control in enclosed greenhouse experiments.
C1.3.8: Carbon dioxide enrichment experiments as a means of predicting future rates of photosynthesis and plant growth.
Carbon dioxide concentrations
Water concentration
Humidity
Temperature
pH
Soil composition
Light concentration
Describe the location and arrangement of pigments into photosystems.
C1.3.9: Photosystems as arrays of pigment molecules that can generate and emit excited electrons.
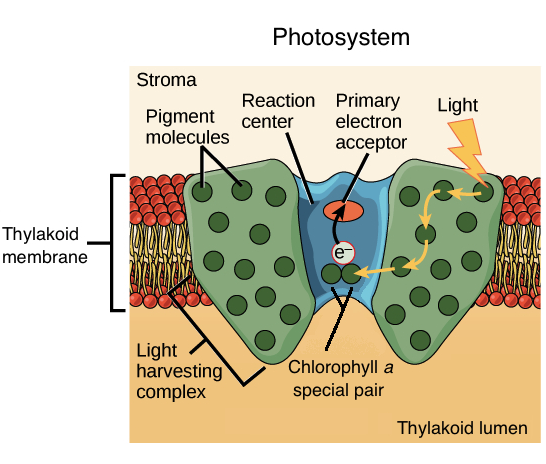
Photosystems are groups of pigment molecules consisting of chlorophyll and accessory pigments. The chlorophyll molecule is the reaction center (where an excited electron is emitted).
Photosystems are in the membranes of cyanobacteria and the chloroplasts of photosynthetic eukaryotes.
State the function of the reaction center pigment in a photosystem.
C1.3.9: Photosystems as arrays of pigment molecules that can generate and emit excited electrons.
The reaction center pigment releases an excited electron after absorbing light energy.
Outline how light energy is used in photosystems.
C1.3.9: Photosystems as arrays of pigment molecules that can generate and emit excited electrons.
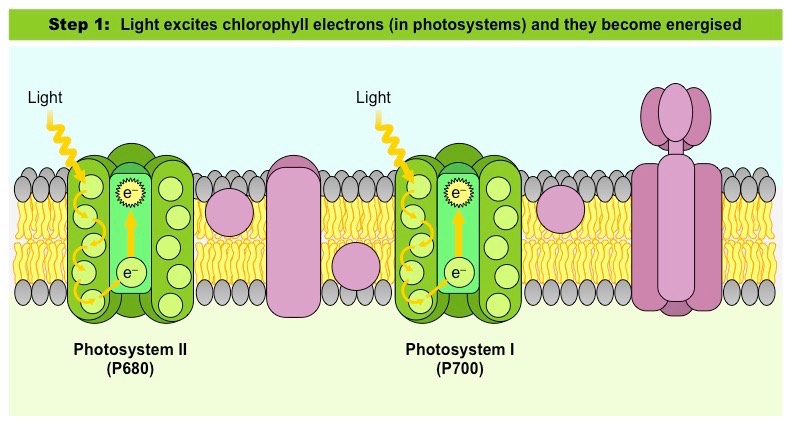
When light energy activates the Photosystems, energy travels to the reaction center, where an excited electron is released. Then these excited electrons move along an electron transport chain to provide energy for chemiosmosis.

Compare the peak absorbance of the reaction center chlorophyll molecules of photosystem I and photosystem II.
C1.3.10: Advantages of the structured array of different types of pigment molecules in a photosystem.
Photosystem I (PS I or P700) generally absorbs longer wavelengths (like 700 nm).
Photosystem II (PS II or P680) generally absorbs shorter wavelengths (680 nm).
Describe the role of photosystem II in photolysis.
C1.3.11 (AHL): Generation of oxygen by the photolysis of water in photosystem II.
The photolysis of water (H2O) takes place at photosystem II. Water is split into electrons, H+ ions (protons), and Oxygen.
Water is split by light, and the electrons are used by PS II to be energized and transported down the electron transport chain. The protons build up to create an electrochemical gradient. The oxygen is given off as a waste product.
Outline the movement of electrons generated by photolysis of water at photosystem II.
C1.3.11 (AHL): Generation of oxygen by the photolysis of water in photosystem II.
After the photolysis of water, the electron is energized by the light energy the pigments in PS II absorb. Then the excited electron is emitted. It travels down the rest of the electron transport chain in the thylakoid membrane, losing energy as it goes through the b6-f cytochrome complex (which actively transports H+ from the stroma into the thylakoid) until it reaches PS I.
State how the photolysis of water at photosystem II contributes to the proton gradient.
C1.3.11 (AHL): Generation of oxygen by the photolysis of water in photosystem II.
In the photolysis of water, the hydrogens are split into e- and H+ (protons). Thus, there are many free H+ ions in the thylakoid lumen. As photolysis continues, a proton gradient is developed in the thylakoid.
Outline the role of photosynthesis in the “Great Oxygenation Event” on early Earth.
C1.3.11 (AHL): Generation of oxygen by the photolysis of water in photosystem II.
Photosynthesis in early organisms led to the appearance of oxygen in our atmosphere. This is also known as “The Great Oxygenation Event.”
Outline the effects of the advent of oxygen generation by photolysis on living organisms and geological processes on Earth.
C1.3.11 (AHL): Generation of oxygen by the photolysis of water in photosystem II.
The Great Oxygenation Effect coincided with a greater number of minerals being formed. There was greater water evaporation from Earth’s surface, which led to greater moisture. An ozone layer developed as well.
For living organisms, obligate anaerobes were poisoned by the free oxygen, so many anaerobic bacteria went extinct. At the same time, it also led to the evolution of aerobically respiring organisms.
Sketch a cross section of the thylakoid membrane, including photosystem II, ATP synthase, the electron transport chain, and photosystem I.
C1.3.12 (AHL): ATP production by chemiosmosis in thylakoids.
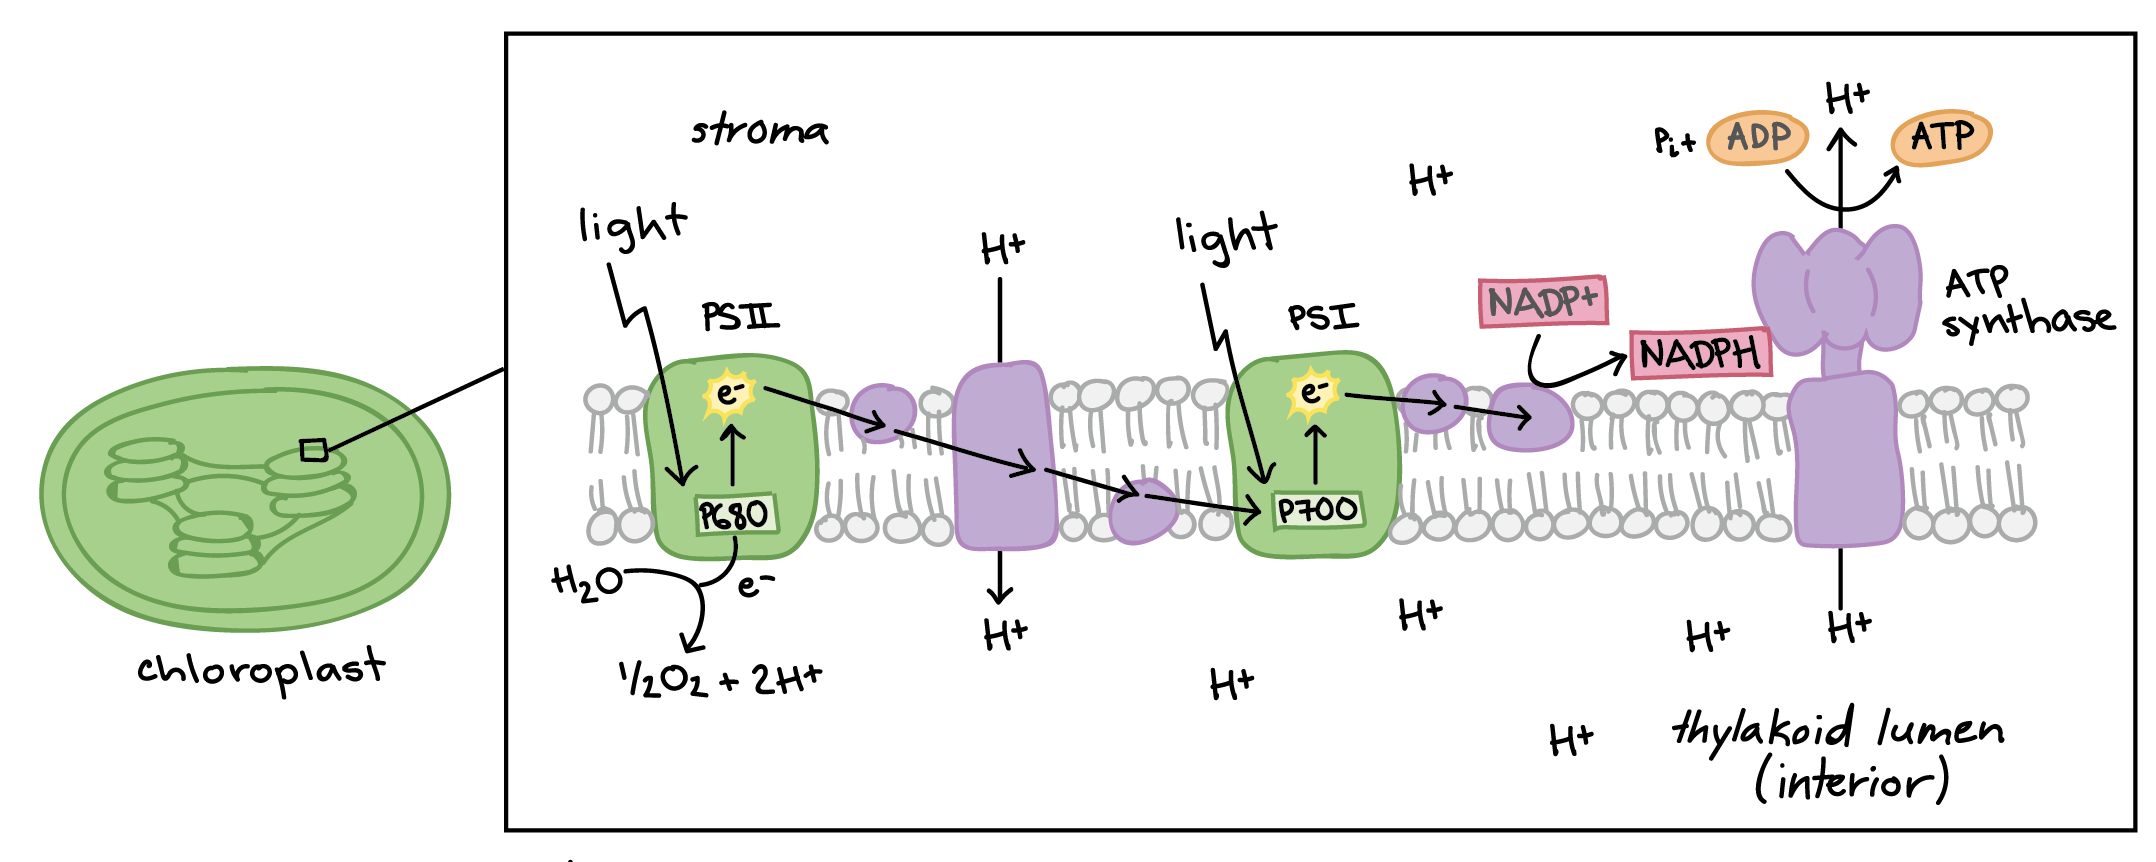
Define chemiosmosis.
C1.3.12 (AHL): ATP production by chemiosmosis in thylakoids.
The movement of ions down their electrochemical gradient.
Define photophosphorylation.
C1.3.12 (AHL): ATP production by chemiosmosis in thylakoids.
The synthesis of ATP from ADP and Pi in photosynthesis using light energy.
Explain how ATP is produced by chemiosmosis in the thylakoids.
C1.3.12 (AHL): ATP production by chemiosmosis in thylakoids.
First, PS II absorbs light energy, and the electrons within the pigments become excited (from photolysis).
These excited electrons are transferred to the electron transport chain within the thylakoid.
As they pass through the ETC, they lose energy at the b6-f cytochrome complex which actively pumps H+ from the stroma into the thylakoid space, which increases the H+ concentration.
The electrochemical gradient develops due to the buildup of H+ within the thylakoid.
As protons return to the stroma along the proton gradient through ATP synthase (chemiosmosis), it catalyzes ATP synthesis from ADP and Pi (photophosphorylation).
Compare respiration chemiosmosis to photosynthesis chemiosmosis.
C1.3.12 (AHL): ATP production by chemiosmosis in thylakoids.
Respiration Chemiosmosis | Photosynthesis Chemiosmosis |
Electron transport chain embedded in the membranes of the mitochondria’s cristae | Electron transport chain embedded in the thylakoids’ membranes |
Electrons exchanged from one carrier to another → Energy released | Electrons exchanged from one carrier to another → Energy released |
Released energy is used to actively transport H+ (hydrogen ions) into the intermembrane space → creates a proton gradient | Released energy is used to actively transport H+ (hydrogen ions) into the thylakoid space → creates a proton gradient |
Hydrogen ions come from the matrix | Hydrogen ions come from the stroma |
Hydrogen ions diffuse back into matrix through ATP synthase channels | Hydrogen ions diffuse back into stroma through ATP synthase channels |
ATP synthase catalyzes phosphorylation of ADP to ATP | ATP synthase catalyzes photophosphorylation of ADP to ATP |
Compare the flow of electrons in cyclic vs non-cyclic photophosphorylation.
C1.3.12 (AHL): ATP production by chemiosmosis in thylakoids.
Non-Cyclic Photophosphorylation | Cyclic Photophosphorylation | |
Photosystems Involved | Both PS I and PS II | PS I only |
Products | ATP and NADPH | Only ATP |
When it occurs | Whenever | When light is not a limiting factor & when there is an accumulation of reduced NADP in the chloroplast |
What it requires | Oxidation of water to provide more electrons | |
Flow of electrons | Electron from PS II goes to PS I, where the electron reduces NADP to NADPH | Energized electron from PS I (without NADP to reduce) returns to cytochrome complex to pump more H+, and the electron returns to PS I |
Outline the flow and function of electrons in non-cyclic photophosphorylation.
C1.3.12 (AHL): ATP production by chemiosmosis in thylakoids.
In non-cyclic photophosphorylation, electrons from H2O start from photosystem II. Once excited, the electrons move through the ETC until it reaches PS I. There, its energy is used to reduce NADP+ to NADPH.
It produces both ATP and NADPH.
The lost electrons are replaced by electrons from PS II (which is from the photolysis of water).
It is non-cyclical because it requires water for electrons — the electron does not return to the same photosystem.
Outline the flow and function of electrons in cyclic photophosphorylation.
C1.3.12 (AHL): ATP production by chemiosmosis in thylakoids.
In cyclic photophosphorylation, the light-energized electrons from PS I do not have a NADP+ to reduce (because there may be enough NADPH already). As a result, it returns to the cytochrome complex of the ETC (between PS I and PS II). Its energy goes towards pumping more H+ from the stroma. No NADPH is produce, only ATP.
IT is cyclical because the electrons return to the same photosystem.
State the reactants and products of the light-dependent reactions.
C1.3.12 (AHL): ATP production by chemiosmosis in thylakoids.
Reactants: H2O + NADP + ADP
Products: O2 + NADPH + ATP
Describe how NADP is reduced.
C1.3.12 (AHL): ATP production by chemiosmosis in thylakoids.
NADP is reduced when it accepts 2 energized electrons from PS I. It also accepts a hydrogen ion from the stroma.
NADP becomes reduced NADP (or NADP+ becomes NADPH).
State the processes involved in the light-dependent reactions of photosynthesis.
C1.3.13 (AHL): Thylakoids as systems for performing the light-dependent reactions for photosynthesis.
Photolysis of water, synthesis of ATP by chemiosmosis, reduction of NADP
State the location of the light-dependent reactions of photosynthesis.
C1.3.13 (AHL): Thylakoids as systems for performing the light-dependent reactions for photosynthesis.
The light-dependent reactions of photosynthesis take place in the thylakoid membranes.
The thylakoids are specialized membrane disks where the light dependent reactions occur. The discs are organized into grana within the chloroplasts (but they are free-floating in cyanobacteria and single-celled algae.
State the purpose of the products of the light-dependent reactions of photosynthesis.
C1.3.13 (AHL): Thylakoids as systems for performing the light-dependent reactions for photosynthesis.
The products of the light-dependent reactions (ATP and NADPH) are used as reactants for the light independent reactions (in the Calvin cycle).
Oxygen is given off as a waste product.