Module 2: 2-2: Displaying and Summarizing Data pt. 2
1/8
There's no tags or description
Looks like no tags are added yet.
Name | Mastery | Learn | Test | Matching | Spaced | Call with Kai |
|---|
No analytics yet
Send a link to your students to track their progress
9 Terms
interquartile range
range of the middle half of data; based on 4 quartiles
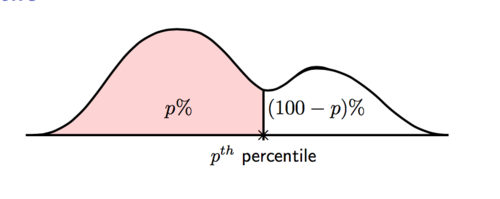
p^th percentile
value where p% falls below p^th percentile and (100-p)% fall above it
median is 50th percentile
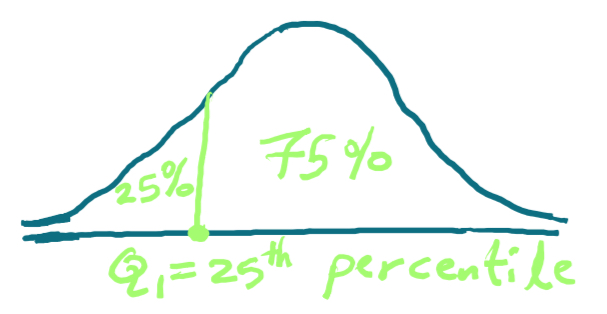
lower quartile(Q1)
25th percentile:
separates bottom 25% measurements from the top 75%
median of measurements that fall below overall median
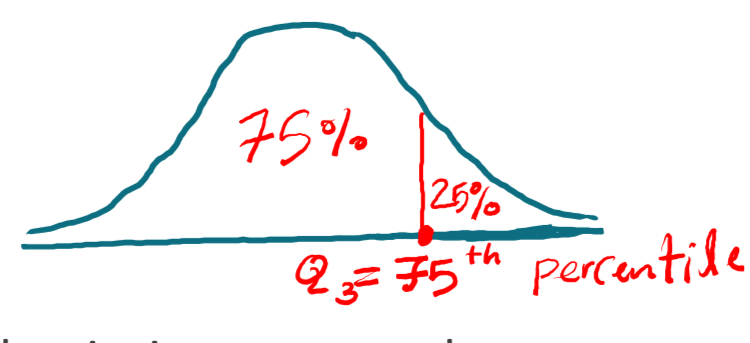
upper quartile(Q3)
75th percentile:
separates top of 25% from the bottom 75%
median of measurements that fall above overall median
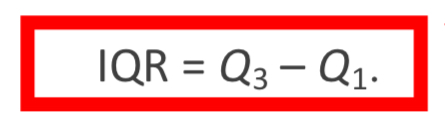
IQR Formula
is not affected by the outlier
small: clustered around center
large: scattered from center
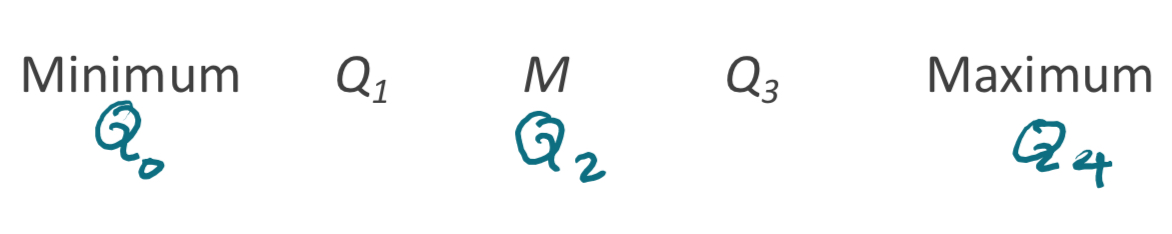
five number summary
set of measurements:
minimum
Q1
median(M)
Q3
maximum
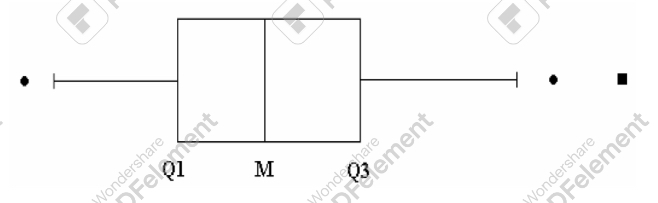
Boxplot
shows the center, spread, and symmetry/skewness at the same time; useful for comparing groups
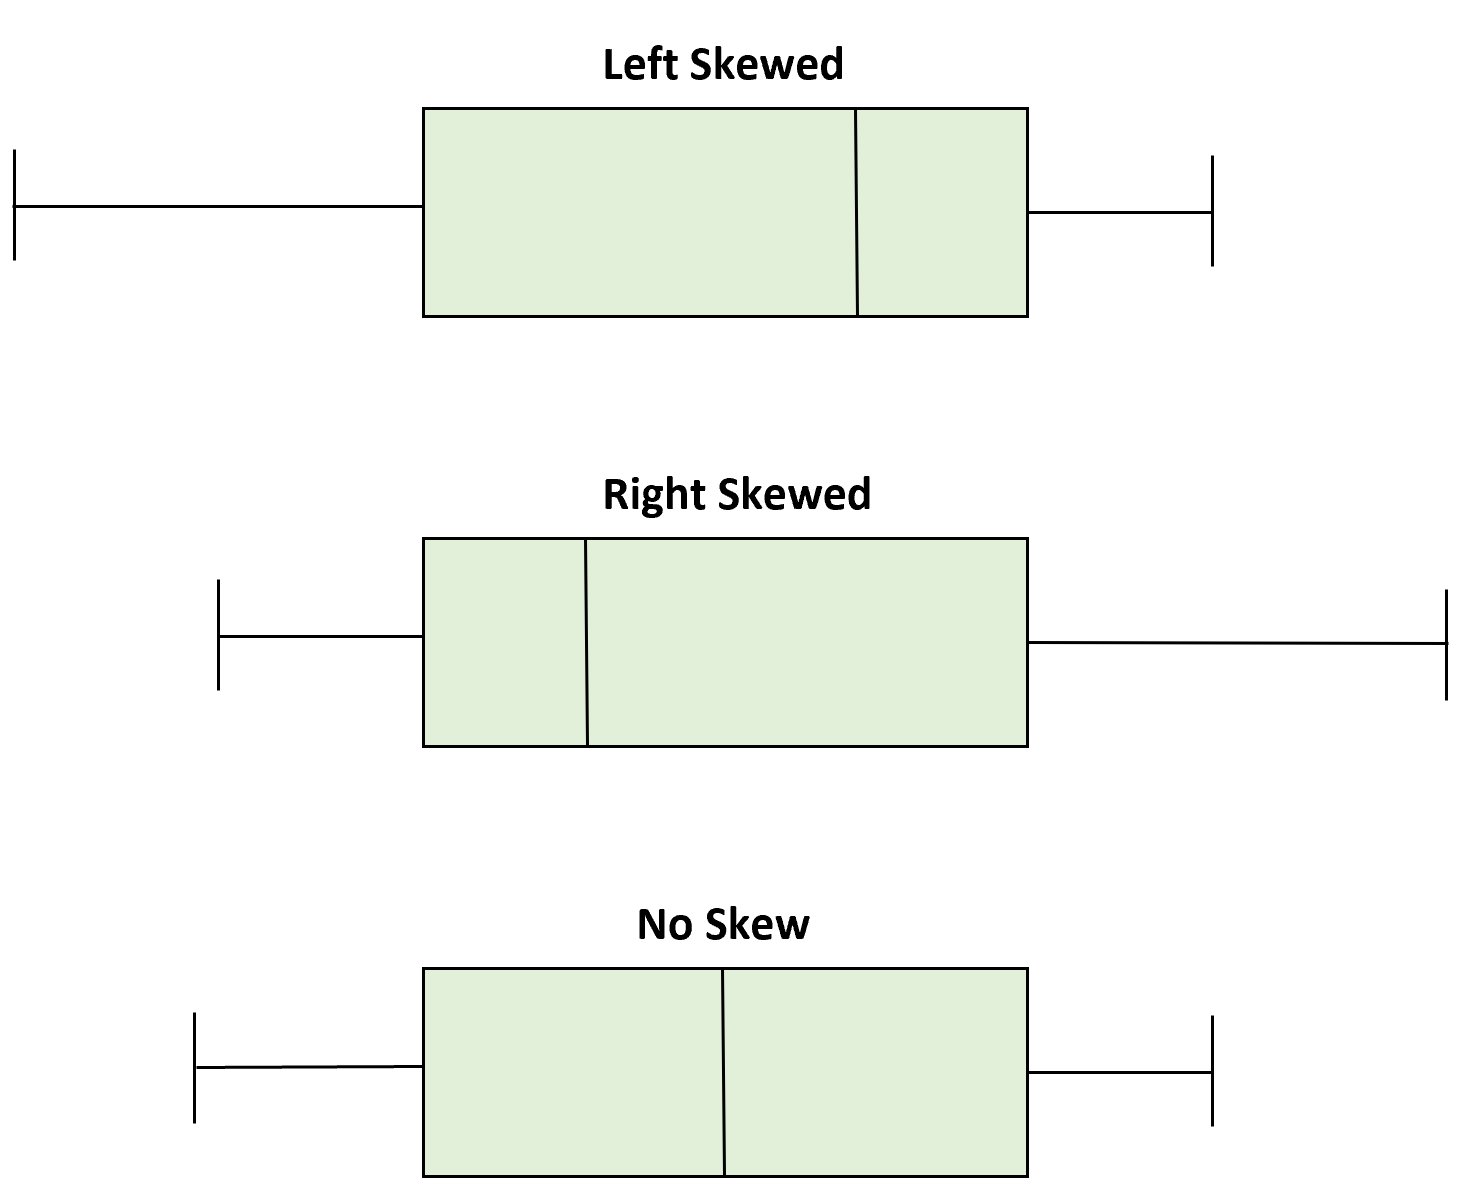
boxplot properties
symmetric distribution: median line in center of box and whiskers of equal length
skewed right: median line left of center and long right whisker
skewed left: median line right of center and long left whisker
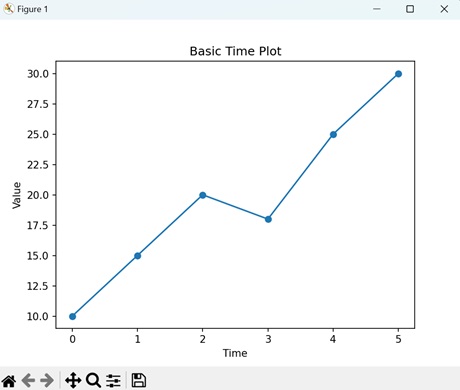
time plot
plots each observation against the time at which it was measured