AP ENV - Chapter 3
1/43
Earn XP
Name | Mastery | Learn | Test | Matching | Spaced | Call with Kai | Chat |
|---|
No analytics yet
Send a link to your students to track their progress
44 Terms
r-strategists
have high reproductive rates and thrive in unstable environments
k-strategists
have lower reproductive rates and thrive in stable environments
R strategies
not endangered
have many offspring and tend to overproduce
low parental care
mature rapidly
short lived
tend to be prey
tend to be small
examples: insects, bacteria, rodents
K strategies
most endangered
have few offpsring
high parental care
mature slowly
tend to be large
examples: humans, elephants, sharks
survivorship curves
shows age distribution characteristics of species, reproductive strategies and life history
Type 1: Late loss
characterized by high survival rates during early and middle life, with a significant drop in survival in older age groups. (ex. humans and large mammals)
Type 2: Constant loss
death rate is constant from birth to death and predation is the primary cause of death (ex. rodents and perennial plants)
Type 3: Early loss
have great numbers of offspring and reproduce for most of their life (ex. sea turtles, trees, fish)
carrying capacity (K)
refers to the number of individuals that can be supported sustainably in a given area without degrading the environment or depleting resources.
regulating factors
amount of sunlight available
food availability
nutrient leveles in soil profiles
oxygen content in aquatic ecosystems
space
population dispersal pattern
how individuals or species become distributed in different spaces over certain periods of time
clumped pattern
a population dispersal pattern dense with organisms, while other areas contain few members
clumped pattern examples
Animals living in social families.
Animals that feel safer living in groups
Animals that serve as prey
Animals that work together to trap or corner prey.
Animals with inability of their offspring to independently move from their habitat.
random pattern
occurs in habitats where environmental conditions and resources are consistent, with little interaction among members
uniform pattern
space is maximized between individuals to minimize competition
biotic potential
the maximum reproductive capacity of an organism under optimum conditions
factors that increase biotic potential
able to adapt and migrate
resistance to disease
favorable env conditions
high birth rate
few competitors
factors that decrease biotic potential
unable to adapt or migrate
little defense against diseases
too many competitors
inadequate food supply
j-curve
represents rapid population growth in a new environment, increasing exponentially until environmental resistance abruptly curbs it
s-curve
occurs when the population density of an organism initially increases but then stabilizes due to the finite amount of resources available
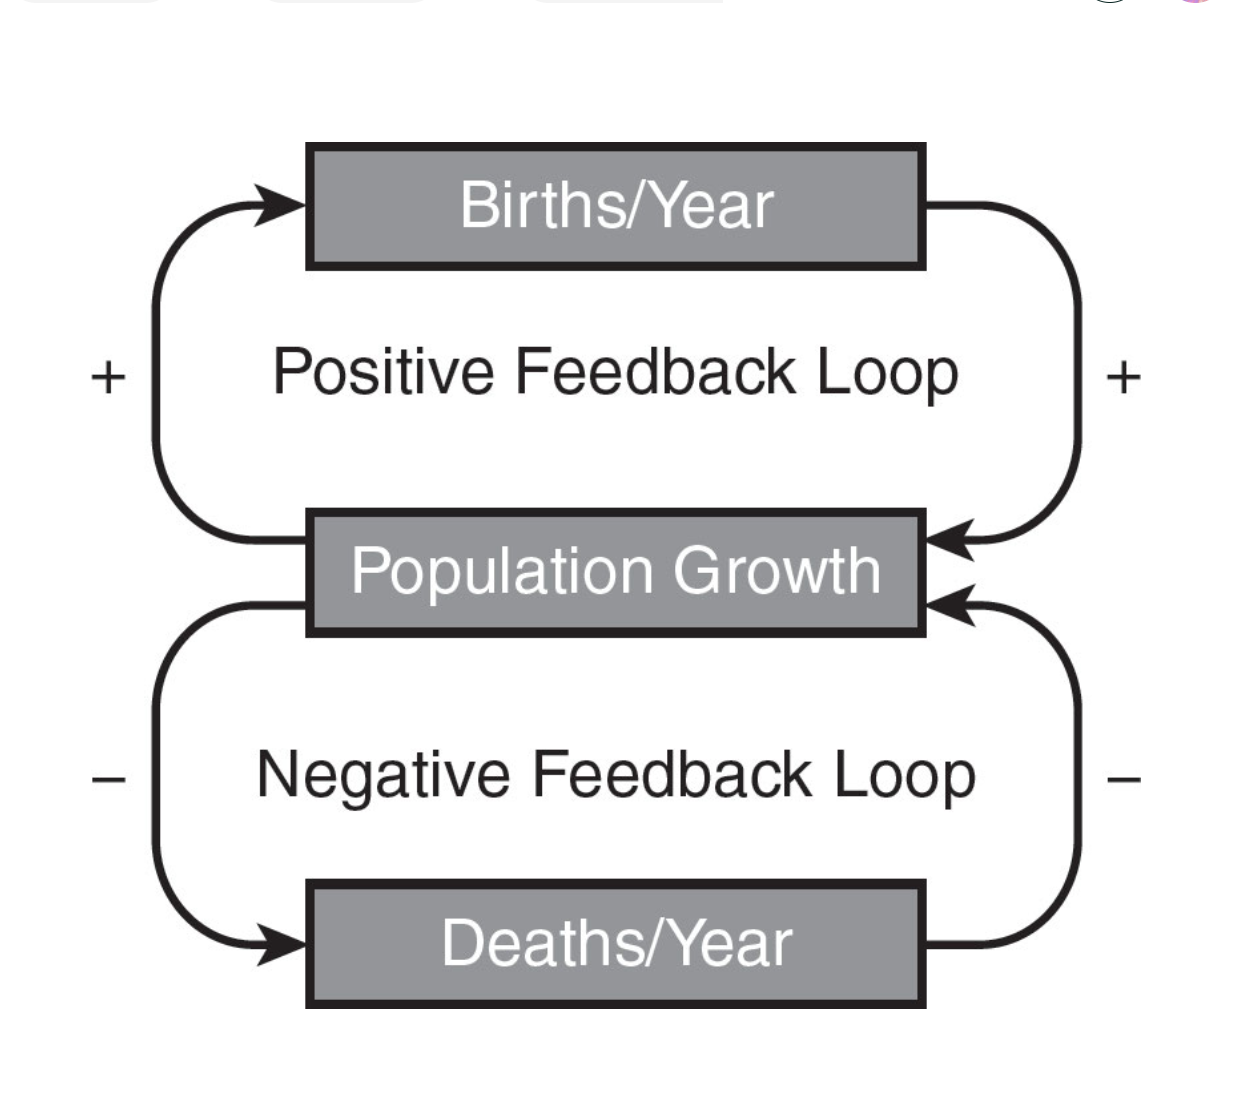
positive feedback loops
stimulate change and are responsible for sudden or rapid changes within ecosystems
negative feedback loops
provide stability in ecosystems by preventing populations from exceeding carrying capacity, regulated by predator-prey dynamics
feedback loops
limiting factors
environmental conditions that restrict population growth and distribution
rule of 70
helps to explain the time periods involved in exponential population growth
doubling time
the amount of time it takes for a population to double in size
doubling time formula
dt = 70/r
important population formulas
Birth Rate (%) = [(total births/total population)] × 100
Crude Birth Rate (CBR) = [(b ÷ p) × 1,000]
Death Rate (%) = [(total deaths/total population)]× 100
Crude Death Rate (CDR) = [(d ÷ p) × 1,000]
Doubling Time = 70/% growth rate
Emigration = number leaving a population
Global Population Growth Rate (%) = [(CBR – CDR)]/10
Immigration = number entering a population
National Population Growth Rate (%) = [(CBR + immigration) – (CDR + emigration)]/10
Percent Rate of Change = [(new # - old #)/old #] × 100
Population Density = total population size/total area
impacts of population growth
biodiversity declines, oceans are overexploited, forests are lost, freshwater decreases, etc.
age-structure diagrams
determined by birth rate, generation time, death rate and sex ratios
pyramid shaped age structure diagram
high birth rates and the majority of the population is in the reproductive age group
bell shape age-structure diagram
pre=reproductive and reproductive age groups are more nearly equal
urn shaped age structure diagram
post reproductive group is largest and the pre reproductive group is smallest, a result of the birth rate’s falling below the death rate
total fertility rate
the average number of children that each woman will have during her lifetime
pre earth wisdom
natural cycles that can serve as a model for human behavior
frontier worldview
viewed undeveloped land as a hostile wilderness to be cleared and planted
planetary management
beliefs that as the planet’s most important species, we are in charge of the earth
current earth wisdom
beliefs that nature exists for all earth’s species and we are not in charge of earth, resources are limited and should not be wasted
demographic transition
a model that describes the stages a country goes through as it transitions from high birth and death rates to low birth and death rates.
stage 1: pre industrial
high birth and death rates, little population growth, often due to subsistence agriculture and limited medical care
stage 2: transitional
occurs after the start of industrialization, population rises rapidly
stage 3: industrial
birth rates begin to decline, death rates stabilize, leading to slower population growth as families have fewer children.
stage 4: post industrial
low birth and death rates, leading to a stable or declining population
stage 5: sub replacement fertility
death rates exceed birth rates, resulting in a declining population over time.