Unit 1 Chapter 2 APHG
1/27
There's no tags or description
Looks like no tags are added yet.
Name | Mastery | Learn | Test | Matching | Spaced | Call with Kai |
|---|

28 Terms
Geography Inquiry process
A systematic approach to gathering and analyzing geographic data.
Quantitative data
Data based on numbers.
Qualitative data
Interpretation from other data, using observations.
Census
Official court population check in America every 10 years.
Geographic Information System (GIS)
Allows collection, organization, and display of geographic data.
Topography
Representing Earth's surface showing natural and human-made features.
Remote sensing
Any way of gathering geographical data without physically being there.
Global Positioning System (GPS)
A system using various amounts of satellites to find the location of a receiver which is usually a phone.
Cartographer
A person who creates maps.
Absolute distance
Distance that can be measured using a standard unit of length.
Relative direction
Directions based on a person's perception, such as left, right, up, or down.
Relative distance
Distance in relation to other places or objects.
Map scale
Mathematical relationship between the part of the real world and the map.
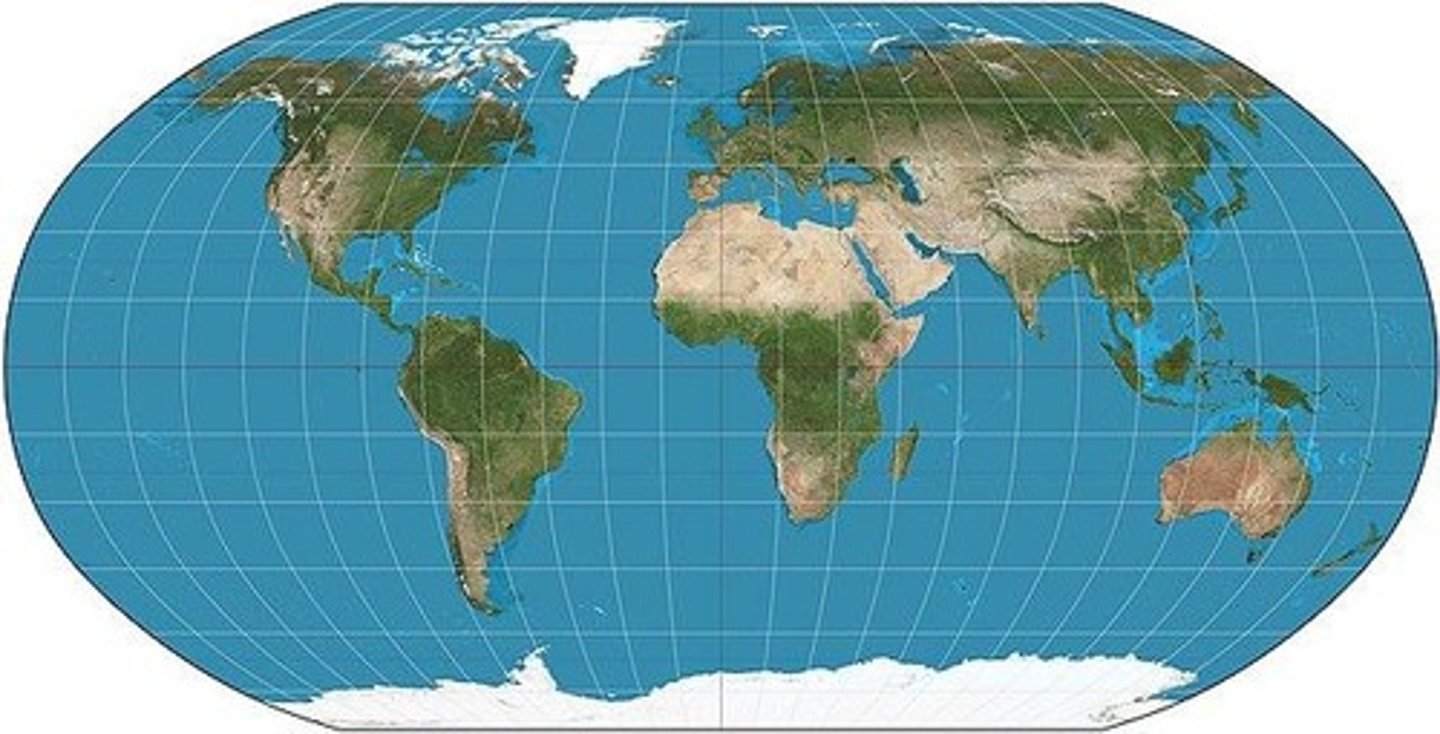
Robinson projection
More globe-like, accurate near poles, distorts area, shape, and size.
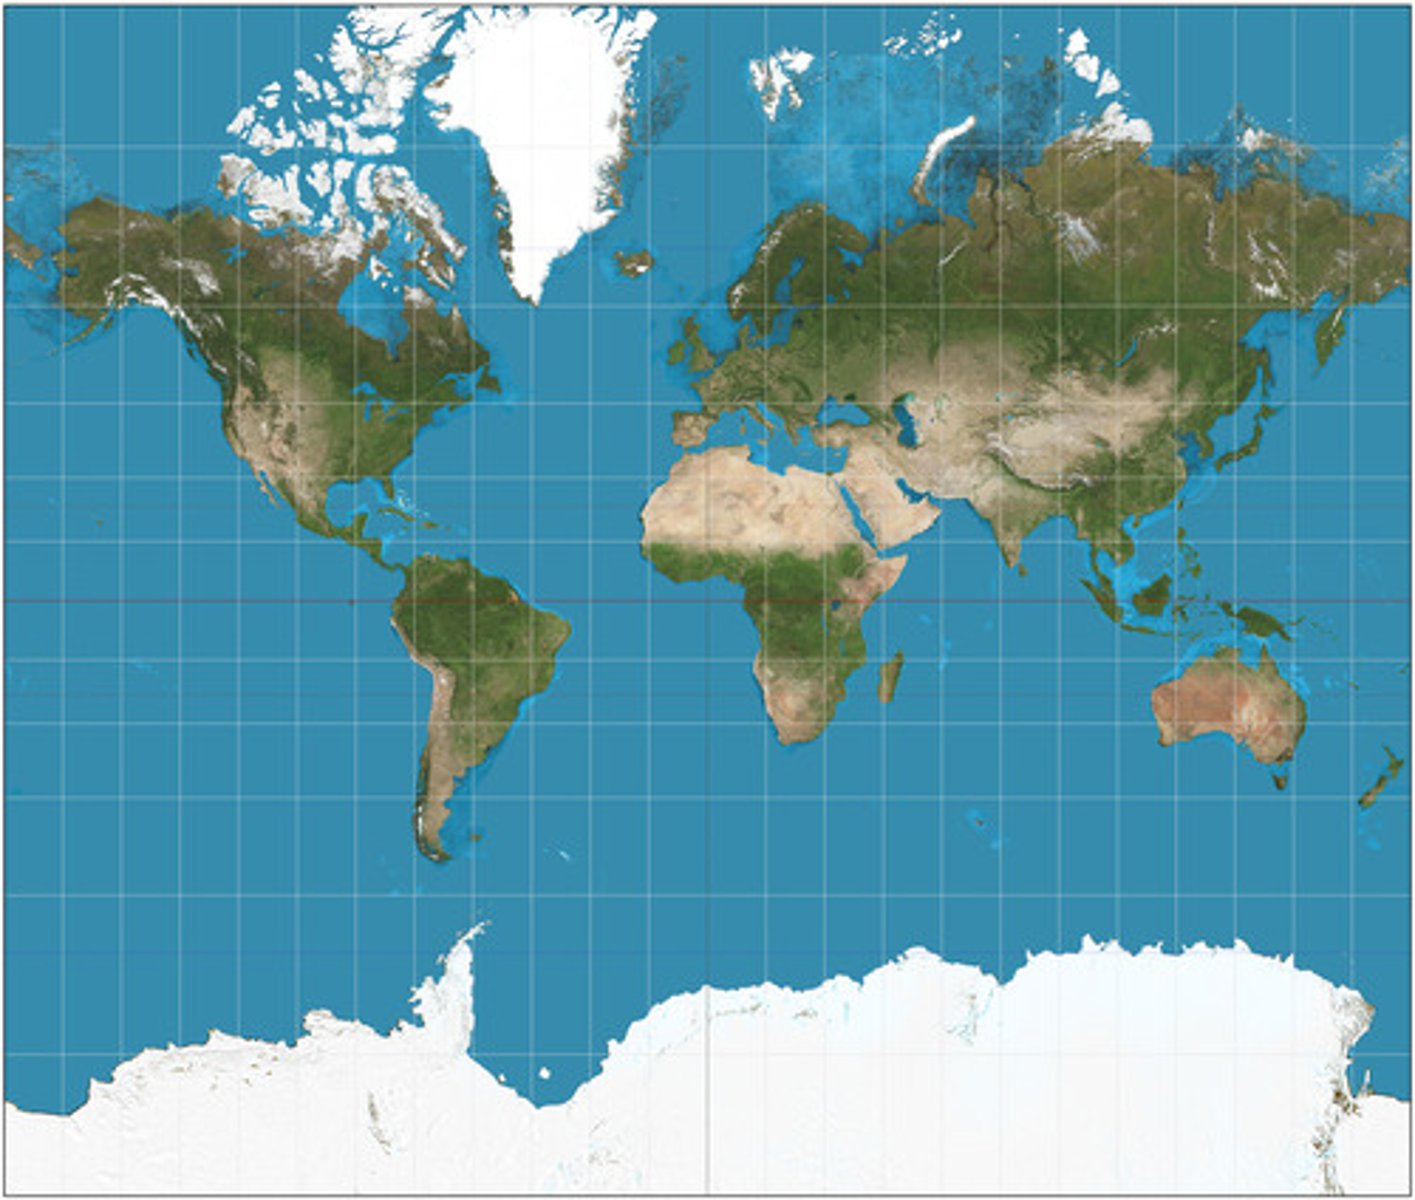
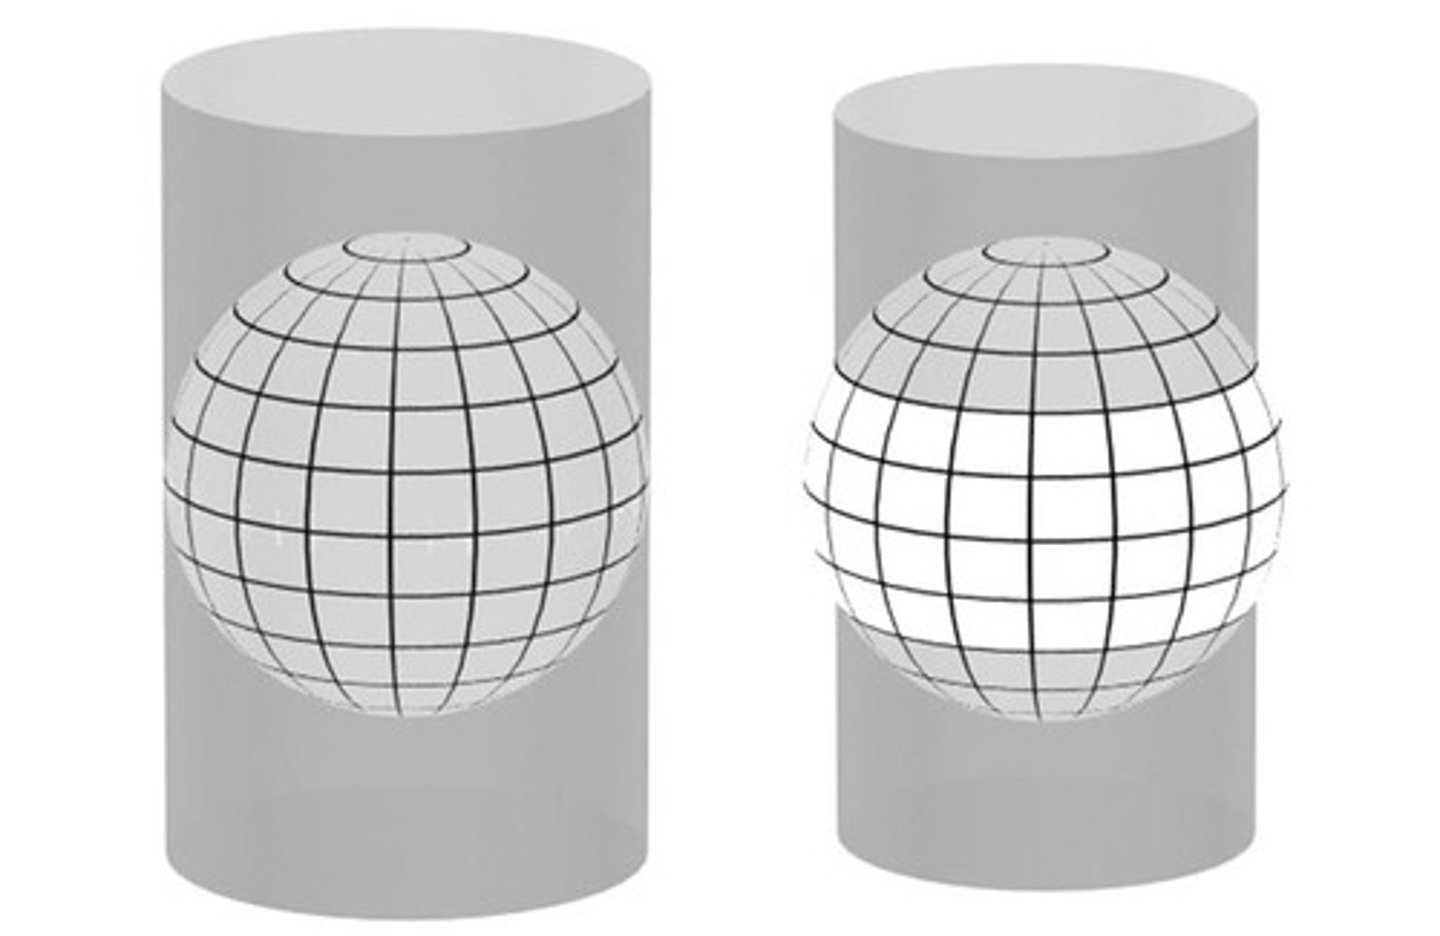
Mercator projection
Farther from the equator more distortion, sizes in the arctics are distorted.
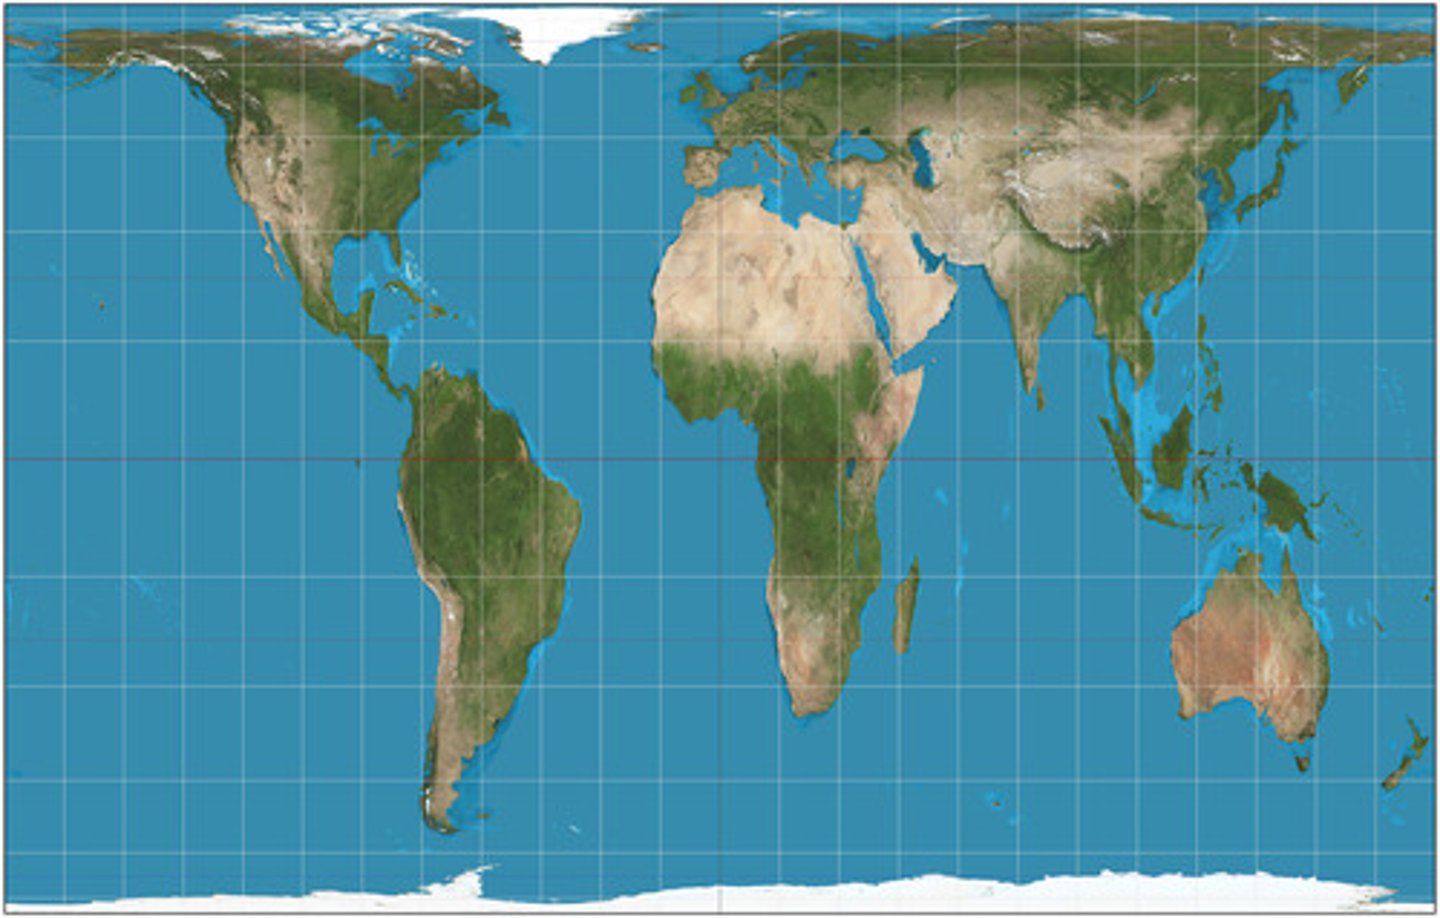
Gall-peters projection
Poles flat, land area accuracy, accurate sizes, inaccurate shapes.
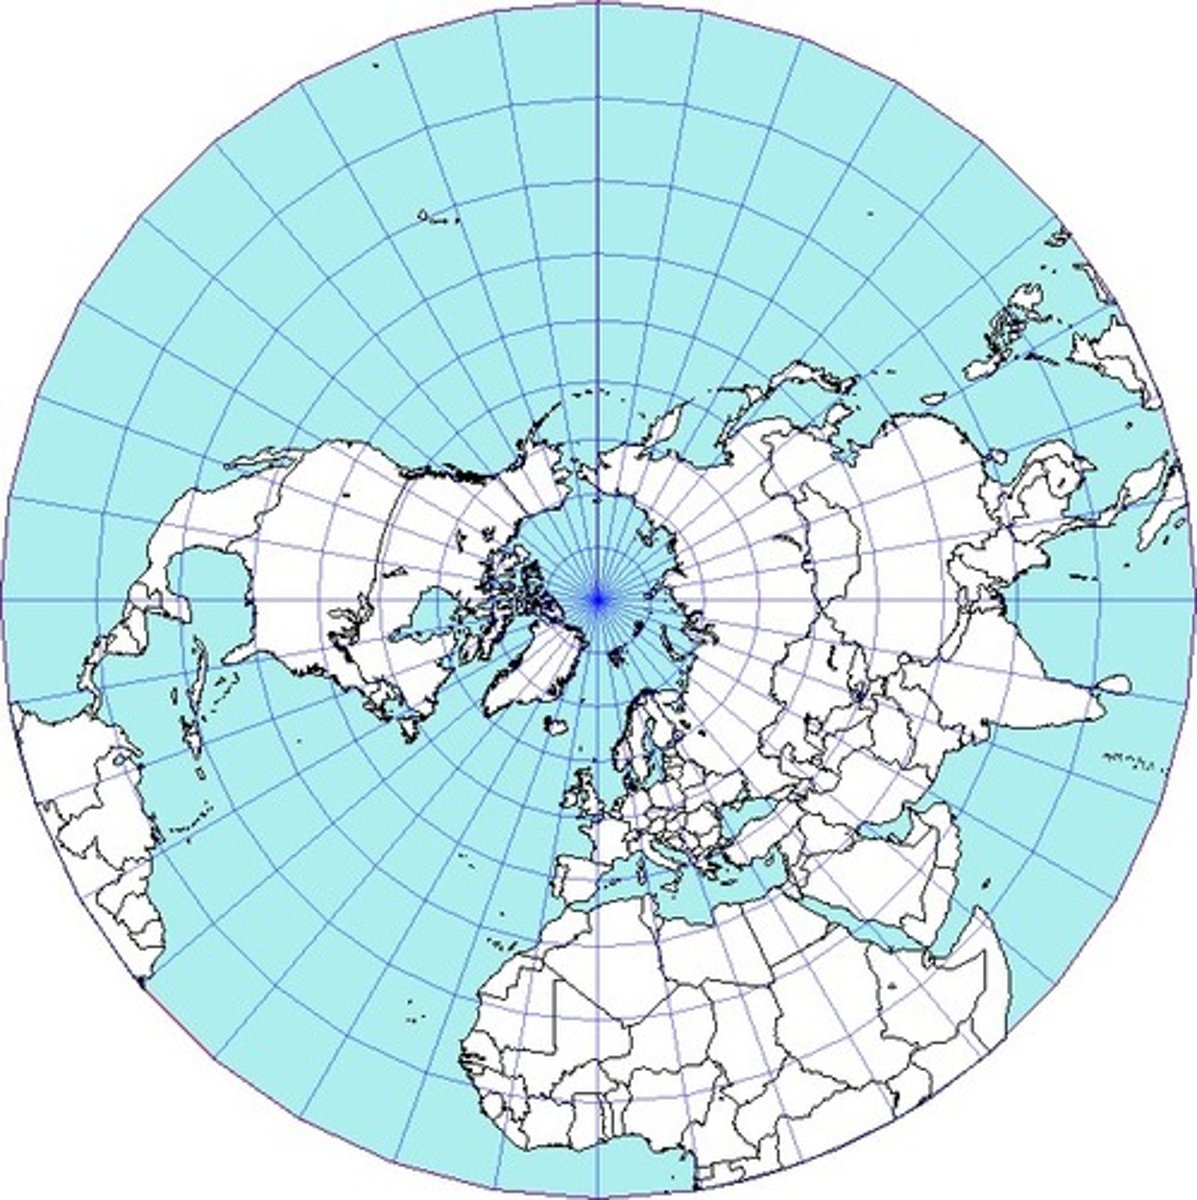
Azimuthal projection
Shape, scale, and area are all distorted.
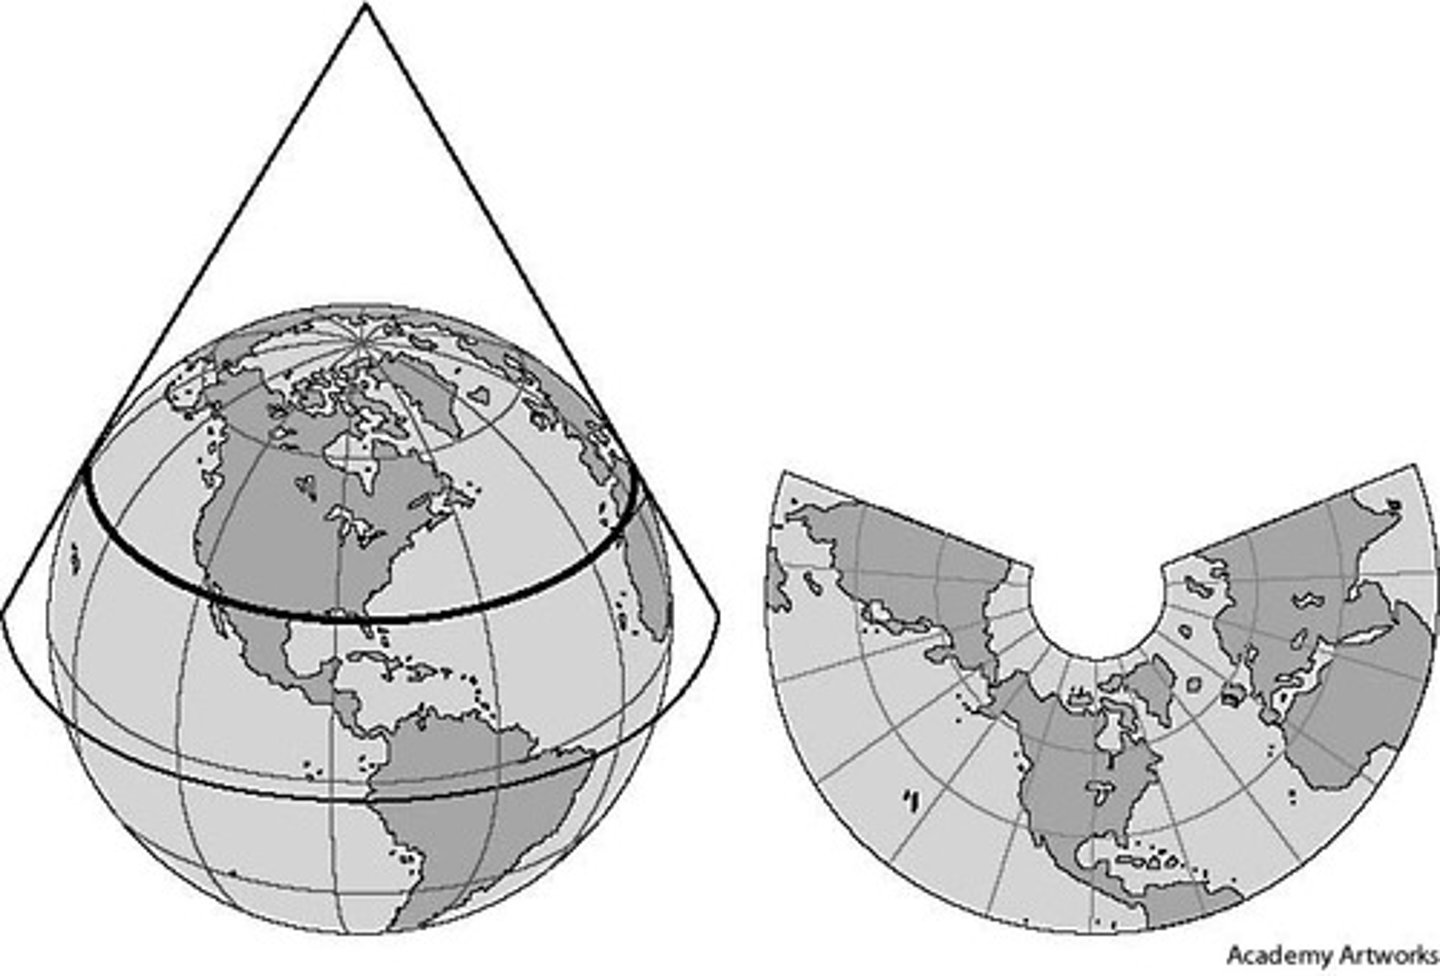
Conic projection
Size and shape converge at one pole, suited for regional mapping, looks like a cone on a 2D plane.
Map distortion
Always distorted; distortion can be decreased but cannot be perfected.
Conformal map
Distorts but keeps shape.
Cylindrical map
Distorts but preserves direction.
Equal area map
Distortion is equal, but shapes are wrong.
Reference maps
Generalized sources of geographic data and focus on location.
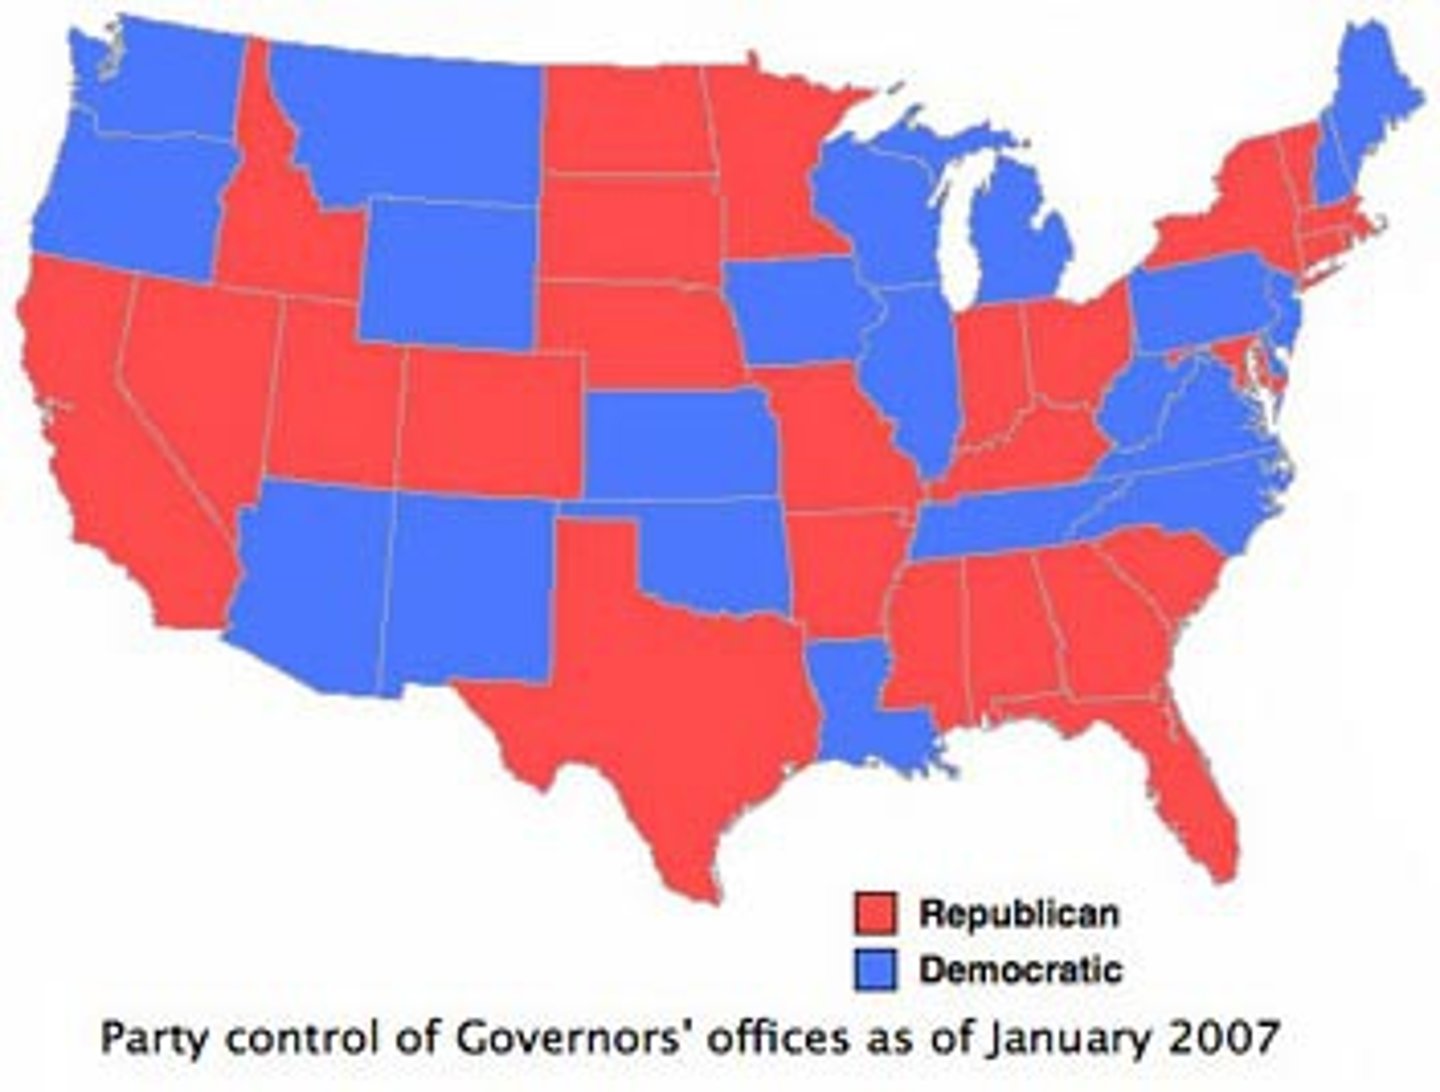
Thematic maps
Have a theme or specific purpose.
Basemap
Foundation of reference maps and theme maps.
Isoline map
Connects data points of equal value, like elevation, temperature, or precipitation using lines.

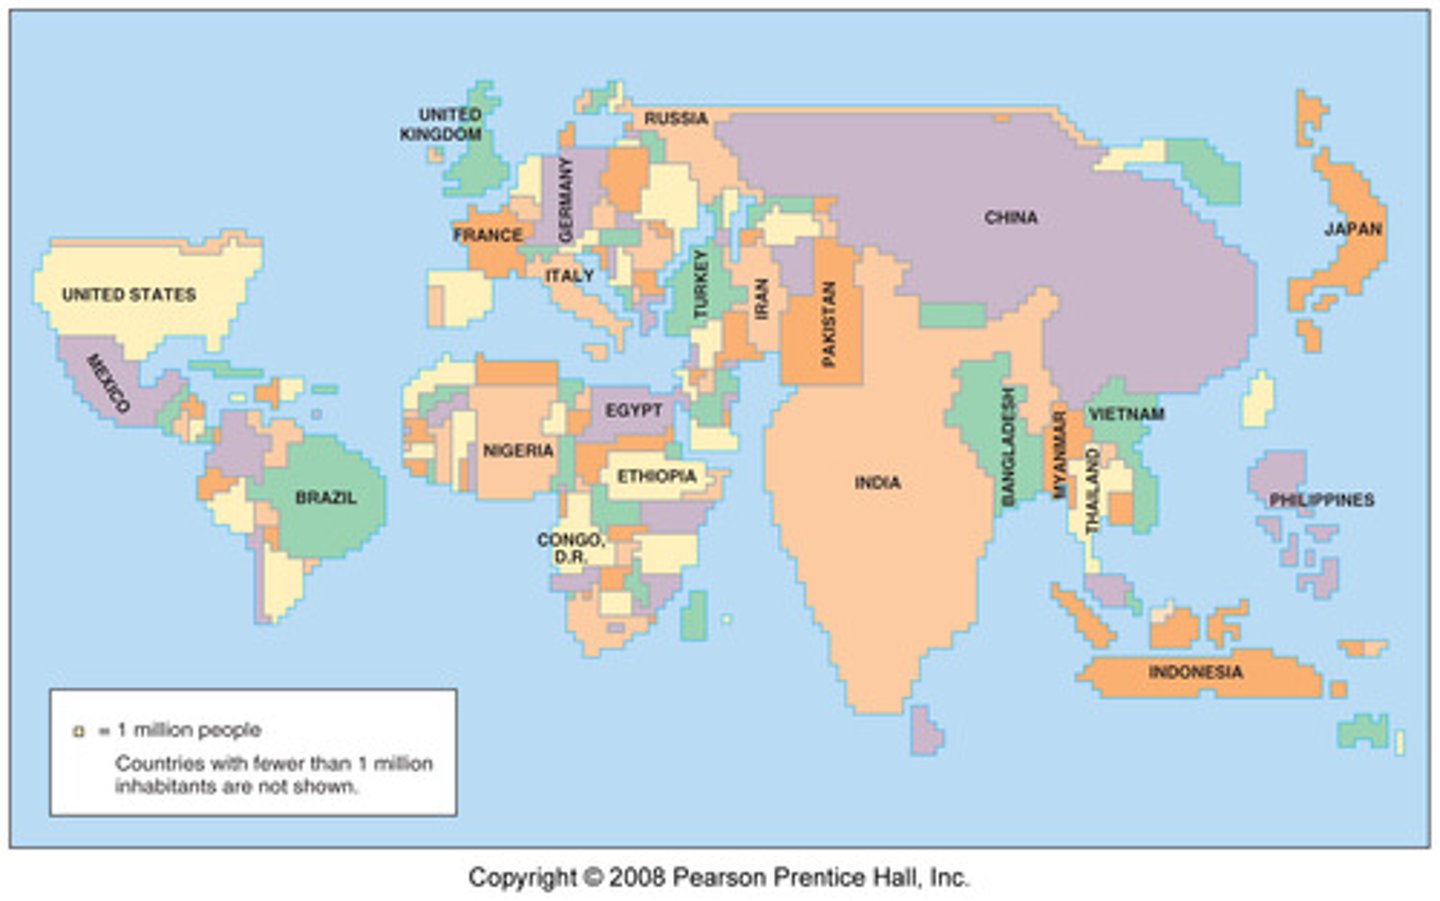
Cartogram
Conveys information by making area proportional to the variable.
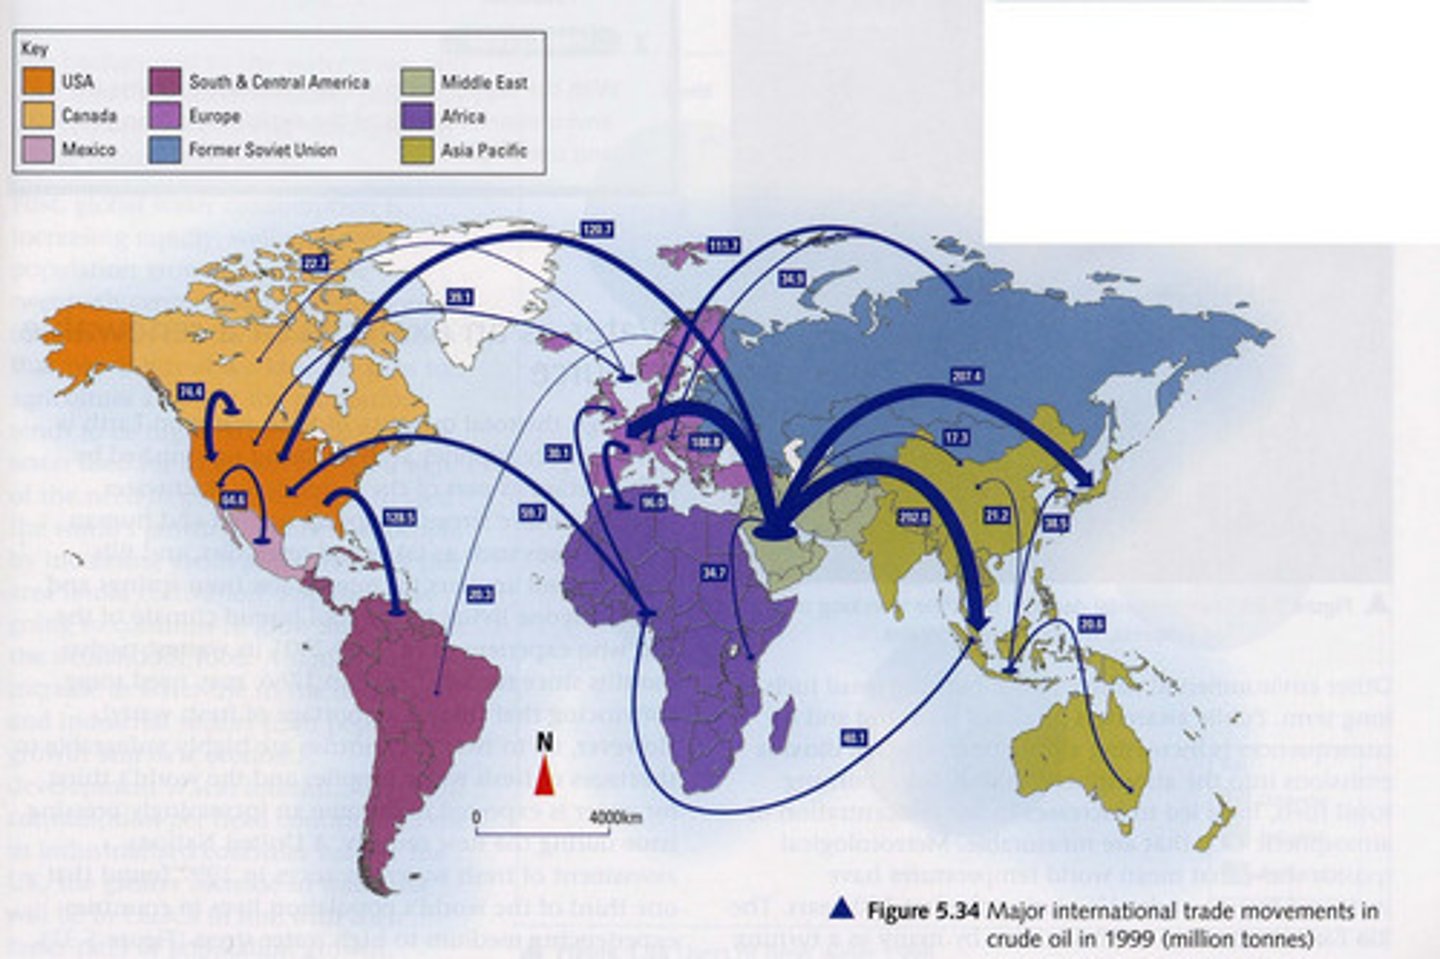
Flow line map
A map using lines to show the flow of data.