Understanding Elasticity in Economics
1/531
There's no tags or description
Looks like no tags are added yet.
Name | Mastery | Learn | Test | Matching | Spaced | Call with Kai |
|---|
No analytics yet
Send a link to your students to track their progress
532 Terms
Elasticity
Measures responsiveness of one variable to another.
Price Elasticity of Demand
Sensitivity of quantity demanded to price changes.
Price Elasticity of Supply
Sensitivity of quantity supplied to price changes.
Polar Cases of Elasticity
Extreme scenarios of elasticity: perfectly elastic/inelastic.
Constant Elasticity
Elasticity remains the same regardless of price changes.
Tiered Pricing
Different price levels for varying service access.
Netflix Price Hike
60% increase in subscription costs in 2011.
Cigarette Tax
Tax on cigarettes to reduce consumption and raise revenue.
Sin Tax
Tax on goods harmful to health, like cigarettes.
Average State Cigarette Tax
$1.76 per pack as of 2021.
Federal Cigarette Tax
$1.01 per pack as of 2021.
Impact of Competitors
Availability of alternatives affects consumer price sensitivity.
Law of Demand
Higher prices lead to lower quantity demanded.
Law of Supply
Higher prices lead to higher quantity supplied.
Consumer Reaction
Responses to price changes based on alternatives available.
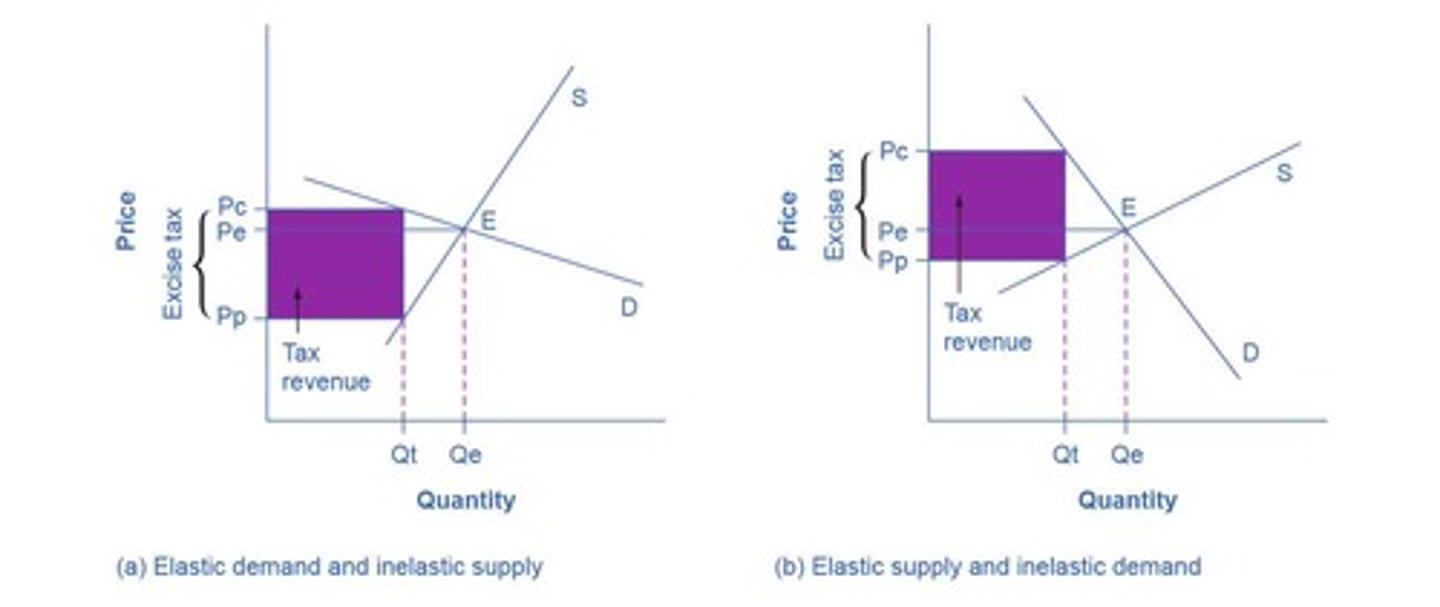
Revenue Generation
Tax revenue influenced by elasticity of demand.
Cigarette Consumption
Decline in purchases due to increased taxes.
Netflix Subscription Changes
Increased costs led to consumer choice dilemmas.
Streaming Video Pricing
Monthly fees for digital content access.
Economic Example
Real-world scenarios illustrating elasticity concepts.
Bounce Comparison
Tennis ball vs. brick illustrates elasticity concept.
Quantity Demanded
Amount consumers are willing to buy at a price.
Quantity Supplied
Amount producers are willing to sell at a price.
Price Elasticity of Demand
Ratio of quantity demanded change to price change.
Price Elasticity of Supply
Ratio of quantity supplied change to price change.
Elastic Demand
Elasticity greater than one; high price responsiveness.
Inelastic Demand
Elasticity less than one; low price responsiveness.
Unitary Elasticity
Elasticity equals one; proportional price responsiveness.
Midpoint Method for Elasticity
Calculates elasticity using average percent changes.
Percentage Change in Quantity Demanded
Change in quantity demanded divided by original quantity.
Percentage Change in Price
Change in price divided by original price.
Absolute Value of Elasticity
Elasticity reported without negative sign for demand.
Price Increase Effect
Higher prices typically reduce quantity demanded.
Price Decrease Effect
Lower prices typically increase quantity demanded.
Demand Curve
Graph showing relationship between price and quantity demanded.
Supply Curve
Graph showing relationship between price and quantity supplied.
High Responsiveness
Indicates significant change in quantity with price change.
Low Responsiveness
Indicates minimal change in quantity with price change.
Price Elasticity Calculation
Percentage change in quantity over percentage change in price.
Negative Elasticity
Demand elasticity is always negative due to inverse relationship.
Example of Inelastic Demand
10% price increase results in 4.5% quantity decrease.
Example of Elastic Demand
Elasticity greater than one indicates significant quantity change.
Price Sensitivity
Consumer reaction to price changes affecting demand.
Sales Price Consideration
Firms assess demand impact before raising prices.
Cigarette Tax Analysis
Government evaluates tax effects on cigarette consumption.
Price Elasticity of Demand
Measures responsiveness of quantity demanded to price change.
Price Elasticity of Supply
Measures responsiveness of quantity supplied to price change.
Midpoint Formula
Calculates elasticity using average values for price and quantity.
Inelastic Demand
Demand elasticity less than 1, quantity changes less than price.
Elastic Demand
Demand elasticity greater than 1, quantity changes more than price.
Absolute Value of Elasticity
Elasticity expressed as a positive number, ignoring direction.
Slope of Demand Curve
Rate of change in quantity demanded relative to price change.
Percentage Change in Quantity
Change in quantity divided by original quantity, expressed as a percentage.
Percentage Change in Price
Change in price divided by original price, expressed as a percentage.
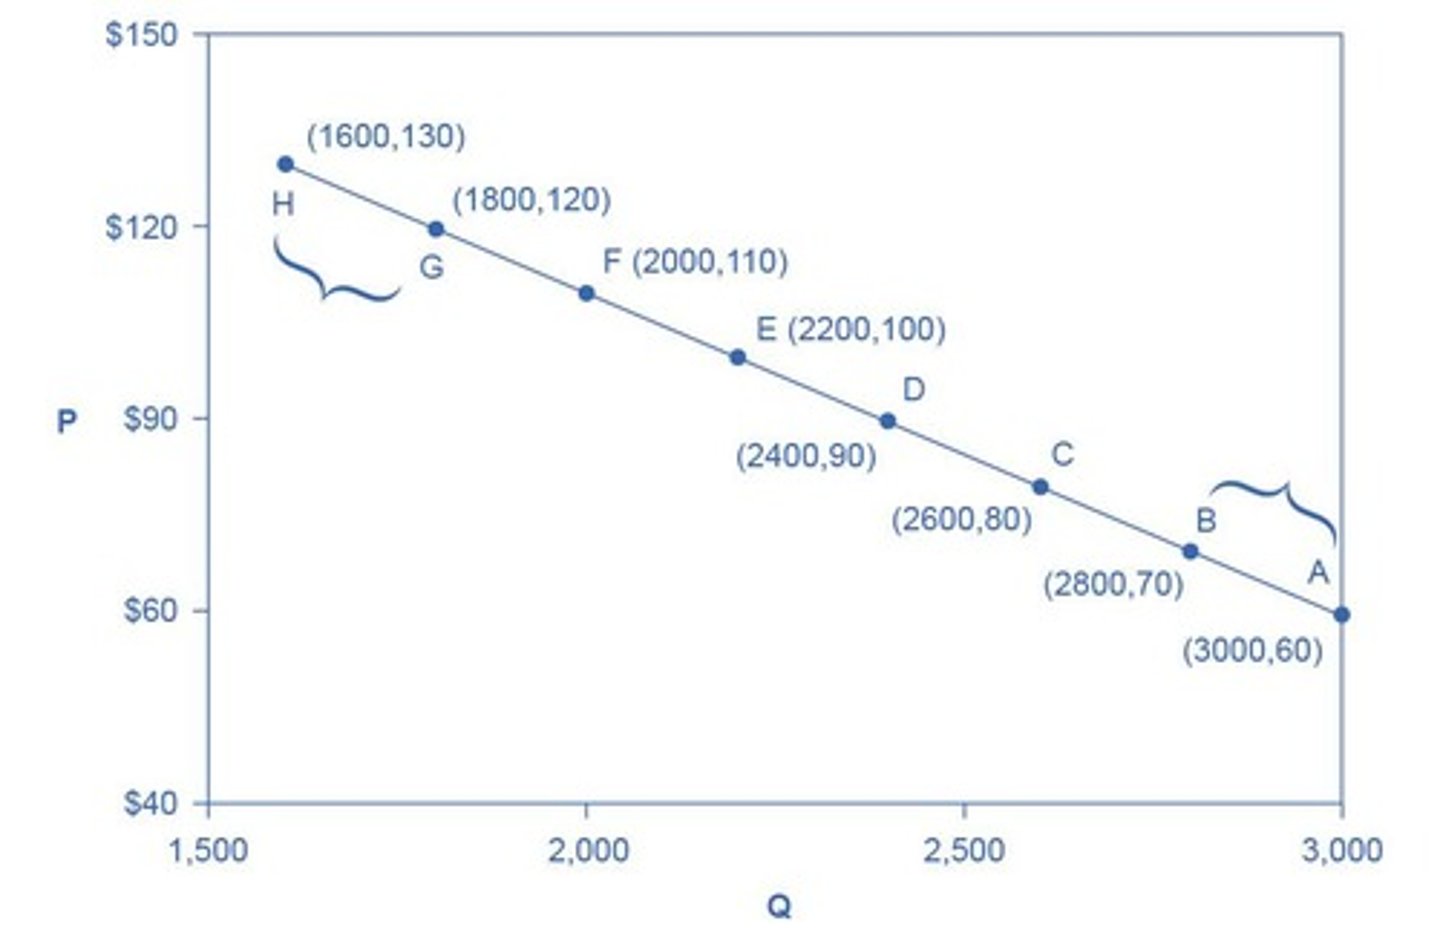
Elasticity between Points A and B
Measured as 0.45, indicating inelastic demand between these points.
Elasticity between Points G and H
Measured as 1.47, indicating elastic demand between these points.
Price Sensitivity
Degree to which quantity supplied changes with price change.
Unit Elastic Demand
Elasticity equal to 1, percentage changes in price and quantity equal.
Clear It Up Box
Clarifies common misconceptions about elasticity and slope.
Percentage Change Ratio
Elasticity is a ratio of two percentage changes.
High Price, Low Quantity
At upper demand curve, small quantity change is significant percentage.
Low Price, High Quantity
At lower demand curve, small quantity change is minor percentage.
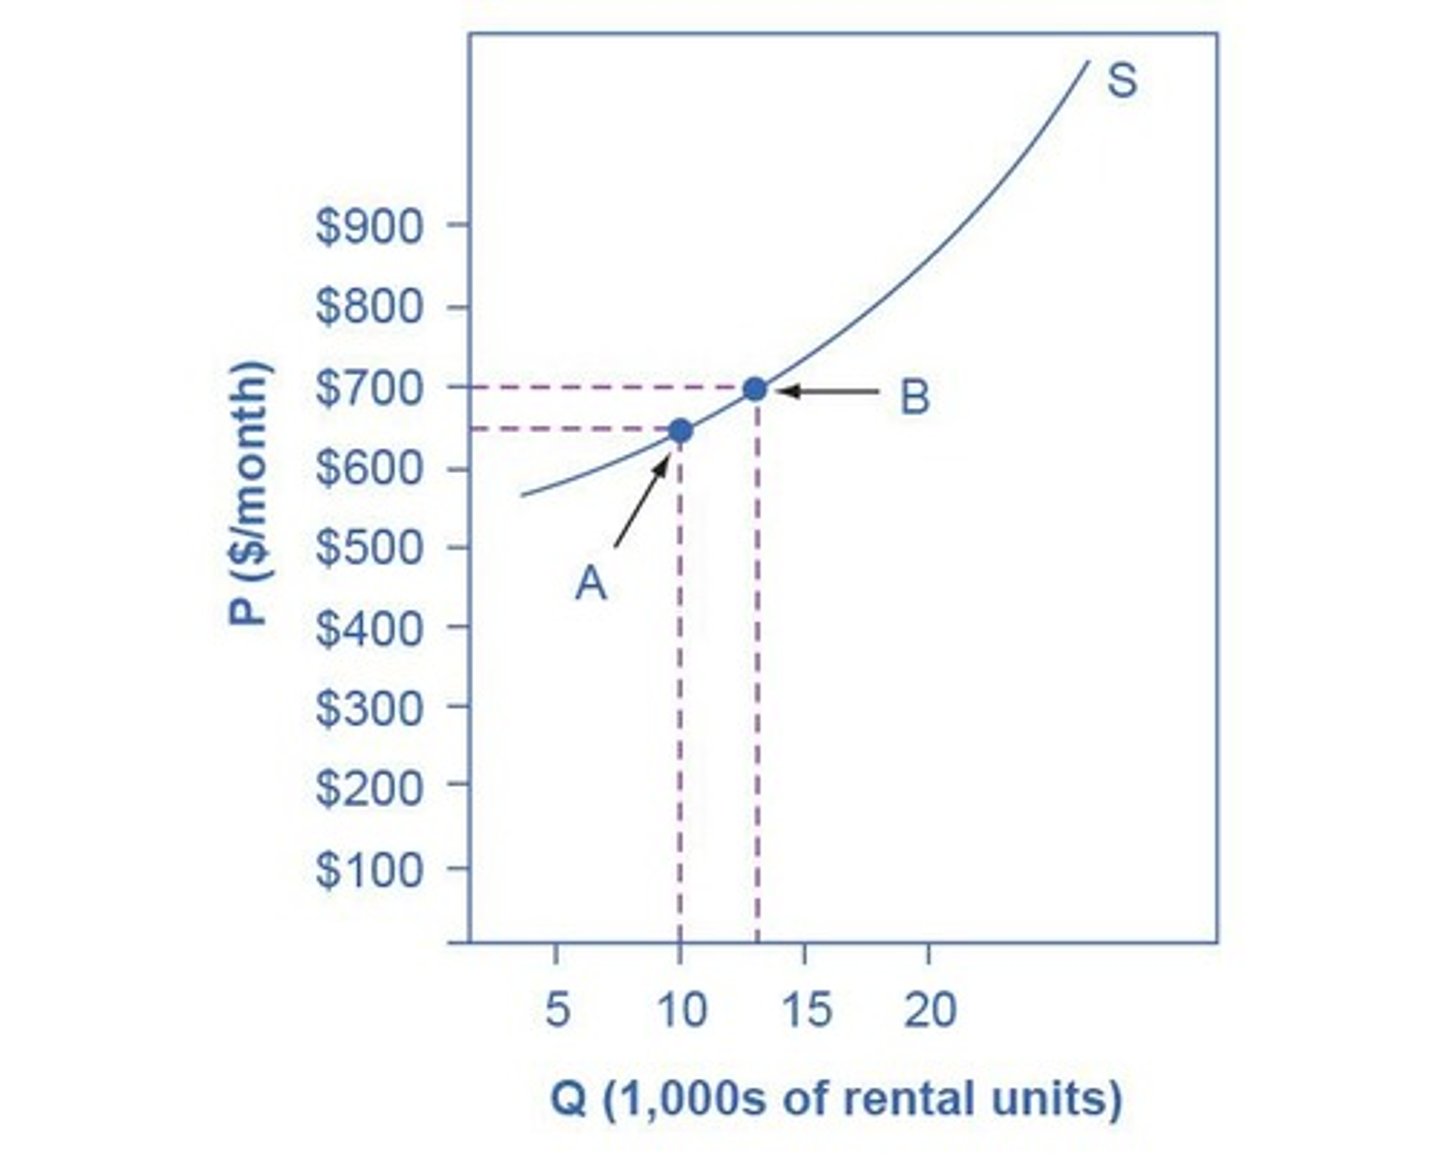
3.5% Quantity Supplied Increase
Result of 1% price increase in apartment rentals.
Demand Curve Characteristics
Demand elasticity varies along a straight-line demand curve.
Landlord Supply Response
Increased from 10,000 to 13,000 units with price rise.
Price Elasticity Interpretation
Elasticity indicates how much quantity responds to price changes.
Elasticity
Responsiveness of quantity to price changes.
Inelasticity
Low responsiveness of quantity to price changes.
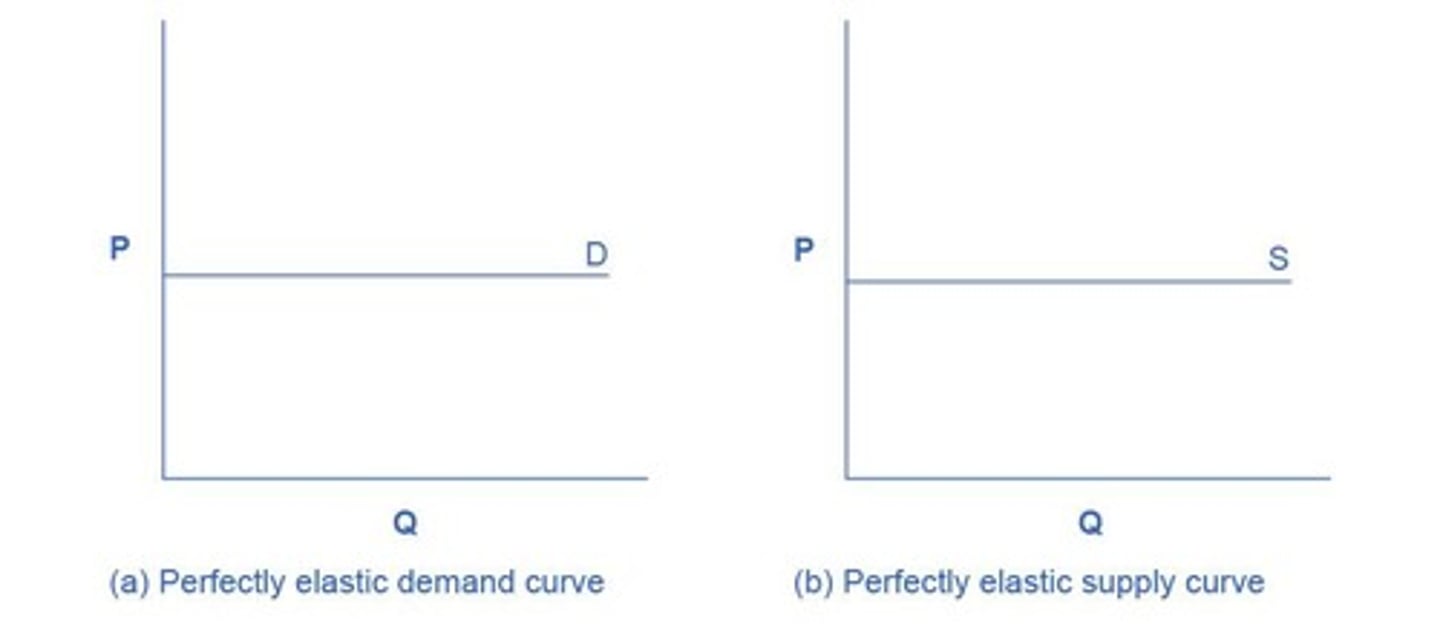
Infinite Elasticity
Quantity changes infinitely with any price change.
Perfectly Elastic Demand
Horizontal demand curve; infinite quantity at price.
Perfectly Elastic Supply
Horizontal supply curve; infinite supply at price.
Highly Elastic Goods
Goods with many substitutes or luxury items.
Examples of Highly Elastic Demand
Caribbean cruises and sports vehicles.
Zero Elasticity
No change in quantity despite price changes.
Perfectly Inelastic Demand
Vertical demand curve; quantity unchanged by price.
Perfectly Inelastic Supply
Vertical supply curve; supply unchanged by price.
Highly Inelastic Goods
Necessities with no close substitutes.
Examples of Highly Inelastic Demand
Life-saving drugs and gasoline.
Constant Unitary Elasticity
One percent price change equals one percent quantity change.
Midpoint Method
Calculates elasticity between two points on a curve.
Elasticity Equals 1
Percentage change in price equals percentage change in quantity.
Demand Curve Shape
Curved with steeper left and flatter right.
Percentage Change
Comparison of changes in price and quantity.
Quantity Demanded (Qd)
Total amount of a good consumers are willing to buy.
Quantity Supplied (Qs)
Total amount of a good producers are willing to sell.
Price Change Impact
Affects both quantity demanded and supplied.
Graph Classification
Analyzing graphs to determine elasticity type.
Elasticity Measurement
Ratio of percentage change in quantity to price.
Demand Curve Slope
Indicates elasticity; steeper means more inelastic.
Unitary Elasticity Demand Curve
Curved line where price and quantity change equally.
Unitary Elasticity Supply Curve
Straight line through origin with constant percentage changes.
Midpoint Method
Calculates percentage changes using average values.
Constant Unitary Elasticity
Elasticity remains constant across all points on curve.
Elasticity of Demand
Sensitivity of quantity demanded to price changes.
Elasticity of Supply
Sensitivity of quantity supplied to price changes.
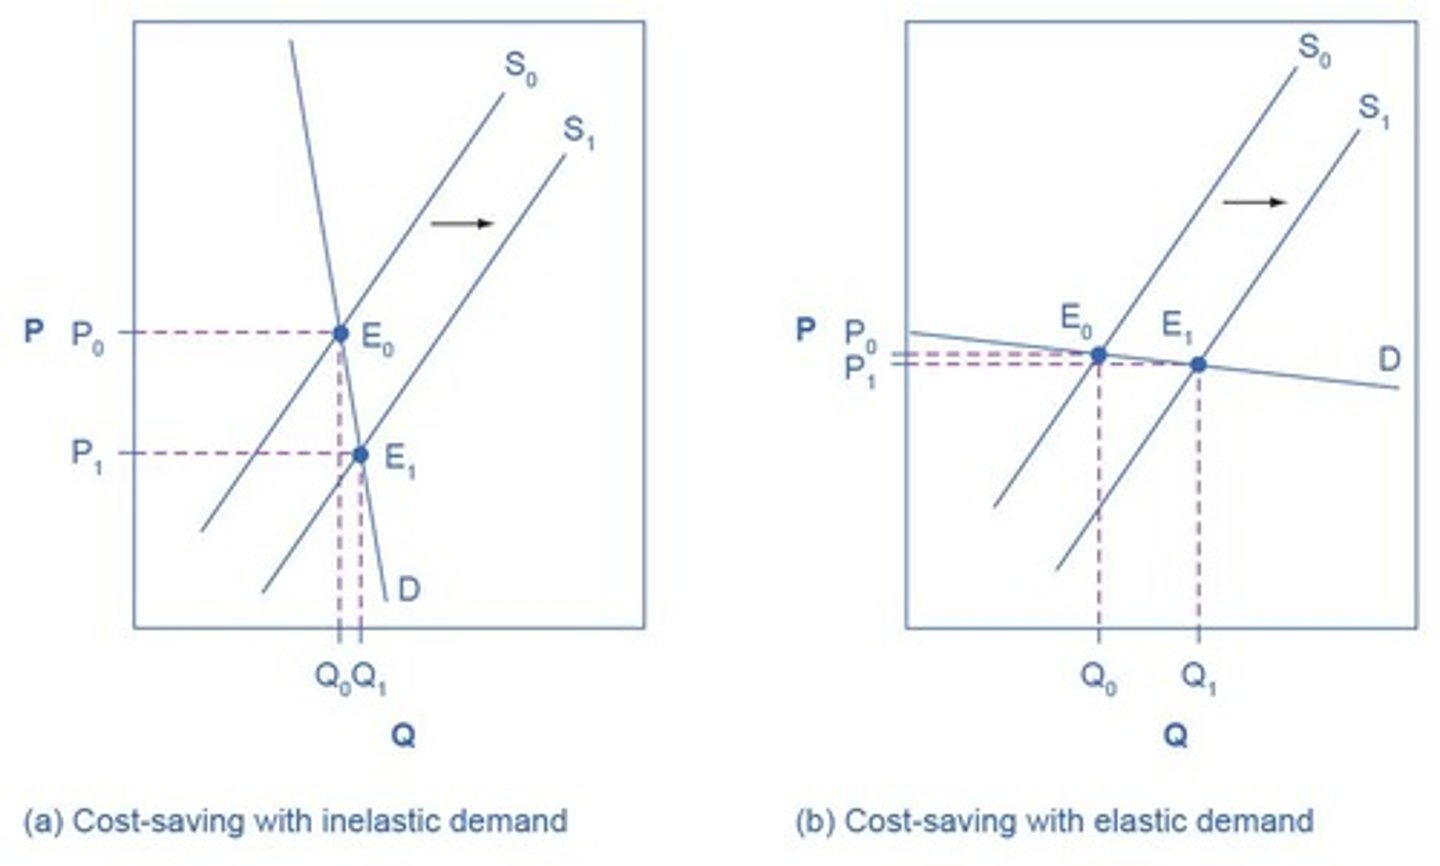
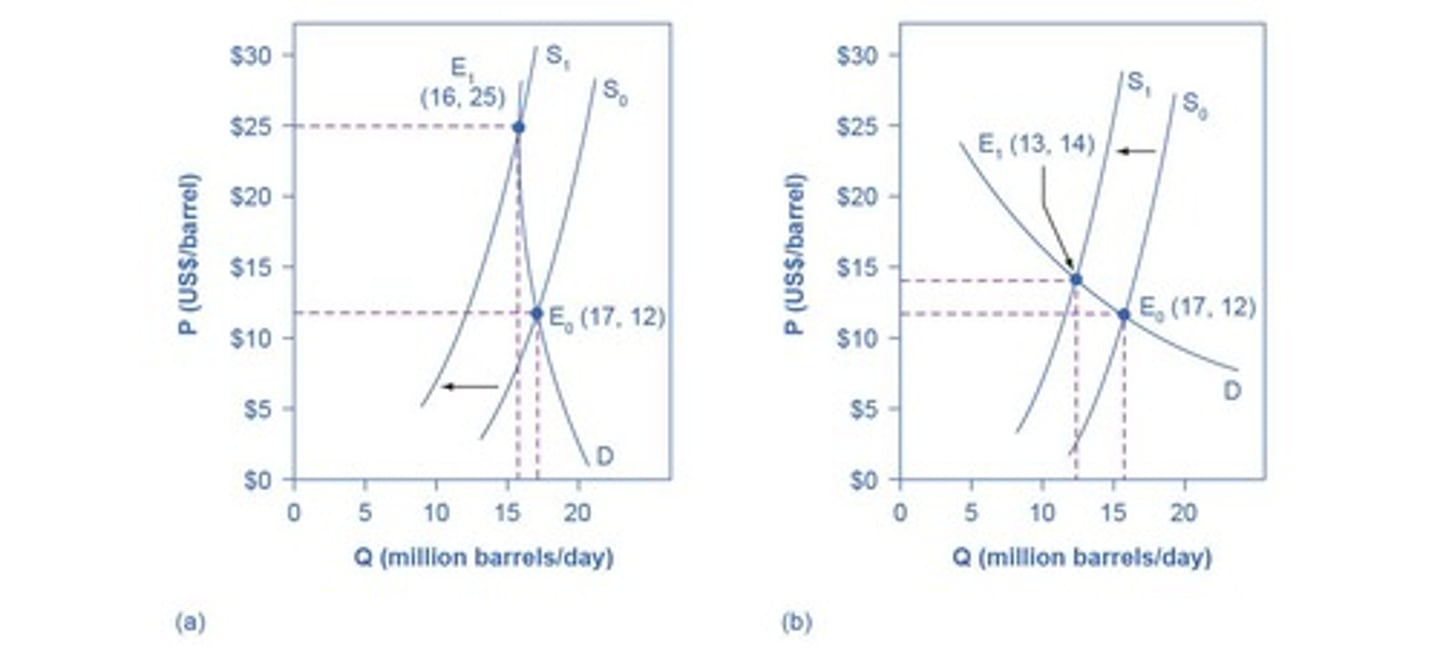
Inelastic Demand
Demand changes little with price changes, e.g., housing.
Elastic Demand
Demand changes significantly with price changes, e.g., restaurant meals.
Revenue Impact of Elasticity
Elasticity affects total revenue from sales.
Short-run Elasticity
Elasticity measured over a brief time period.
Long-run Elasticity
Elasticity measured over a longer time horizon.