Ch 7: Sampling Distributions

studied byStudied by 10 people
1.0(1)
get a hint
hint

x bar (the sample mean)

1 / 22

23 Terms

1

x bar (the sample mean)

estimates μ (the population mean)

New cards
2

p hat (the sample proportion)

estimates p (the population proportion)

New cards
3

Sx (the sample st. dev.)

estimates σ (the population st. dev.

New cards
4

statistic

describes characteristics of a sample

New cards
5

parameter

describes characteristics of a population

New cards
6

sampling variability

different random samples of the same size from the same population product different values for a statistic

New cards
7

sampling distribution

distribution of values taken by the statistic in all possible samples of the same size from the same population

New cards
8

unbiased estimator

mean of the sampling distribution is equal to the value of the parameter being estimated

New cards
9

variability

described by the spread of its sampling distribution — inversely proportional to sample size

New cards
10

 sampling distribution of the sample proportion p hat

describes the distribution of values taken by the sample proportion p hat in all possible samples of the same size from the same population. 

New cards
11

mean of the sampling distribution

<math xmlns="http://www.w3.org/1998/Math/MathML" display="block" data-is-equatio="1" data-latex="\mu_{\hat{p}}=p"><msub><mi>μ</mi><mrow data-mjx-texclass="ORD"><mrow data-mjx-texclass="ORD"><mover><mi>p</mi><mo stretchy="false">^</mo></mover></mrow></mrow></msub><mo>=</mo><mi>p</mi></math>


New cards
12

standard deviation of the sampling distribution (as long as the 10% condition is satisfied)

<math xmlns="http://www.w3.org/1998/Math/MathML" display="block" data-is-equatio="1" data-latex="\sigma_{\hat{p}}=\sqrt{\frac{p\left(1-p\right)}{n}}"><msub><mi>σ</mi><mrow data-mjx-texclass="ORD"><mrow data-mjx-texclass="ORD"><mover><mi>p</mi><mo stretchy="false">^</mo></mover></mrow></mrow></msub><mo>=</mo><msqrt><mfrac><mrow><mi>p</mi><mrow data-mjx-texclass="INNER"><mo data-mjx-texclass="OPEN">(</mo><mn>1</mn><mo>−</mo><mi>p</mi><mo data-mjx-texclass="CLOSE">)</mo></mrow></mrow><mi>n</mi></mfrac></msqrt></math>

New cards
13

sampling distribution is approximately Normal if

the Large Counts condition is satisfied

New cards
14

mean of the sampling distribution of p1-p2

<math xmlns="http://www.w3.org/1998/Math/MathML" display="block" data-is-equatio="1" data-latex="\mu_{\hat{p}_1-\hat{p}_2\ =\ p_1-p_2}"><msub><mi>μ</mi><mrow data-mjx-texclass="ORD"><msub><mrow data-mjx-texclass="ORD"><mover><mi>p</mi><mo stretchy="false">^</mo></mover></mrow><mn>1</mn></msub><mo>−</mo><msub><mrow data-mjx-texclass="ORD"><mover><mi>p</mi><mo stretchy="false">^</mo></mover></mrow><mn>2</mn></msub><mtext></mtext><mo>=</mo><mtext></mtext><msub><mi>p</mi><mn>1</mn></msub><mo>−</mo><msub><mi>p</mi><mn>2</mn></msub></mrow></msub></math>

New cards
15

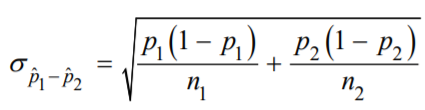
standard deviation of p1-p2 if the 10% condition is met

New cards
16

shape of the sampling distribution of p1-p2 is approximately Normal if

the Large Counts condition is met for BOTH samples

New cards
17

sampling distribution of the sample mean x-bar

distribution of values taken by the sample mean x-bar in all possible samples of the same size from the same population

New cards
18

mean of the sampling distribution of x-bar

<math xmlns="http://www.w3.org/1998/Math/MathML" display="block" data-is-equatio="1" data-latex="\mu_{\overline{x}}=\mu"><msub><mi>μ</mi><mrow data-mjx-texclass="ORD"><mover><mi>x</mi><mo accent="true">―</mo></mover></mrow></msub><mo>=</mo><mi>μ</mi></math>

New cards
19

standard deviation of the sampling distribution of x-bar as long as the 10% condition is met

<math xmlns="http://www.w3.org/1998/Math/MathML" display="block" data-is-equatio="1" data-latex="\sigma_{\overline{x}}=\frac{\sigma}{\sqrt{n}}"><msub><mi>σ</mi><mrow data-mjx-texclass="ORD"><mover><mi>x</mi><mo accent="true">―</mo></mover></mrow></msub><mo>=</mo><mfrac><mi>σ</mi><msqrt><mi>n</mi></msqrt></mfrac></math>

New cards
20

central limit theorem

when n is sufficiently large (> or =30), the sampling distribution of the sample mean xis approximately Normal.

New cards
21

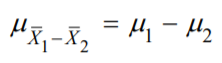
mean of the sampling distribution of x1-x2

New cards
22

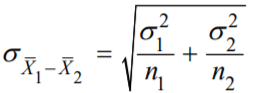
standard deviation of the sampling distribution of x1-x2 as long as the 20% condition is met

New cards
23

the shape of the sampling distribution of x1-x2 is Normal if

both populations are normal OR if the CLT is satisfied

New cards

Explore top notes

note Note
studied byStudied by 9 people
Updated ... ago
5.0 Stars(1)
note Note
studied byStudied by 6 people
Updated ... ago
5.0 Stars(1)
note Note
studied byStudied by 5 people
Updated ... ago
5.0 Stars(1)
note Note
studied byStudied by 10 people
Updated ... ago
5.0 Stars(1)
note Note
studied byStudied by 73 people
Updated ... ago
4.0 Stars(2)
note Note
studied byStudied by 47 people
Updated ... ago
5.0 Stars(1)
note Note
studied byStudied by 21 people
Updated ... ago
5.0 Stars(1)
note Note
studied byStudied by 26 people
Updated ... ago
5.0 Stars(1)

Explore top flashcards

flashcards Flashcard51 terms
studied byStudied by 7 people
Updated ... ago
5.0 Stars(1)
flashcards Flashcard40 terms
studied byStudied by 31 people
Updated ... ago
5.0 Stars(1)
flashcards Flashcard46 terms
studied byStudied by 2 people
Updated ... ago
5.0 Stars(1)
flashcards Flashcard21 terms
studied byStudied by 14 people
Updated ... ago
5.0 Stars(1)
flashcards Flashcard90 terms
studied byStudied by 21 people
Updated ... ago
5.0 Stars(2)
flashcards Flashcard20 terms
studied byStudied by 1 person
Updated ... ago
5.0 Stars(1)
flashcards Flashcard223 terms
studied byStudied by 23 people
Updated ... ago
5.0 Stars(1)
flashcards Flashcard27 terms
studied byStudied by 12 people
Updated ... ago
5.0 Stars(1)