Econ 102 - Consumer Price Index
1/30
Earn XP
Description and Tags
Name | Mastery | Learn | Test | Matching | Spaced | Call with Kai |
|---|
No study sessions yet.
31 Terms
Consumer Price Index (CPI)
An indicator of the changes in consumer prices experienced by Canadians, published each month. It is obtained by comparing, through time, the cost of a fixed basket of commodities purchased by Canadian consumers in a particular year. Since the basket contains commodities of unchanging or equivalent quantity and quality, the index reflects only pure price movements. (as defined by StatCan)
How CPI affects Canadians/importance
The CPI provides information about price changes to government, workers,
and businesses; who use the CPI to formulate policy and make decisionsCPI is used by the Bank of Canada to formulate monetary policy, by the
government to adjust transfer payments, income-tax brackets and by businesses and the government to provide cost-of-living adjustments to CanadiansThe CPI is used to deflate many economic series such as the national
accounts, retail sales, and hourly earnings
Basket of Goods categories
Basket contains around 700 goods, the eight categories include:
Food (16.7%)
Shelter (28.3%)
Household operations and furnishings
Clothing and footwear
Transportation (16.4)
Health and personal care
Recreation, education and reading
Alcoholic beverages and tobacco products
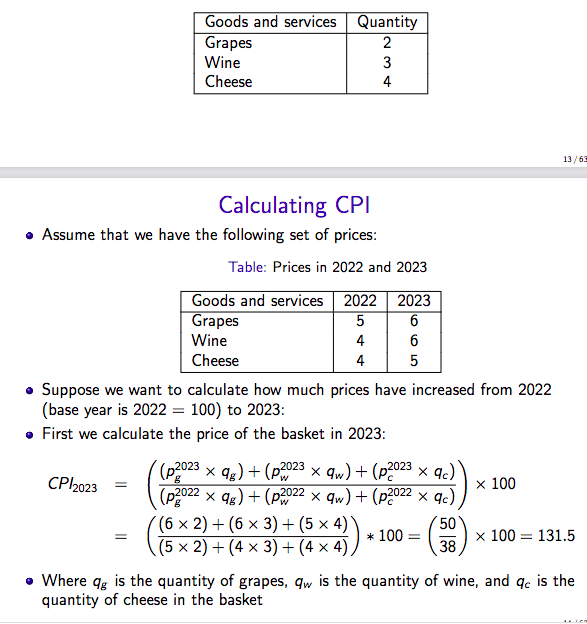
Calculating CPI
*after calculating basket prices, use YoY growth rate to see how average prices have increased
Inflation vs. Deflation
Inflation is the rate at which the average price level is increasing over time
Deflation is the rate at which the average price level is falling over time
Inflation calculation

Inflation trends/periods in Canada
Four distinct periods when you look at total CPI:
1. Great inflation of the 1970s
2. Disinflation in the 1980
3. Stable inflation around the Bank of Canada target from the mid 1990s until 2021
4. High and volatile inflation since early 2021
Inflation of the 1970’s
Causes of high/volatile inflation include:
Bad luck and bad shocks
(Multiple oil price shocks that led to high energy prices)Bad policy because central banks did not aggressively raise the interest rates
to fight inflation
1980’s disinflation
Banks became more determined to bring inflation down, and became more restrictive
1990’s inflation targeting
Since 1990s, the Bank of Canada main objective is to target total CPI inflation between 1%-3%.
The Bank of Canada, when setting monetary policy and interest rates, aims to achieve an inflation rate of 2%, the middle of the target band.
2021 high inflation
What might have and still causing inflation in Canada?
Supply constraints and supply-chain issues resulting from Covid
Tight labour market
Excess demand for goods and services
Conflicts in Ukraine and the Middle East are putting pressure on energy, food
prices and transportation costs
Real Value of money (inflation, deflation)
Higher inflation = fall in purchasing power of money, it becomes less valuable
Deflation = purchasing power of money increases (people can afford more) but it also increases the value of debt (money worth more means debt is worth more)
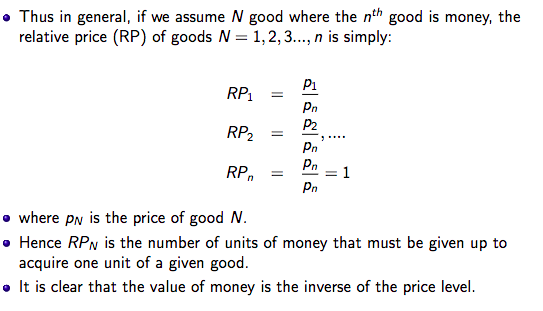
Relative Price
The amount of money or units of money you have to give up to obtain a good/service
*when this goes up, PP/real value of money falls
Debt-deflation cycle
Deflation leads to increase in real value of debt, which depresses the economy (people consume less since they needs to pay off debt), this leads to a fall in output, which causes prices to fall even more and for the value of debt to continue increasing
e.g. 1930’s Great Depression
Nominal Variable
variable is calculated using current prices and reflects the current monetary value of that variable
Real Variable
a nominal variable that accounts for the effects of inflation
Bank of Canada Inflation target
1-3%
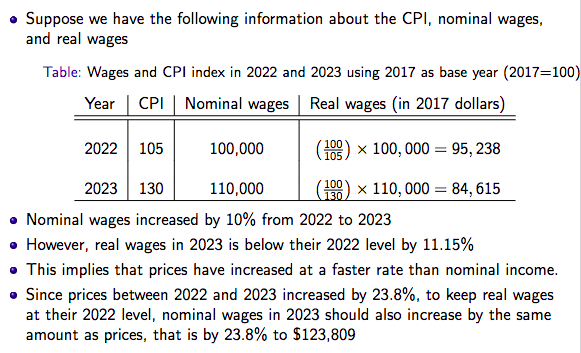
Cost of Living adjustment (COLA)
An increase in wages based on inflation and how much cost of living has changed over time.
This COLA is needed to compensate workers for the fall in the real value (or purchasing power) of their nominal wages.
Deflating Nominal variables
When the CPI is used to convert nominal variables in real terms to eliminate effects of inflation (divide nominal value by price index)
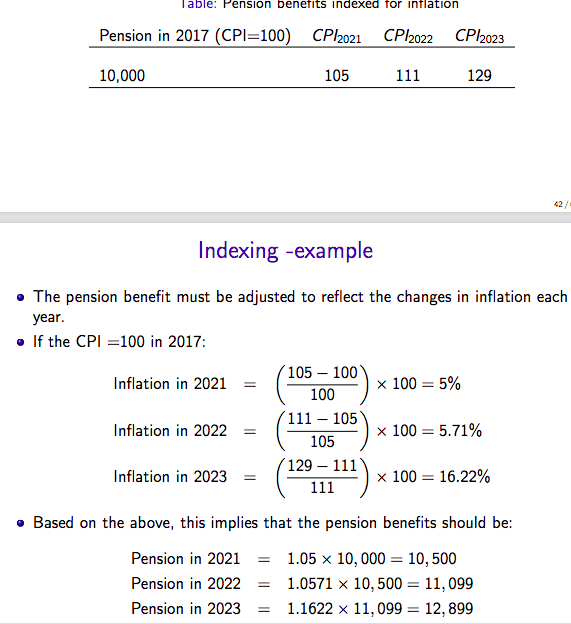
Indexing Nominal variables
when certain types of expenditures and payments are often adjusted each year to reflect the changes in inflation
e.g. if the rate of inflation is 2% per year, pension benefits may be indexed by the same amount
Nominal Interest rate
the payment someone receives on the initial investment (as a percentage)
Real interest rate
your payment (returns) after accounting for inflation.
*e.g. Assume that average price level increases by 10% the same year. Thus, although the bondholders are better off in nominal terms, they are not in real terms since the price of goods and services also increased by 10%. In other words, inflation has eroded the purchasing power of the nominal return on the bond
Fisher equation
How real and nominal interest rates relate to each other.
Denoting the nominal interest rate by i, the real rate by r and the inflation rate by π, we obtain:
r = i − π
Problems with CPI: Fixed basket of goods/improvements in quality
The quantity and quality of the goods included in the basket of goods are assumed fixed over time. Although the basket is updated periodically, it does not reflect improvement or changes in the quality of goods (e.g phone/computer speed), and it does not reflect changes in tastes and preferences of agents
Problems with CPI: Ignore improvements
Improvements in quality benefit consumers, but is not taken into account when calculating CPI, thus leading to conclusion that consumer are worse off based solely on price increases (which over estimates reasons for price increase)
Problems with CPI: Substitution bias
ignores the fact that consumers may not be worse off, since they can adapt to price changes by substituting goods/services.
e.g. if the price of beef is increasing, consumers substitute chicken for beef, and consume more chicken and less beef. CPI will reflect this change in beef price, indicating increase in cost of living, ignoring consumers have adapted by buying more chicken
Problems with CPI: Sample bias
When data on prices are collected, the sample prices are obtained only from a sample of stores.
Often not including discount stores which have lower prices for the same products sold in
supermarkets. Thus, the CPI survey will not
capture that prices for some goods are lower than indicated in the survey.
*this, along with not accounting for quality changes and substitution, leads many to believe CPI overstates actual cost of living
Why GDP deflator seen as better measure for COL
The GDP deflator measures the change in the price level of all goods and services produced at a given time in Canada (instead of fixed basket).
Thus, including the prices of more goods and services than the CPI and gives a broader picture of what is happening to the price of goods and services bought by consumers.
Other differences between CPI and GDP deflator
the GDP deflator measures the price of goods and services produced domestically, whereas the CPI also includes the price of
imported goods (changes in price of foreign goods affects the CPI and not the GDP
deflator)
*For an economy that consumes many imported goods, the GDP deflator may understate the cost of livingCPI assigns fixed weights, GDP assigns different weights, e.g. if quantity of apples produced falls to 0, CPI will show sharp increase in price, and GDP deflator will not since output is now at 0.
*thus, CPI index overstates the impact of the increase in the price of apples on consumer by ignoring substitution, but GDP deflator understates the actual impact of the increase in the price of apples for those who cannot substitute
Core CPI
since some CPI components are more volatile, StatCan computes some indices of prices that exclude the movement in prices of volatile components of the CPI (better shows long-run trends)
*affects policy as BOC may not react to all items CPI increasing past range if the core CPI is staying stable
3 Measures of Core CPI (inflation)
CPI-trim: “excludes CPI components whose rates of change in a given month are located in the tails of the distribution of price changes.”
CPI-common: “tracks common price changes across categories in the CPI basket.”
CPI-median: “measure of core inflation corresponding to the price change located at the 50th percentile (in terms of the CPI basket
weights) of the distribution of price changes in a given month.”