APES Chapter 20 Study Guide
1/101
There's no tags or description
Looks like no tags are added yet.
Name | Mastery | Learn | Test | Matching | Spaced |
|---|
No study sessions yet.
102 Terms
Why does Climate Change occur?
Human Causes- increase in GHG, deforestation, burning fossil fuels, industrial/agricultural, transportation, waste
Natural Causes- volcanic eruptions, forest fires, el nino/ la nina, reflection of ice glaciers (ocean circulation changes), Milankovich cycles, global air circulation, area size change in ice, cencentation of GHG
Milutin Milankovitch Cycles
Eccentricity (Shape of Earth's Orbit), Axial Tilt (Obliquity), Precession (Wobble of Earth's Axis)
Greenhouse Gases: source
Carbon Dioxide(CO2): burning fossil fuels, deforestation
Methane(CH4): agricultures, landfills
Nitrous Oxide (N2O): Sewage, Burning Fossil Fuel, Deforestation
Troposphere vs. Stratosphere
Troposphere (0–12 km above Earth): Contains most of the atmosphere's mass (about 75–80%), holds nearly all water vapor, clouds, and weather systems, greenhouse gases like CO₂ and CH₄ trap heat, influencing climate.
Stratosphere (12–50 km above Earth): Contains the ozone layer, which protects Earth from harmful UV rays, volcanic eruptions or pollution can inject aerosols, affecting climate by reflecting sunlight.
Climate vs. Weather
Weather: Short-term changes in atmosphere variables such as the temp and precipitation in a period of hours or days
Climate: temp and weather over 3 decades
The Medieval Warm Period (Medieval Climatic Anomaly)
Warm temperatures that occurred between 900 and 1300 AD. It primarily affected the North Atlantic region, including parts of Europe, North America, and Asia, but its effects varied across the globe. Increased Solar Activity, Reduced Volcanic Activity, Changes in Ocean Currents, Arctic Ice Reduction
GHGs: Heat-Trapping Ability Per Molecule GWP(global warming potential compared to Carbon)
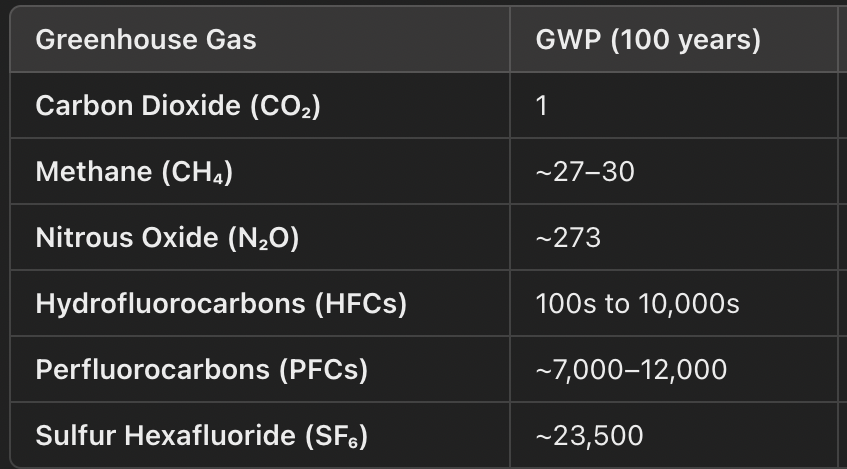
The two predominant naturally occurring GHGs
Carbon Dioxide and Methane
“The Atmospheric Window”
Range of wavelengths in the infrared spectrum (8–14 micrometers) where Earth's surface can radiate heat directly into space without significant absorption by greenhouse gases (GHGs). Greenhouse gases like water vapor (H₂O), carbon dioxide (CO₂), and methane (CH₄) can partially close this window by absorbing and re-emitting infrared radiation, trapping more heat in the atmosphere.
A Forcing defined; categories/types
Any factor that influences Earth's energy balance, causing climate changes.
GHG, Solar, Aerosol (cooling from volcanic eruptions)
El Nino
warm water builds up in the central and eastern Pacific Ocean
Glacial & Interglacial Periods
Glacials: tend to last 70,000-100,000 years; 5 have occurred over the last 500k yrs
Interglacials: last approximately 10k-15k yrs; this includes the current interglacial period, the Holocene Epoch
Paleo-Climate Proxy Data Sources: past climate data
Began in the 1880s- Sources: Corals, Ocean Sediment, Ice Cores, Tree Rings
Earth’s near-Surface Temperature over the past 140 years
Since 1880, Earth's average surface temperature has risen by ~1.2°C (2.2°F). The warmest years on record have occurred in the past decade, with 2016 and 2020 among the hottest. The rate of warming has accelerated since the mid-20th century, mainly due to human-caused greenhouse gas emissions.
The Predominant Anthropogenic GHG
(50-60%) Carbon Dioxide
Carbon Dioxide Plotted over Time
Pre-Industrial Era (~1750) – CO₂ levels were about 280 ppm.
1950s ("Keeling Curve" Begins) – CO₂ surpassed 315 ppm.
Present Day (2024) – CO₂ is over 420 ppm, the highest in at least 800,000 years.
Charles David Keeling Curve:
Plots Carbon Dioxide levels
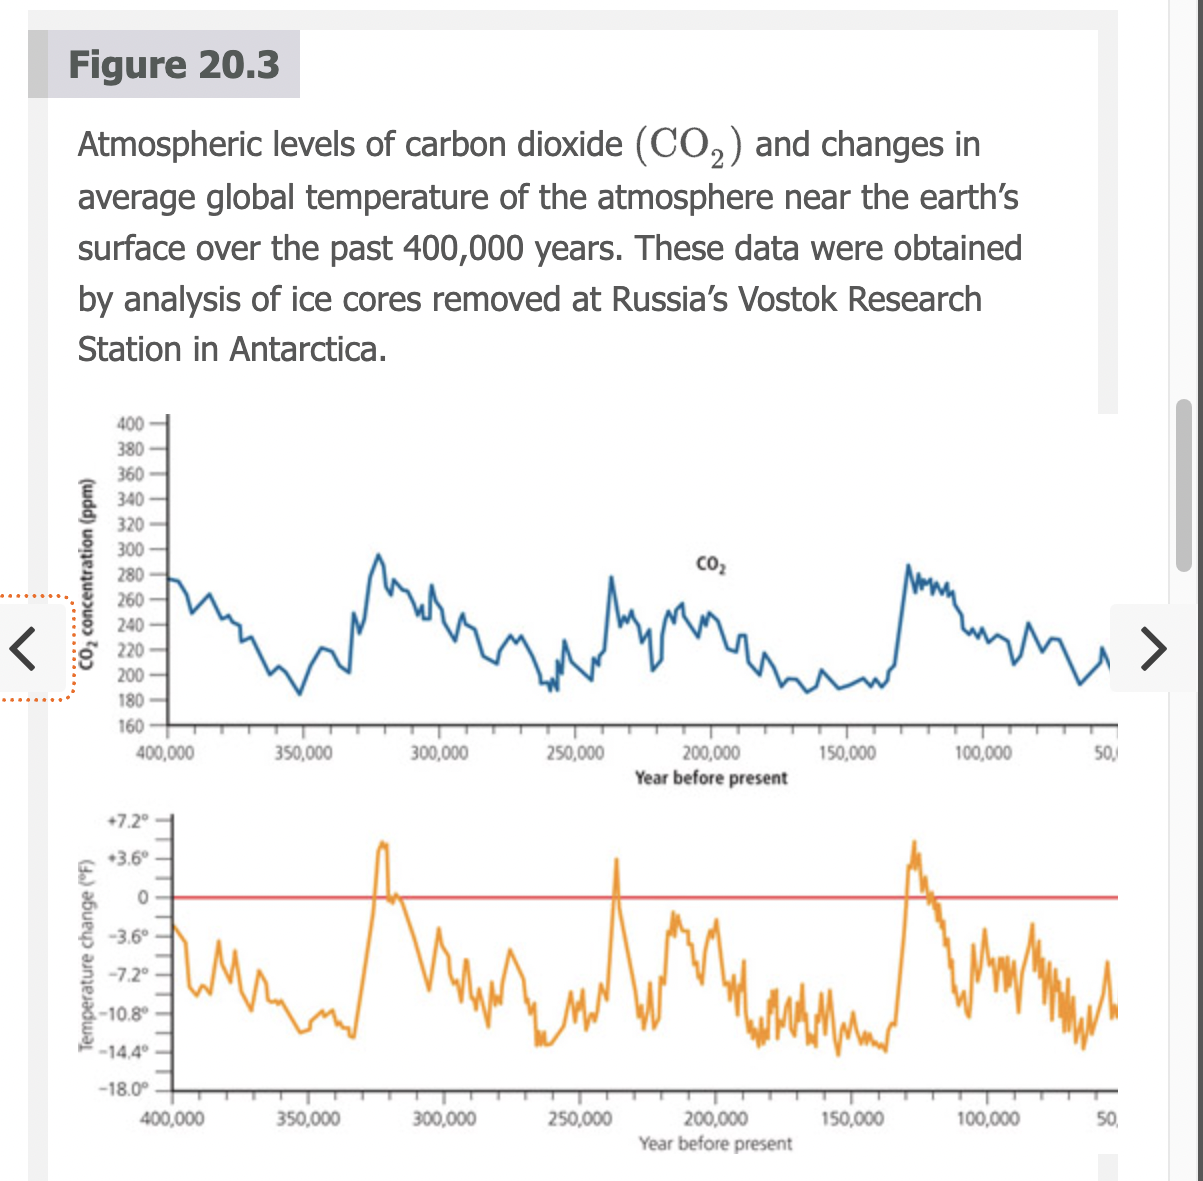
Carbon Dioxide and Temperature over Relatively Large Temporal Scales
Atmospheric levels of carbon dioxide and changes in average global temperature of the atmosphere near the earth’s surface over the past 400,000 years. These data were obtained by analysis of ice cores removed at Russia’s Vostok Research Station in Antarctica.
The Aerosol Effect Cooling
(e.g., stratovolcano Mount Pinatubo, 1991, Philippines)
Cool the Earth by reflecting sunlight back into space. Cumulus clouds have a similar effect blocking out the UV.
Sea Level Rise: given warming, the 2 Big Factors; over the last 100 years 8-17 cm
Thermal Expansion – As oceans warm, water expands, contributing to about 50% of sea level rise.
Melting Ice Sheets & Glaciers – Ice from Greenland, Antarctica, and mountain glaciers melts into the ocean, increasing water volume.
Glaciers and the Antarctic Ice Cap
Largest Ice Mass on Earth, shrinking from rising temperatures and sea levels.
Major Factors Influencing Earth’s Surface/Near Surface Temperature
Insulation, how much sunlight an area receives over time. Milankovitch Cycles
Major Factors Removing (or Modifying) Materials from the Atmosphere
Photodissociation, Oxidation, Precipitation, Sedimentation
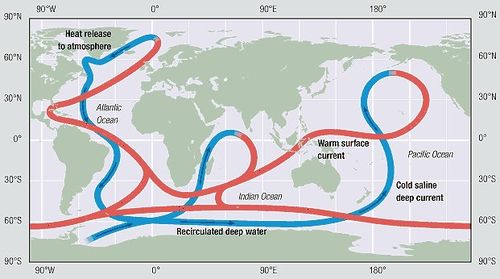
The Ocean Conveyer Belt
Ocean Conveyor Belt, or Thermohaline Circulation (THC), is a global system of ocean currents driven by temperature (thermo-) and salinity (-haline) differences.
Shifting Climate Belts: potential ramifications
As Earth warms, climate belts (tropical, temperate, polar zones) are shifting poleward, altering ecosystems and weather patterns.
Expansion of deserts – Sahara-like conditions could spread into Southern Europe & the U.S. Southwest.
Changes in agricultural zones – Some areas will gain longer growing seasons, while others face droughts and heat stress.
More frequent & intense wildfires – Due to hotter, drier conditions.
Stronger storms & hurricanes – Warmer waters fuel extreme weather.
Ecosystem disruptions – Species must migrate or face extinction.
Human displacement ("Climate Refugees") – Rising sea levels and droughts may force millions to relocate.
Plant and Animal Ranges
There are alot of species shifting towards the North to cooling Temperatures. Warmer conditions allow malaria, Lyme disease, and dengue-carrying insects. Coral bleaching is killing reefs, and fish species.
Melting Permafrost (Arctic Tundra = polar grasslands): CH4 CO2 PFBLoop
Rising temperatures → Permafrost thaws.
Methane (CH₄) and CO₂ are released from decomposing organic matter.
More greenhouse gases = More warming.
More warming = More permafrost melting.
Adjustments to Potential Warming
Expanding forests, create flood control barriers, new coastal housing, cooling shelters, dikes to hold rising sea levels, reduce water waste
Mitigating Global Warming
energy efficiency, low carbon energy, efficent transportation, carbon taxes, carbon capture/ storage, reduce wast, cradle-2cradle, reforestation
Carbon Capture and Sequestration
Removing some CO2 from smokestacks, etc, and converting it into liquid to be pumped under pressure into underground storage sites.
Carbon Markets; Carbon Emissions Trading (Cap and Trade); Carbon Offsets
Carbon credits (permits to emit CO₂) are bought and sold.
Compliance Markets – Government-regulated (e.g., EU Emissions Trading System).
Voluntary Markets – Companies or individuals buy carbon credits to offset their emissions (e.g., airlines offering customers the option to pay for offsets).
Prevention Approaches to Climate Change of the Warming variety:
Cut fossil fuels and go to renewable energy, repair leaky pipes, improve energy efficiency, rescue deforestation, conservative agriculture and logging, taxes on GreenHouse Gases
Dimming The Sun: Big Ideas; Key Scientists
Dimming blocks of the Sun’s UV; Aerosols in the form of ash and soot and sulfate ride the amount of solar energy on the surface (watts/m^2). Beate Liepert, Veerabhardran Reamanahan, Gerry Stanhill
Pan Evaporation Rate
How much water evaporates from an open pan over a given period. It is used as an indicator of climate changes
Atmosphereic Warming
gradual overall rise in the avg temp of the atmosphere over 30yrs or more
Green Land Case Study
One of the most ice dense places that is shrinking from Climate Change→ rising sea levels 7m
IPCC Intergovernmental Panel on Climate Change Conclusions:
Climate change is real
Burning fossil fuels and deforestation increase CC
CC accelerates rising sea levels, ocean acidification, extreme weather and heat waves
Average Temp of the Earth
15 c 58 f
Grean House Gases
N2O- long life and warming
CO2- long life less warming
CH4- less life, mid warming
Something mells
Skunks stuck in yogurt containers
Total CO2 dumped by humans
110 million metric tons
Carnon Footprint largest contributer; per capita largest contributer
US- per person
China- Largest amount
3 most serious envi problems
air pollution, climate change, ocean acidification
Cumulus vs Cirrus cloud
Clouds help cool surface by reflecting sunlight
cumulus- low alt (reflect sunlight)
cirrus- high alt (prevent heat form leaving)
Aersols
tiny particles tha an create clouds
Oceans remove what percent of CO2
25%
Effects of GW
Floods/rising sea levels, more drought, longer heat waves, forest lost and fires, species extinction, can lead to poverty cause of less food
Climate Change Tipping Point
threshold beyond a natural system could change
The Big Melt
Sea ce in the artic melting
Moulins
Ice flows from melting glaciers
James Balog
photographer of Greenland Glaciers- Extreme Ice, Chasing Ice, Vanishing Ice
Effects of Rising Sea Levels
Destruciton of coasts, fisheries, flooding, erosion, flooding of islands
US avg 1m increase while in Bangladesh it is 4m
Ocean Acidification
CO2 + Ocean water = Carbonic Acid (H2CO3) → increase H+ ions in water and decreases Carbonate ions (CO32-), increasing bicarbonate ions (HC3-)
Avg Salinity Increase 1800, 1990
1800: 30% 1990: 15%
Richard Seager and Martin Hoerling
Richard Seager – A climate scientist at Columbia University's Lamont-Doherty Earth Observatory.
Martin Hoerling – A climate scientist at NOAA (National Oceanic and Atmospheric Administration),
Both have researched drought patterns in the U.S. Southwest, including how human-caused climate change is intensifying drought conditions. Soil moisture
Vulnerable ecosystems to CC
coral reefs, polar seas, costal wetlands, high-elevation forests, alpine and artic tundra
IPCC Conclusions of CC effects
Food production will increase in high alt countries, low alt countries will drop in food productionc ause of increase of pests, fisheries deplete
Why is CC hard to Fix?
global, political, effects are different in all parts of the world, proposed solutions are controversal, temp changes are uncertain
Clean-up solutions of CO2
planting trees, biochar into soil, add CO2 in the soil and ocean, collect CO2 from smoke stacks and emissions, iron pills in ocean
Problems with CCS
Carbon capture and storage: only removes part of CO2, from motor transportation and food production is hard, requires alot of energy, can leak at anytime and reach a tipping point
Iceland and CO2
Dissolves CO2 with water and pumps into porus rock to calcite, where it is stored permanently
geoengineering examples to help CC
satellite space sheild, stratosphereic reflective aersol dispersal using high-alt balloons, stratosphere reflective aersol dispersal using jet aircraft, cloud brightening with sea water, iron fertilization promotes carb-absorbing lide, genetically modified trees
Sulfates and Sun
Can reflect too much sun and thin the stratosphere ozone and increase chlorine
Problems with CCS and geoengineering
if new tech does woork people will want to continue brurning fossil fuels, needs alot of power and energy, just moves CO2 to another place, if it leaks its a time bomb
Biosphere 2
4 men and 4 women stayed in a artificial earth with multiple ecosystems and 4000 species, they used waste as fertilizer to grow food but everything went wrong as not enough O2 was produced and insect populations went extinct and killed off plants.
Gov strategies to slow CC
reduce/ regulate CO2 and methane, phase out coal-burning plants, price CO2 emissions
Kyoto Protocol
187/194 countries agree to slow atmospheric warming
Second phase (paris):
-keep avg temp rise below 2c, reduce GHG, meet every 5 yrs to monitor progress
-2017 US drew out
Costa Rica
Net Zero emissions due to 78% energy coming from hydro electricity, and 18% wind and geothermal
Companies that partnered to call for CC to be in legislation
Akoa, Dupont, Ford, Shew Oil, General Electric
Schools with zero net emissions
ASU- largest solar panels range
College of Atlantic- wind turbines
Wash U, FLorida
embedded carbon
carbon released during manufactoring
What percent of GHG needs to be cut to stabalize the atmosphere by 2050
50-85%
Earth avg temp without GHG
0F -17.7C
How do GHG trap heat?
Three colecules minimim, oscillation/asym plus heat = wiggle (dancing molecules)
Argo Floats
floats that float int eh ocean to read slainity and temp
Dr. Josh Willis
Greenland profilers, tubes
Ozone is production
Byproduct of photosynthesis, and convection takes it to the stratosphere
Natural CL source
sea spray
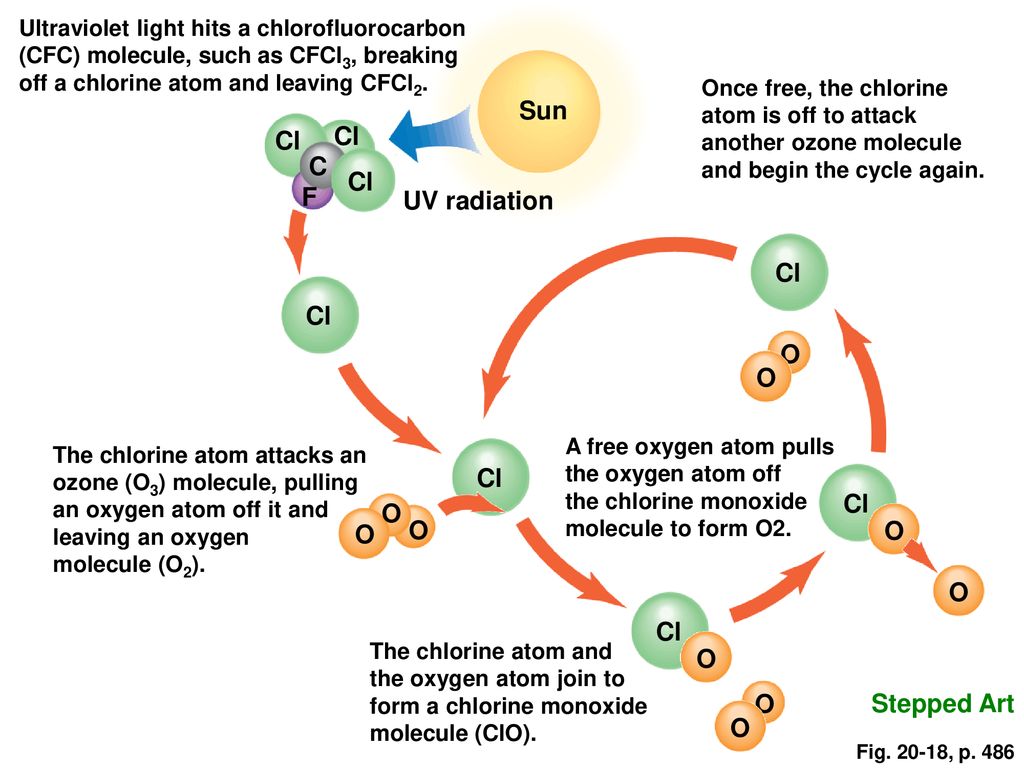
CFCL3 +UV radiation
CL takes one O
Major reasons why Antartica has thinning ozone
Coldest place on earth, polar vortex intensity, ice crystals
Concrete
responsibe for 8% of GHG
-made of Cement, common cement is Clinker that needs alot of heat to make and burns fossil fuel
Thermohaline Circulation
T.C: Ocena currents driven by different wter density due to temp and slainity- transports heat, carbon, dissolved O2, and nutrients
Anthropocene
part of the Holocene in which human activity is dominant on climate and envi
Contribution os Human GHG
CO2- 50-60%
CFC- 15-25%
Methane- 12-20%
Nitros Oxide- 5%
Bjorm Lomborg
Danish author, political scientist, and economist known for his work on environmental policy and climate change. founder of the Copenhagen Consensus Center, prioritizes global problems based on cost-benefit analysis. books The Skeptical Environmentalist and Cool It, argues that while climate change is real, current policies to combat it are often inefficient and costly compared to alternative solutions that could provide greater benefits.
how big is the atmosphereic window?
18-12 micrometers
What Molecules close and don’t close the atmospheric window?
CO2 and H2O don’t close, CFCs close
Earth avg temp increase
1.2 c
How many miles do climate belts increase for every 1c
100-150km
Evidentary Categorist from global climate change
Global temp rise, warming oceans, ocean acidification, skrinking ice sheets, decrease snow cover, sea level rise, declining artic sea ice, extreme temp and rainfall, glacial retreat
ex: Bakersfeild, CA; river bed; decrease snow cover, temp rising
Impacts of microorganisms and CC
nitrogen-fixing bacteria in soil have decreased, as well as bacteria in prominent roles in cycling and decomposition
CC ecosystem impacts critical zones
Critical zones: treetops, bottom of ground
E.O. Wilson The little Things
I turned to the teeming small creatures that cna be held between the thumb and the forefinger; the little things that compose the foundation of our ecosystems, the little things, as I like to say, who run the world.
How much has the avg temp increased in the last 100yrs
0.8C 1.4F
How much carbon do oceans absorb
30%
Total US GHG Emoissions by Econ sector
Transportation: 29%
Electricity: 28%
Industry: 22%
Residential: 12%
Agriculture: 9%
How much of the ocean pH been reduced from the start of the industrial revolution?
30%
NASA’s Gravity Recovery and Climate Experiment (GRACE)
Satellite showed Greenland lost 268 billion tons of ice, and Antartica 127 billion tons
Glacial Retreat
24m slice off the toop of an average glacier
Decreased Snow Cover 1972-2015
8,550km² of snow cover- 98% of snow cover is in the northern hemi