Geography
1/18
Earn XP
Description and Tags
social studies
Name | Mastery | Learn | Test | Matching | Spaced | Call with Kai |
|---|
No analytics yet
Send a link to your students to track their progress
19 Terms
tropic of cancer and capricorn
are lines of ( ) that are the most ( and ) circles where the ( ) can be directly over head at the ( )
capital of Austrailia
Canberra
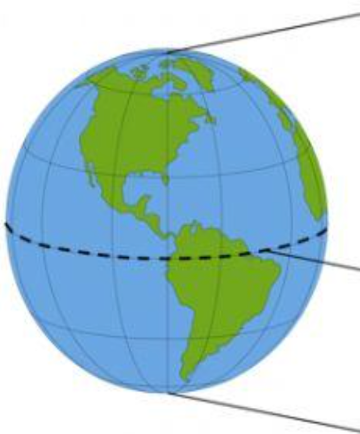
Describe the path of the International Date Line
The international dateline follows closely to the 180 degree longitude line. It passes through an island from Russia and the state of Alaska making it 3.8 km apart. The path continues off and passes through many small islands in the Pacific Ocean.
Why does it follow this path
It follows this path close to the 180 degree because there are many small islands in that area of the Pacific Ocean. The line is not completely straight because surrounding countries are able to decide the date and the hemisphere. The dateline is used to separate the Eastern and Western hemisphere from one another which helps divide each countries time zones. |
When did they “draw” the International Date Line? Why did they decide to “draw this?
They drew the international date line in the year 1884. They made it to divide when the sun sets and when the sun rises. This was also made to help travelers moving to and from the Eastern and Western Hemisphere. |
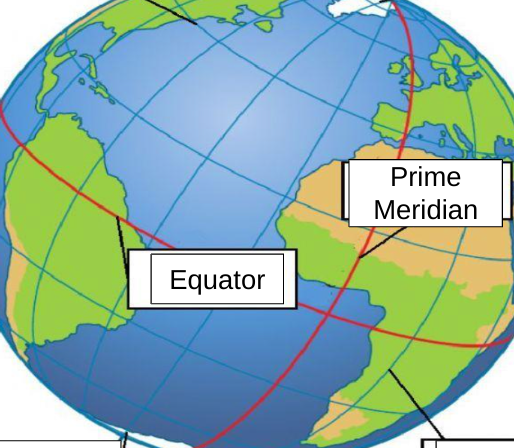
Vertical lines
longitude lines with the prime meridian known as the zero of longitude. This vertical zero line runs from the north pole to the south pole and through Greenwich England
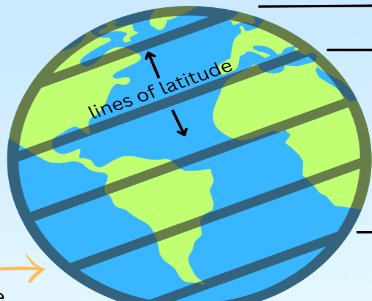
Horizontal Lines
Lines of latitude run east to west with the equator known as the zero of latitude.
Physical map
Physical maps are maps that show
the physical features of an area, like
rivers, lakes, oceans, mountains,
deserts, and other landforms. Physical maps
might also show borders or cities. But not it’s focus
Political Map
Political maps show the borders of
a country, state or county. They
also show cities. Political maps
might also show major physical
features (like a major river or an
ocean) But no the focus
Relief Map
Relief maps are a type of physical map that
uses shading and colors to show the elevation
of the land (mountains and valleys) in a way
that makes it visible in 3D instead of using
contour lines.
Contour Map
Contour maps are black-and-white maps that
use lines and white space to show the
elevation of the land. Lines that are closer
together indicate higher elevation (like
mountains). These are more commonly used
by professional geographers and scientists.
Thematic Maps
Thematic maps are maps that are
used to illustrate information or
statistics about a specific topic, like
population density, climate, rainfall,
common illnesses, political voting
patterns, and more. If you can find
statistics on a topic, you can create a
thematic map!
Historical Map
Historical Maps show us patterns that existed in particular eras in history.
For example, this one shows when schools were segregated.
Road Maps
Road Maps are used to navigate streets
and highways between towns, cities, and
other destinations. Even though we use
smart-phone GPS maps more often now,
the ability to read a paper map or road
atlas is an important life skill.
topographic Map
for hikers to show elevation and man made features.
Inset Map
Zoomed in a particular area of a large map