Review- Chapter 7 Statistics
1/14
Earn XP
Description and Tags
Name | Mastery | Learn | Test | Matching | Spaced | Call with Kai |
|---|
No analytics yet
Send a link to your students to track their progress
15 Terms
Sampling Distribution
answers the question: HOW would my summary statistic behave if I could REPEAT the process of collecting data using a random sample?
often approx. normal
resonable likely outcomes: fall WITHIN 2 SE of the mean
middle 95%
Describe: center, shape, spread
does not show how the sample is distributed around the sample mean
a distribution of sample means, not individual values of sample mean s
Rare event
lie in the outer 5% of a sampling distrubtion
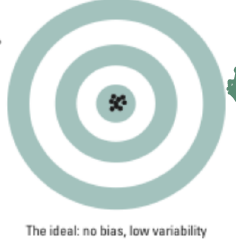
Unbiased estimator
mean of a sampling distribution=population parameter →”unbiased estimator of the parameter”
center is accurate
mound shape, not skew
Good estimator
unbiased and low variability
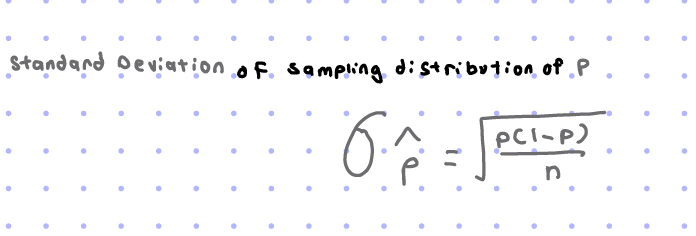
Standard Error (SE)
the standard deviation of a sampling distribution
increases for samples similar to the population
decreases as n increases because n and o are inversely proportional σp̂ =√(p(1-p))/n, p̂ being the sample proportion
STEPS-approximate or simulated sampling distribution
Take a random sample of a FIXED size(n) from a population
compute a summary statistic
repeat steps (1, 2) many times
display the distribution of the summary statistic
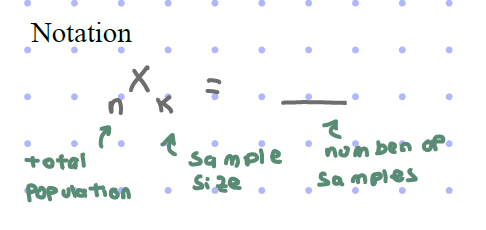
*notation
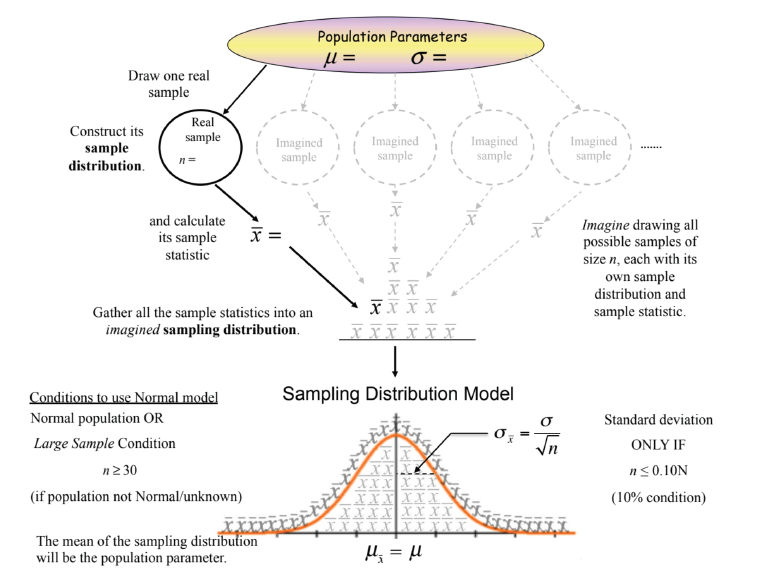
Sampling distribution of the sample mean
For ANY sample size(b), the sample mean is an unbiased estimator of the population mean
the distribution of sample means becomes less spread as the sample size increases
If a random sample of size n is selected from a distribution u and σ…
ux̄ =u
σx̄ =σ/√n
Central Limit Theorem(CLT)
Sampling distribution becomes MORE normal as the sample size gets larger
The sampling distribution of mean is normal if conditions are met, even if the population shape is not normal or unknown
Determines if outcomes are reasonably likely or not
Implications
larger sample size(n) →narrower graph, more normal shape, less spread
the population can be ANY shape if n>= 30 → use a sample to model using approximately normal distribution
Conditions for mean
Independence assumption
randomization condition
10% condition- the sample size is not more than 10% of the population
Large enough sample condition(n>30)
Conditions for proportion
*all same expect 4
large enough sample condition
np>= 10 →at least 10 success
n(1-p)>=10 →at least 10 failures
Sampling distribution of the SUM of a sample mean
If a random sample of size n is selected from a distribution u and σ…
usum=nu
σ sum=√nσ
Graphing - Sampling distribution of means
Larger sample
→ more mound-shaped and “normal”
→ x axis less spread out
Max: skew left
min: skew right
median: narrow
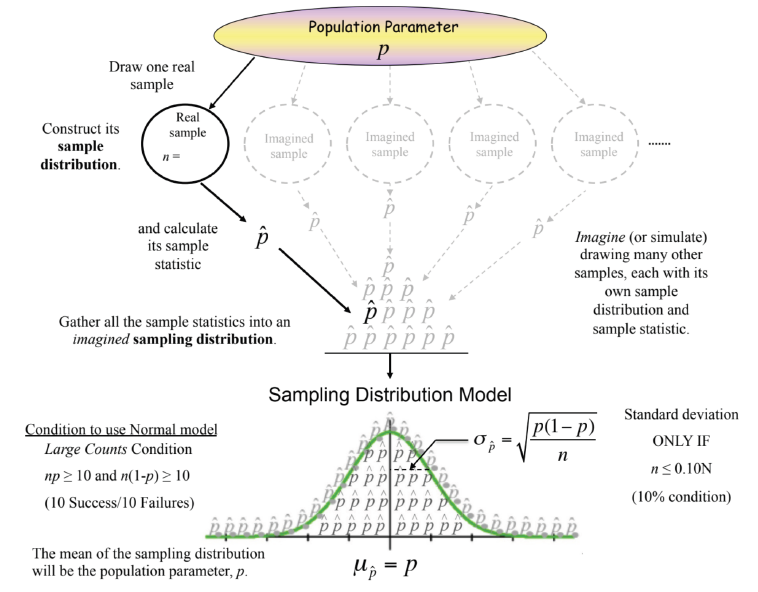
Sampling distribution of a sample proportion
for any sample size(n), sample proportion=unbiased estimator for the population parameter
distribution of sample proportions, less spread out as n increase
CLT
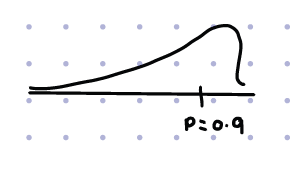
further p is from 0.5→ larger n required to achieve a normal approximation
*binomial experiment
up̂=p, p being the population proportion
σp̂ =√(p(1-p))/n, p̂ being the sample proportion
for any size n, up̂ =unbiased estimator of p̂
increasing n→ reduce variability and bias not related
Sampling distribution of the SUM of a sample proportion
usum=np
σ sum=√np(1-p) ← standard error
σ sum=np(1-p)← standard deviation
P
probability
can draw a graph to show a middle center point for the sample proportion mean
always symmetrical if p=0.5
always unimodal(bc a binomial distribution)
n
Sample size
larger sample size(n)
→smaller spread in the sampling distribution
→ more it will show the distribution traits of the WHOLE population→ more like population graph
→ can or may not be more normal, depending on pop. graph
formula x=
x=u+-Zσ