Aqa a level physics paper 3 A
1/72
Earn XP
Description and Tags
AQA A-Level physics paper 3A
Name | Mastery | Learn | Test | Matching | Spaced | Call with Kai |
|---|
No analytics yet
Send a link to your students to track their progress
73 Terms
What should the range of the independent variable will be?
As large as possible, whilst still being safe to carry out the experiment
What is the experimental range?
The set of values for which the conclusion/trend/values are valid for
What should the interval of the independent variable give?
At least five values for the dependent variable
How should you approach a question that asks you to write an experimental method to derive a particular value?
Identify independent and dependent variable, state how each variable will be measured, state the range and interval of the independent variable.
Identify control variables and how they will be controlled. Identify any way the experimental technique can be modified to reduce uncertainty. Discuss carrying out repeats and measuring averages
State the graph that would be drawn and then put experimental equation in form Y = mx + c and calculate the wanted value
Also use a clear labelled diagram
How long should you repeat until?
Concordance is achieved - consistent results to reduce random error
Exam feedback on how to get full marks
Students should be encouraged to describe how to change one variable and to give suitable ranges of values as well as specifying how many sets of results to take.
It is also expected that students will describe graphical methods of processing results, including, where relevant, the significance of intercepts and gradient.
To gain credit for suggesting repeating measurements, students must be specific about which readings are repeated and they must mention the averaging of those measurements
Examiners insisted on seeing that the dependent variable was read measured or recorded
What should you consider for any practical?
How extra results could be taken and used?
Consider how to measure values accurately.
Be specific to the experiment about the error and the correction.
Consider how percentage uncertainty could be reduced.
Consider how to control control variables
What's six things should you consider when analysing or evaluating experimental results?
What patterns are shown in the experimental data?
Was the experimental data valid and precise?
How accurate is the experimental value measured?
Is the resolution of the measuring instrument high enough?
Is there any anomalies and what has caused them?
How large is the percentage uncertainty and the percentage difference.
What is the difference between systematic and random errors?
Systematic errors cause the same uncertainty on the experimental results. Random errors caused different uncertainty on the experimental results. Both affect accuracy however random also affects precision.
What are two ways you can reduce percentage uncertainty?
Use a larger value for experimental results or use a measuring device with a greater resolution
What is the graphical impact of a systematic error ?
It changes the intercepts of the graph
What is the graphical effect of a random error?
It changes the intercepts and gradient of the graph. Also makes the line of best fit difficult to plot.
How do you reduce systematic errors?
Instruments should be recalibrated, or different instruments should be used. Corrections or adjustments should be made to the technique.
How do you reduce random errors?
Carry out repeats until concordant results are achieved, remove anomalies and calculate mean
What are the reasons for systematic errors?
The way in which measurements are taken,
Faulty measuring devices
What are the reasons for random errors?
Factors are not controlled in the experiment.
The difficulty in deciding on the reading given by a measuring device
What is the resolution of a measuring device?
The smallest division on the measuring scales, e.g. 1mm for a ruler with mm divisions
What is the difference between repeatable and reproducible?
Measurements are repeatable when similar results are
obtained from by students from the same group using the
same method.
Measurements are reproducible when similar results are obtained by students from different groups using different
methods or apparatus.
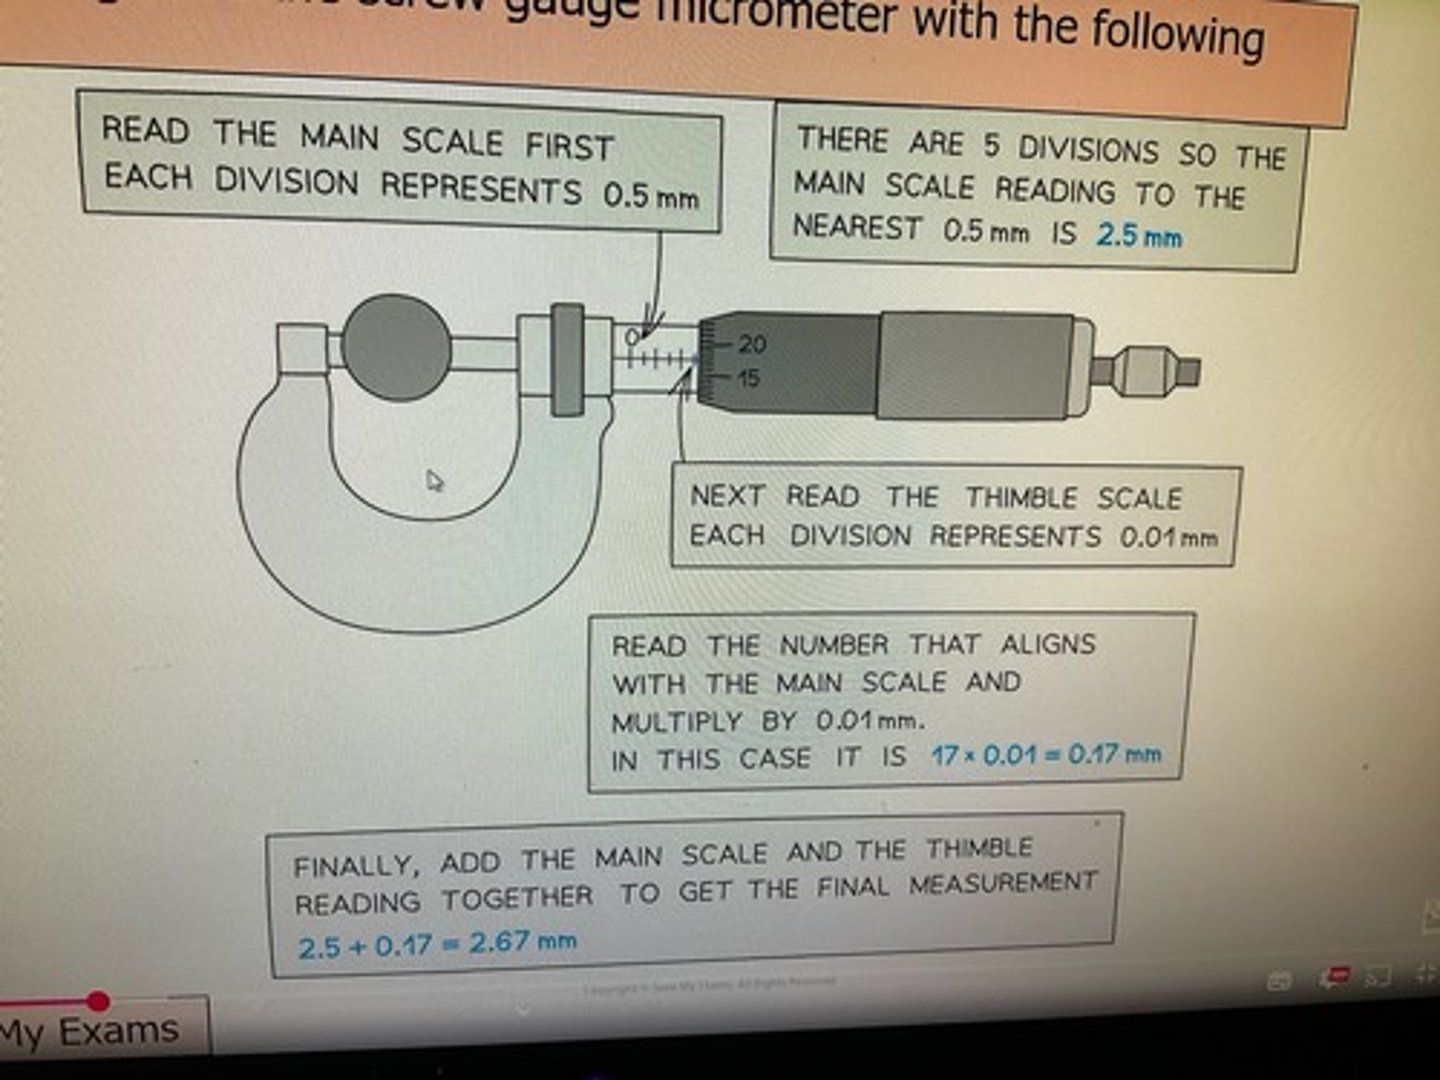
How do you read a micrometre?
Read the main scale first where each division represents 0.5 mm then read the fumble scale each division represents 0.01 mm. Read the number that aligns with the main scale and multiply it by 0.01 mm. Finally add the main scale and the thimble scale reading together.
How do you calculate zero error of a micrometre?
By tightening it with nothing in between the jaws and ensuring that it says zero if not then calculate zero error
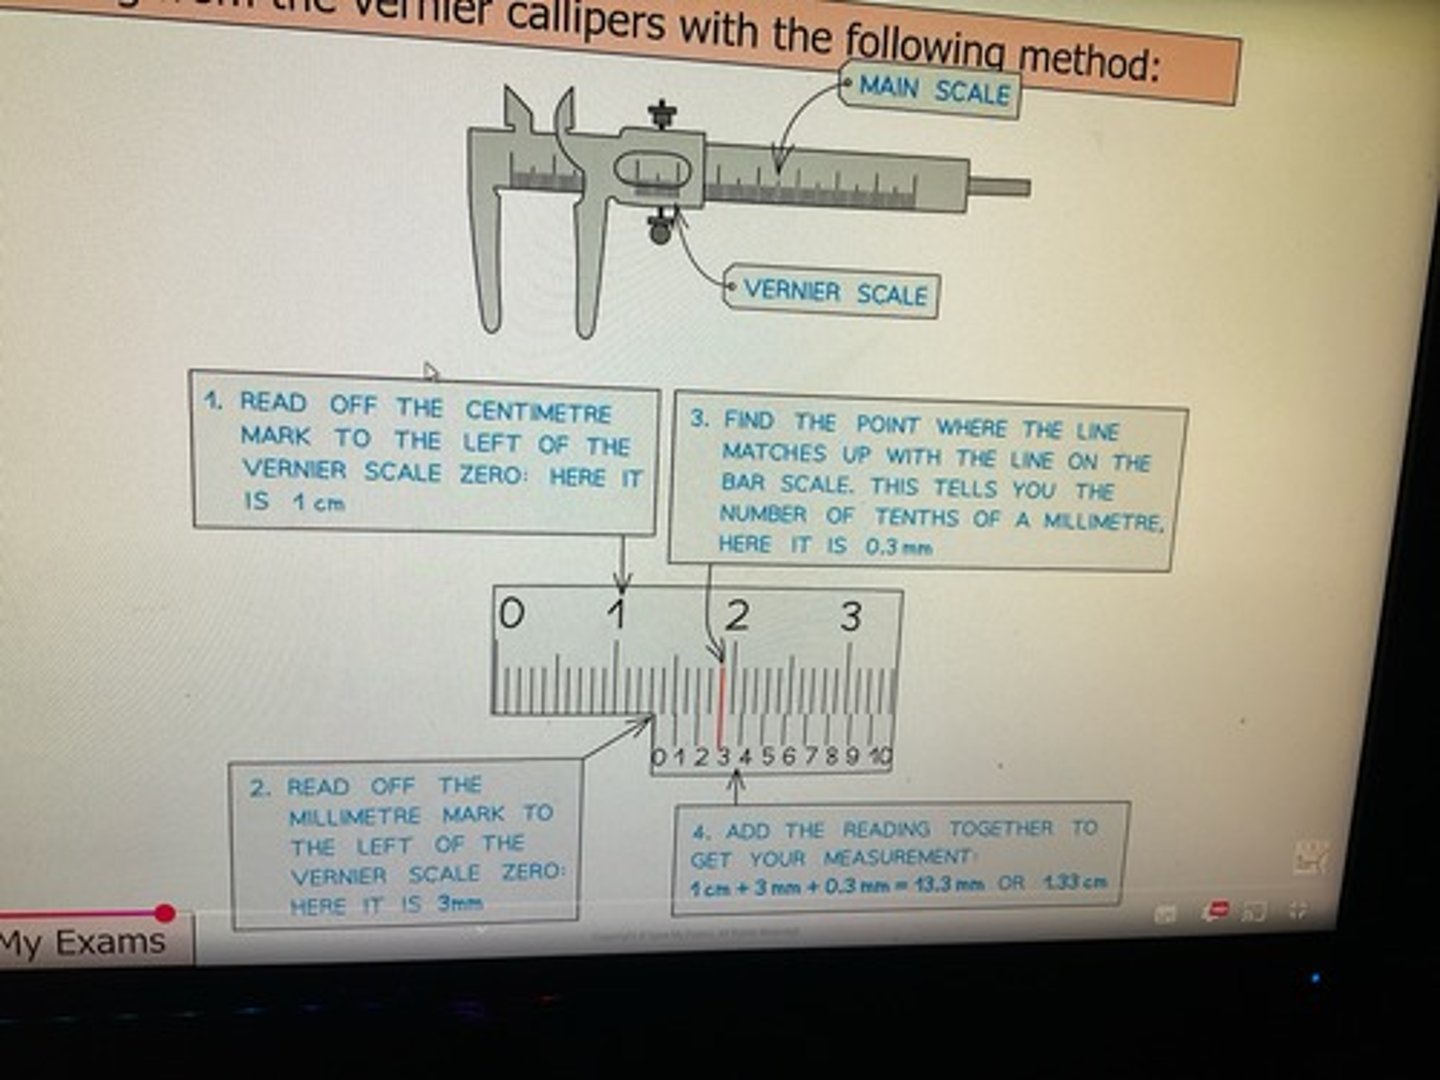
How do you read a Vernier caliper?
Read off the centimetre mark to the left of the Vernia scale zero. Read off the millimetre mark to the left of the Vernier scale zero. Find the point where the line matches up with the line on the bar scale telling you the number of tenths of a millimetre. Add together.
When would you use a caliper over a micrometre even though the micrometre has a better accuracy?
It is easier to take many measurements with a caliper
Good and bad about analog metres
They are useful as it is easy to see a change on these devices and you can change the scale easy. However, they introduced parallax error
What is the full scale deflection of an analogue meter
The full range of values
What would happen if the full scale deflection is too large?
The measuring device is not sensitive enough to accurately record the results
What five things must be considered when addressing uncertainty?
The resolution of the instrument.
The manufacturers tolerance on the instruments.
The judgements that are made by the experimental.
The procedures adopted - e.g. repeated readings.
The size of increments available
What are four ways of measuring absolute uncertainty?
Calculating uncertainty due to the measuring device used
Calculating uncertainty due to experimental technique.
Calculating uncertainty stated value given.
Calculating uncertainty due to variation in readings
What is the difference between a reading and a measurement?
Readings are when one value is found, measurements are when the difference between 2 readings is found
What is the uncertainty when using an instrument to take a reading
Plus or minus half of the smallest division
What is the uncertainty when using an instrument to take a measurement?
The same as the smallest scale division as you take two reading
What should you calculate for the uncertainty due to experimental technique?
You should estimate the value of uncertainty if you think it is larger than the scale division. This could be human reaction time for a stopwatch or non perfect voltmeters / ammeters etc
How do you calculate uncertainty due to the stated value given?
You assume the uncertainty of a given value on a data sheet to be plus or minus one in the last significant digit.
Charge of e given as 1.6x10¹⁹ so ±0.01×10¹⁹
How can you calculate uncertainty due to variation in readings?
The uncertainty is the range of measured values divided by two
How do you get percentage uncertainty if you have repeated measurements?
Divide absolute uncertainty by the mean value and times by 100
What do you do to uncertainties when adding or subtracting a value?
You add the absolute uncertainties
What do you do to uncertainties when multiplying or dividing?
You add the percentage uncertainties
What do you do with uncertainties when you have exponent?
Multiply the percentage uncertainty by the exponent
What does inverse proportionality look like on a graph?
The curving line going downwards similar to an A/X graph
What are the values of the constant for direct and inverse proportionality?
Direct: y = kx so k = y/x
Inverse: y = k/x so k = yx
How do you get the value of the constant for direct and inverse proportionality
For direct proportionality, if the terms in the data that are divided they should give the same value of constant.
For inverse proportionality if the terms are multiplied they should give the same value of the constant
What should you make sure to do when calculating the gradient of a graph?
Show the triangle that you use to calculate
Why does increasing the size of the gradient triangle lead to more reliable results
As more values are considered
What facts can help you derive an equation from the gradient?
For the equation of a line y = gradient x X
So for example force mass
Force = gradient x mass
So gradient must be acceleration as f = ma
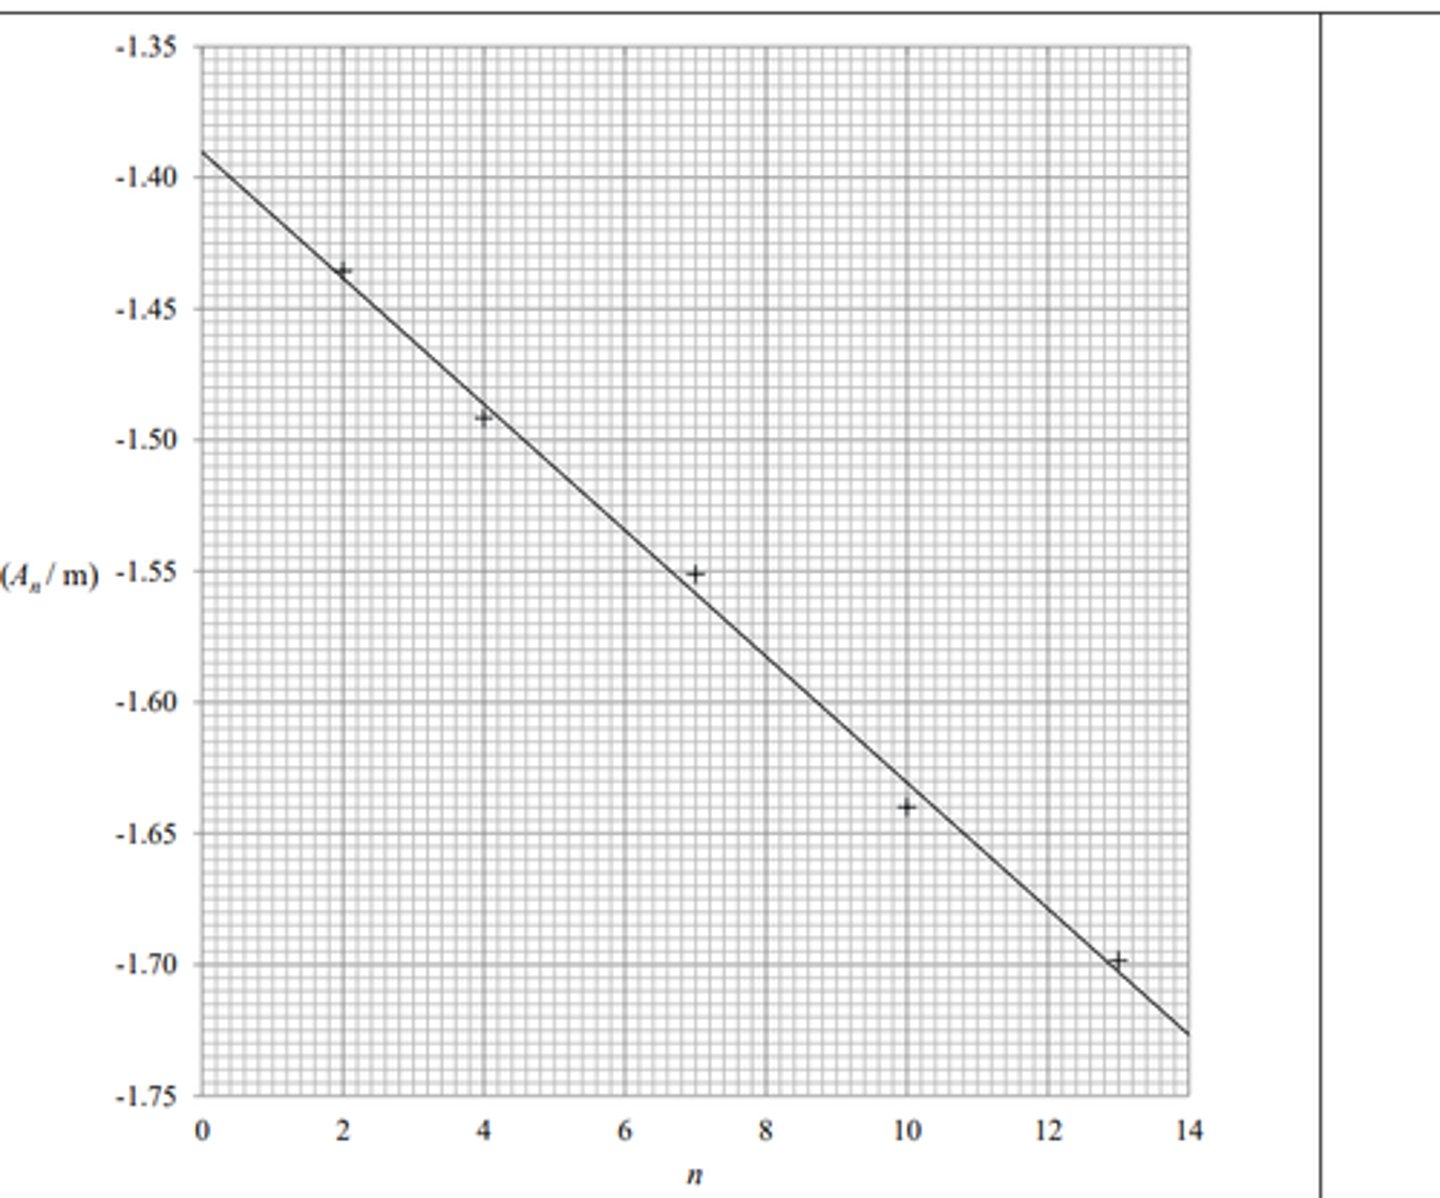
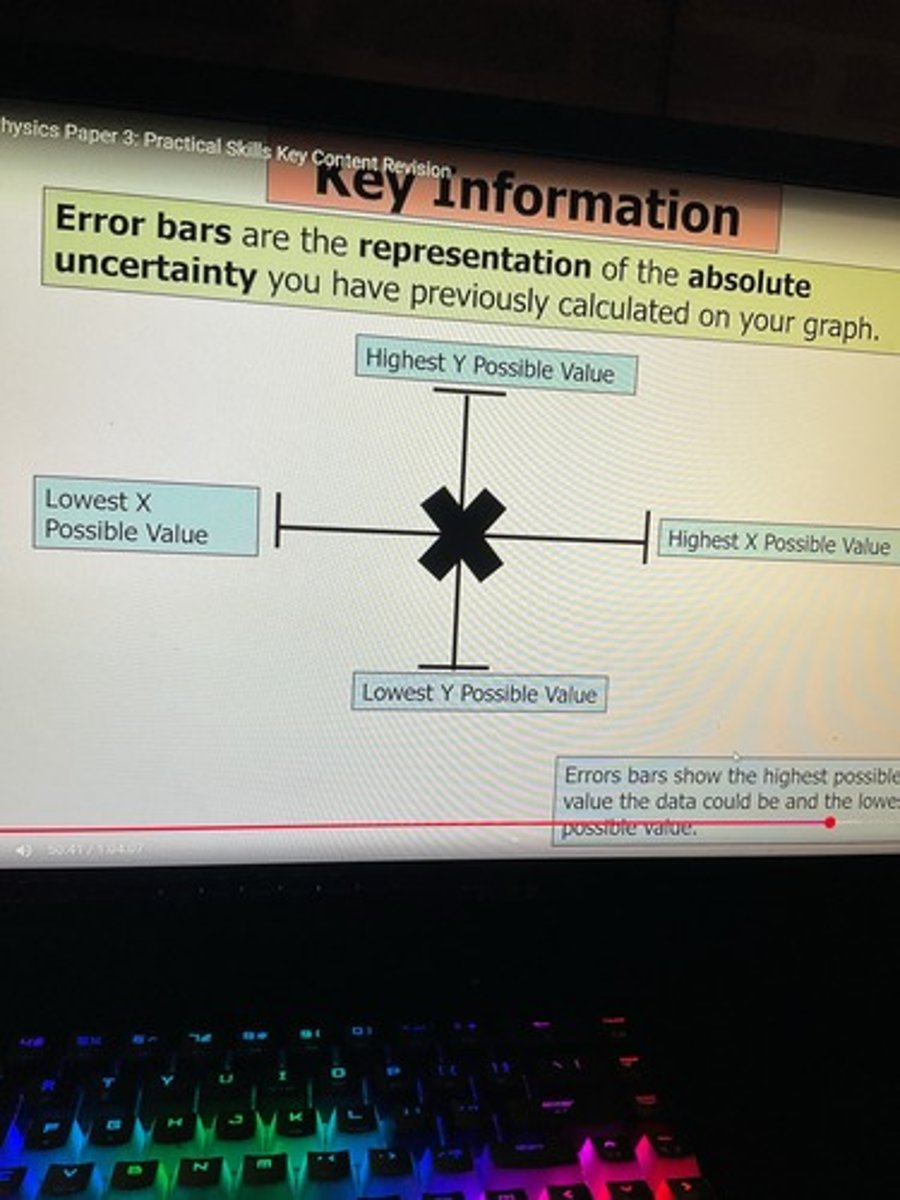
What are error bars?
A graphical interpretation of uncertainty
Should be drawn for both X and Y values?
How can you identify an outlier using error bars?
Any point that does not lie within the best fit line with error bars
How can you use error bars to calculate percentage uncertainty
Draw the worst lines of best fit that lie within the error bars. The percentage uncertainty is the difference in the gradient of the worst and best line of best fits divided by the gradient of the best line of best fit
How can you use Y intercepts to calculate the uncertainty?
The difference between the two worst Y intercept is divided by two is the absolute uncertainty
How do you draw the worst line of best fit?
From the bottom of the bottom error bar to the top of the top error bar
What is thelength of an error bar?
Double the absolute uncertainty
mass per unit length of standing wave method
Mass per Unit Length for Standing Waves on a String
Find the fundamental frequency of a length of string, i.e. the frequency which produces a standing wave of just one antinode (half a wavelength.) Very the length of string with fixed tension between two wooden bridges between 1m and 0.5m.
Plot graph of 1/f vs I, this gives gradient of 1/fl and as c=f^ and A=2l, c=2/gradient.
Compare your value for wavespeed with a value calculated from c=(T/m), (m is mass per unit length), by measuring mass of string per unit length with an electronic top pan balance and a metre ruler.
Repeat with varying tensions, and for different harmonics.
Youngs double slit method
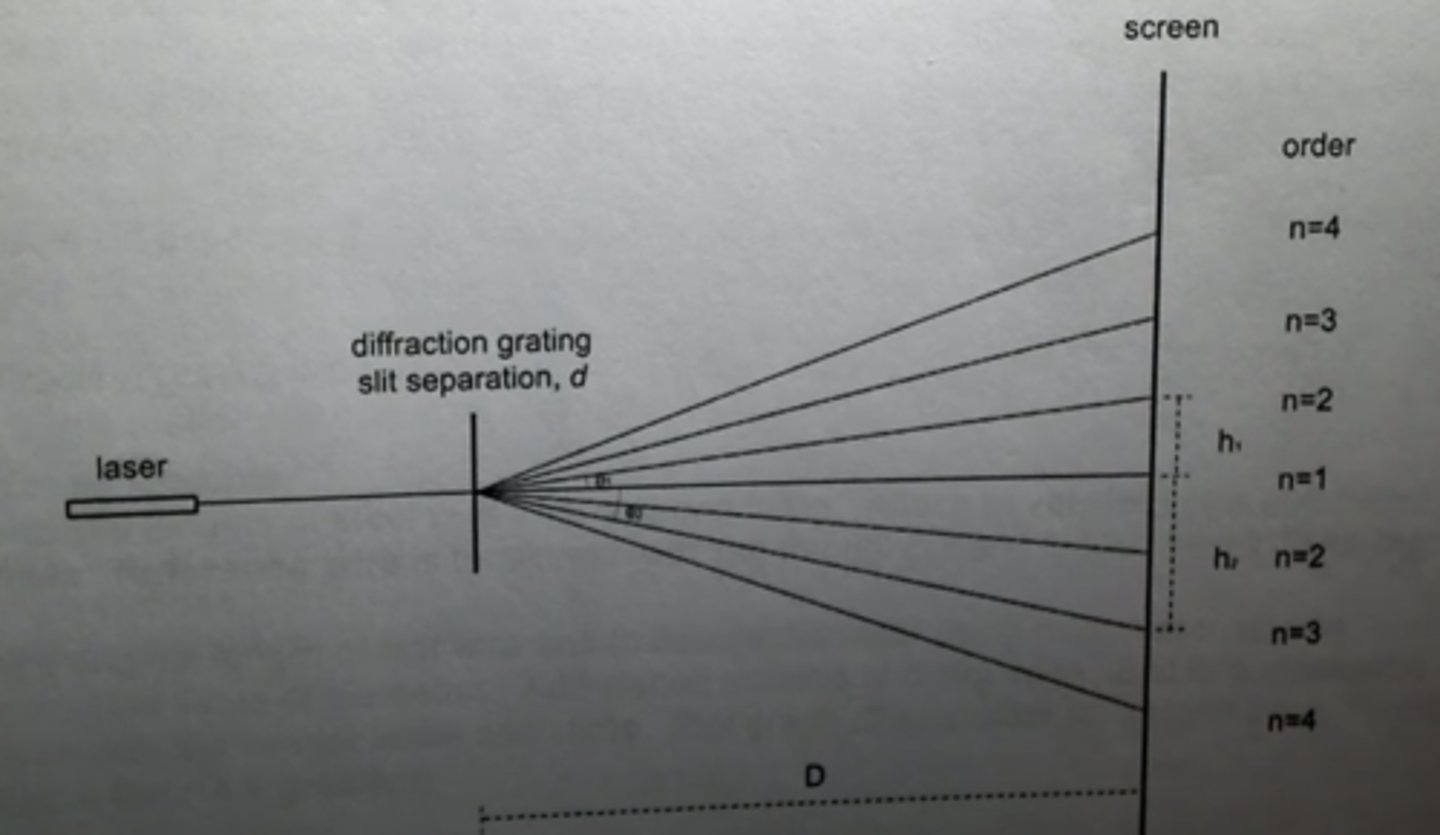
Young's Double Slits and Diffraction Gratings
Produce an interference pattern on a screen and measure distance to the screen and fringe width. This will be small for the larger separation of the slits in double slit experiment and larger for the smaller separation of the bars in the diffraction grating.
For double slit experiment use calipers and measure across the whole interference pattern and divide by number of fringe widths. Minimises percentage uncertainty.
For diffraction grating width is likely to be large enough to measure accurately with a ruler. Use equation ^=w/D to calculate wavelength, or vary D and plot w vs D, gradient is Ns. This method uses the small angle approximation.
For diffraction grating measure distances from zero order to each subsequent order maximum and use tan (h/D) to calculate an angle e for each maximum. Use ni=dsin® to calculate the wavelength of light.
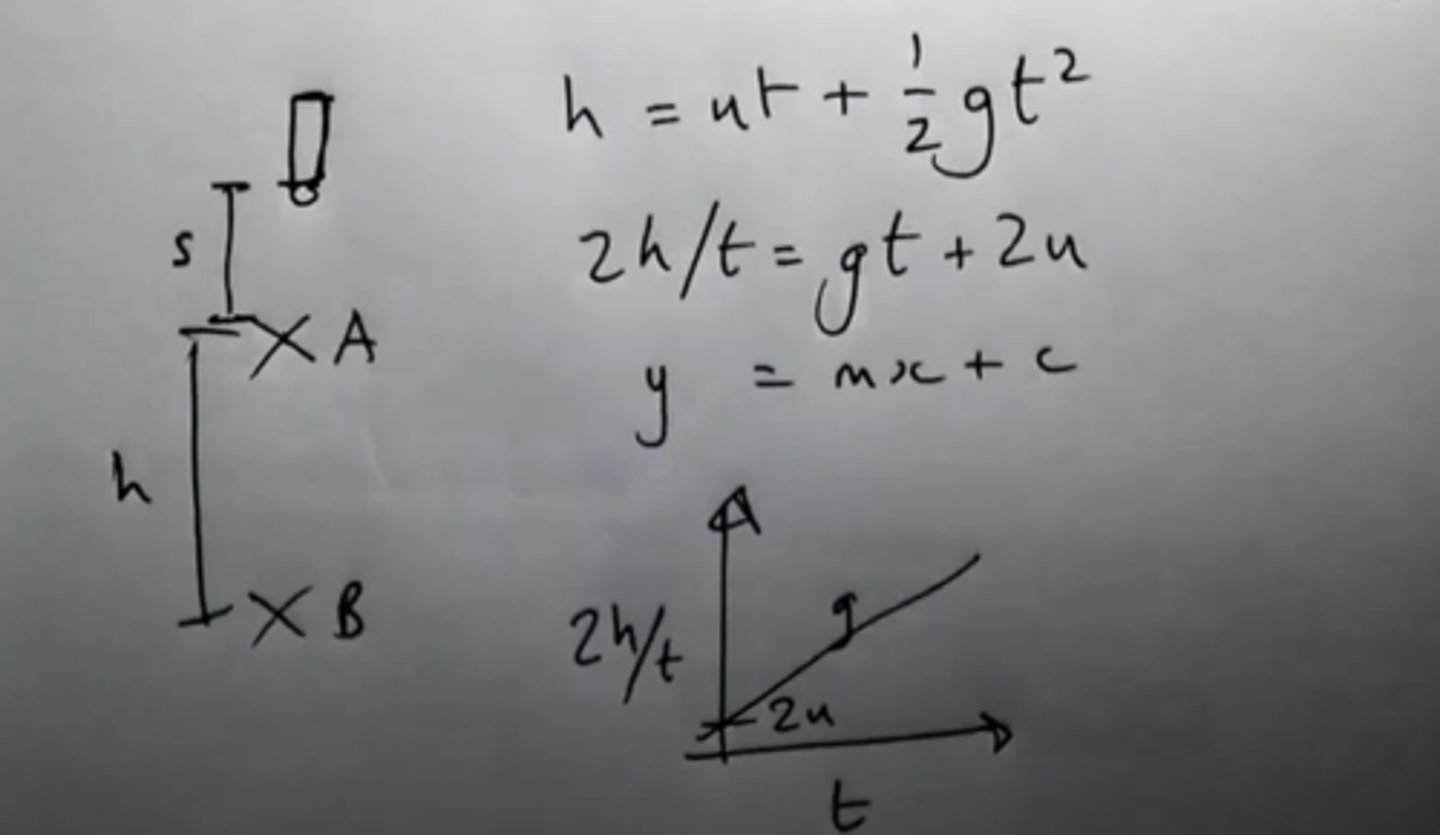
g by free fall method
Release a ball bearing (from an electromagnet), measure time using a pair of light gates for ball bearing to fall a distance h measured with a metre ruler.
Keeping distance from release point and upper light gate constant, vary h and measure
t. Take repeats, discard anomalies and calculate a mean.
Using equation of motion h=ut+gt‹/2 rearrange for 2h/t=gt+2u (y=mx+c). So graph of 2h/t vs t gives gradient of g and y intercept 2u. This is a clever way of not having to measure initial speed.
we need U, where the ball passes through light gate a to be a constant so we have a set distance from the electromagnet
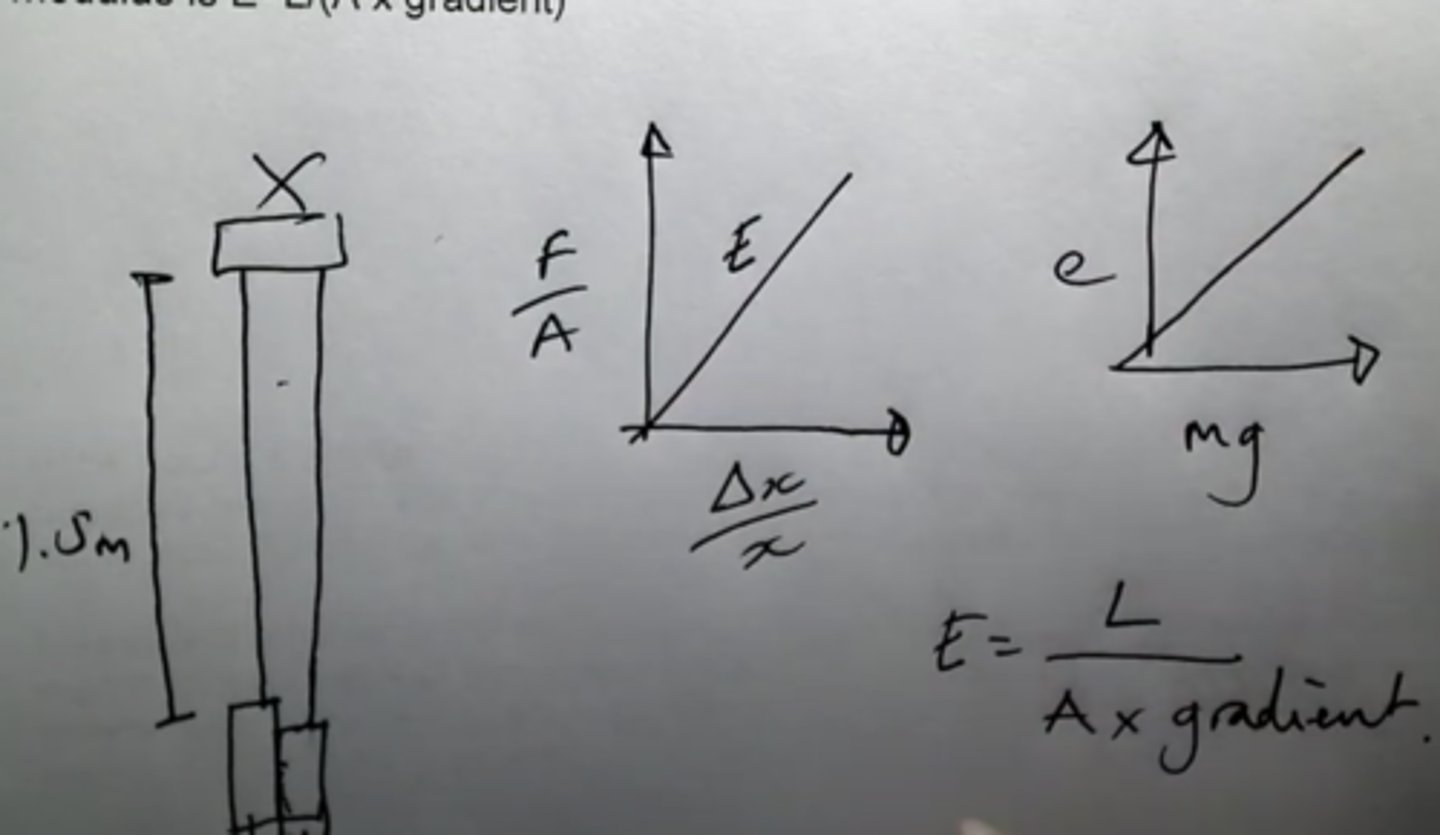
young modulus method
Suspend two lengths of steel wire from a strong fixing. Attach to vernier scale and clamp apparatus. Reference wire is tensioned with 1kg throughout and loaded wire initially 1kg.
Measure original length of test wire and (measure diameter using micrometer or) use manufacturers value of diameter. Add slotted masses of 0.5kg each up to 8kg measuring extension with the vernier scale each time. Plot graph of extension (e) vs load (mg), Young modulus is E=L/(A x gradient)
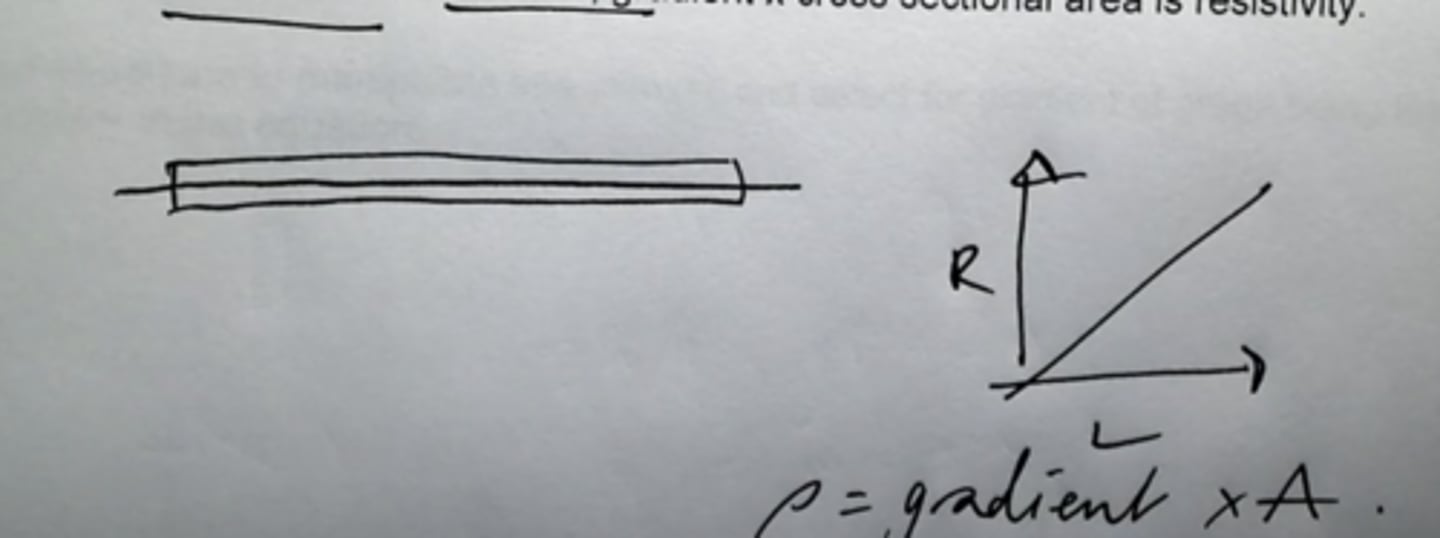
resistivity method
Measure p.d. with a voltmeter in parallel with and current with an ammeter in series with a length of wire stretched across a metre ruler such that you can vary its length.
Measure diameter with a micrometer in several places, find the mean diameter.
Calculate R using V/l, plot R vs L, gradient x cross sectional area is resistivity.
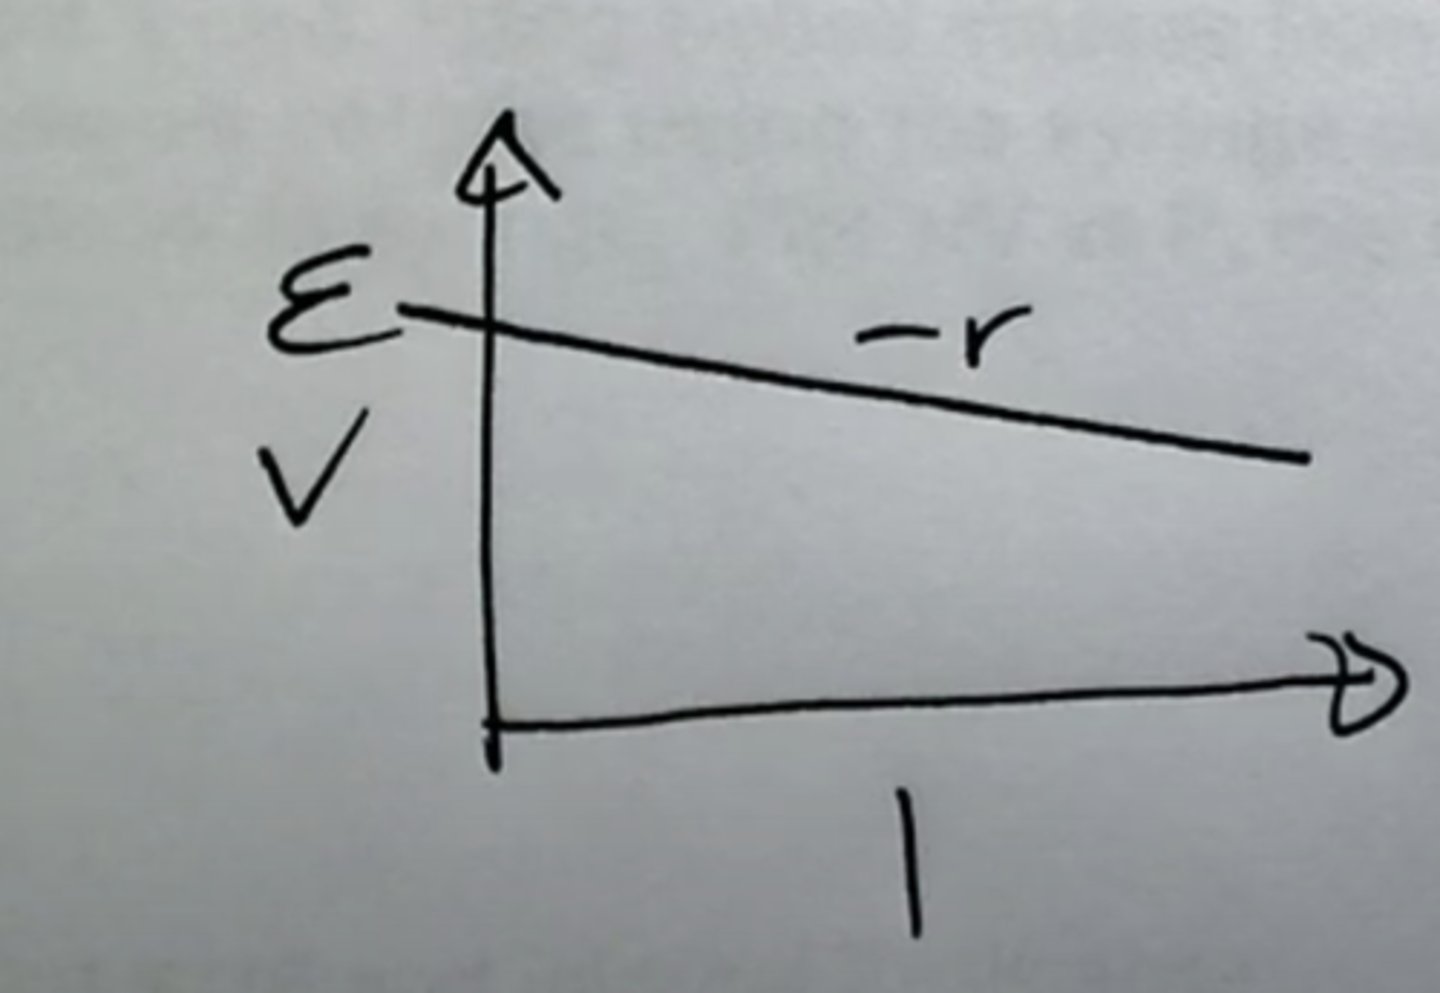
internal resistance method
Measure the terminal p.d. with a multimeter in parallel and the current with an ammeter in series with a cell. Vary the load resistance using a variable resistor. Plot p.d. vs current.
Internal resistance is the gradient and EMF is the y intercept. No need for repeats as heating can cause systematic error, leave circuit on for as little time as possible to avoid battery energy changing and affecting EMF or heating effect of current.
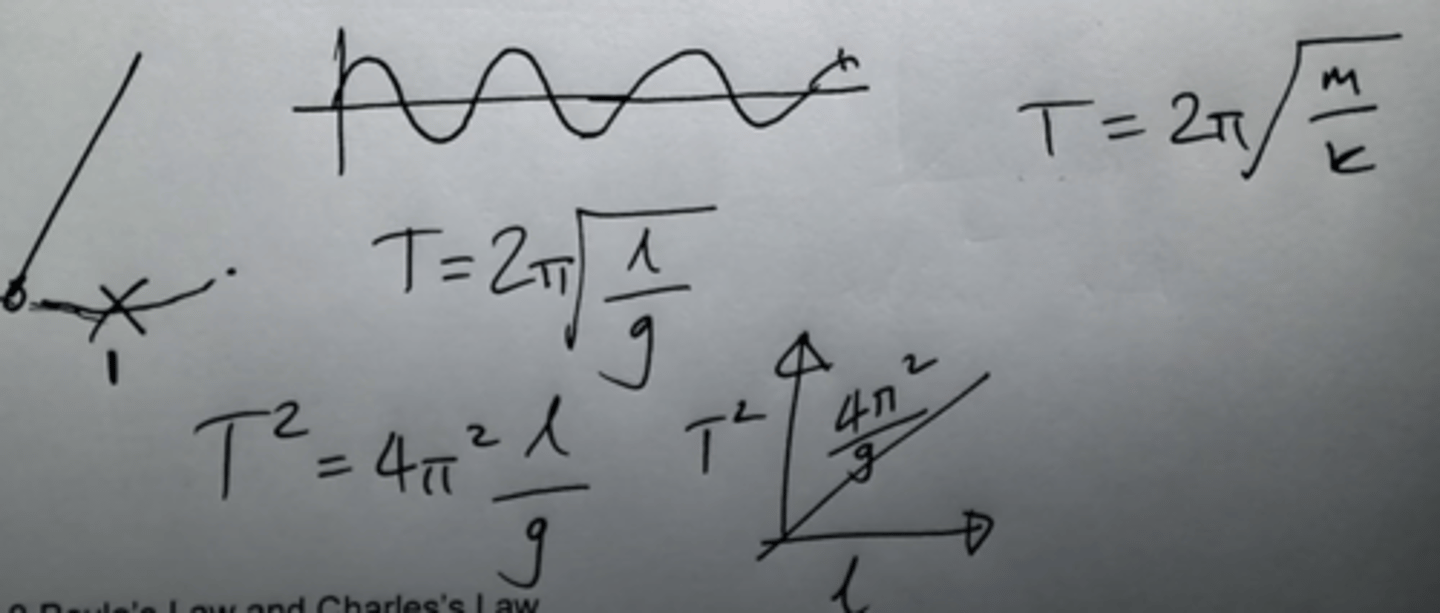
shm for pendulums and mass spring method
Measure time period of either a pendulum or a mass on a spring with a stopwatch using a fiducial marker, time ten full swings to minimise percentage uncertainty. For shorter periods of oscillation use data loggers with either an ultrasonic position sensor or a light-gate to measure the time period. Vary length of pendulum, vary either mass or spring constant for the mass-spring system.
Use equations to manipulate into y=mx+c and select for gradient of graph being the other constant in the equation.
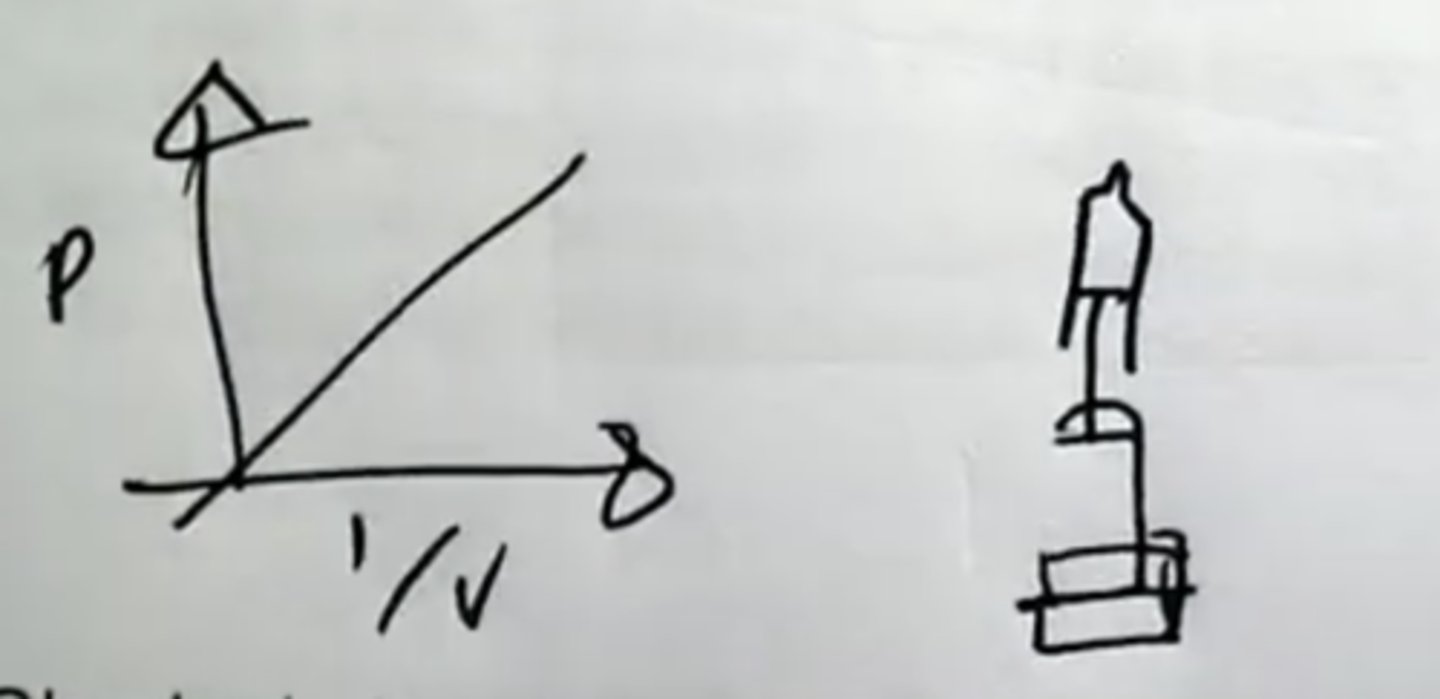
Boyles law method
Boyle's Law: Hang slotted masses from a sealed syringe, calculate pressure using F/A, measure volume using the syringe scale. Take F/A from atmospheric pressure to give pressure in syringe. Plot 1V vs P, this should give a straight line.
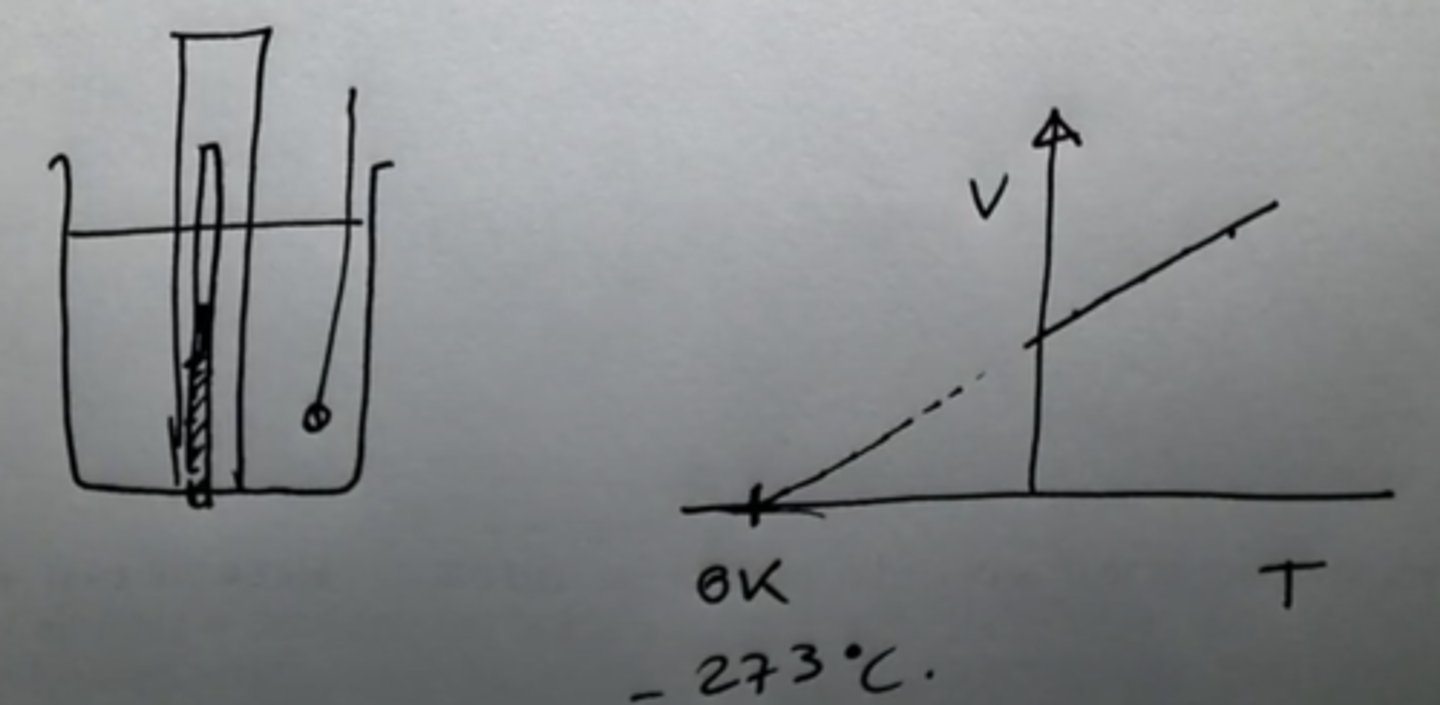
Charles law method
Use air sealed in a capillary tube attached to a ruler to measure the length of a column of air (this is proportional to the volume of air). Vary the temperature by submerging in heated water, measure temperature using a thermometer. Plot length vs temperature, x-intercept gives absolute zero, (by extrapolation of line, or by substituting y=0 into y=mx+c.
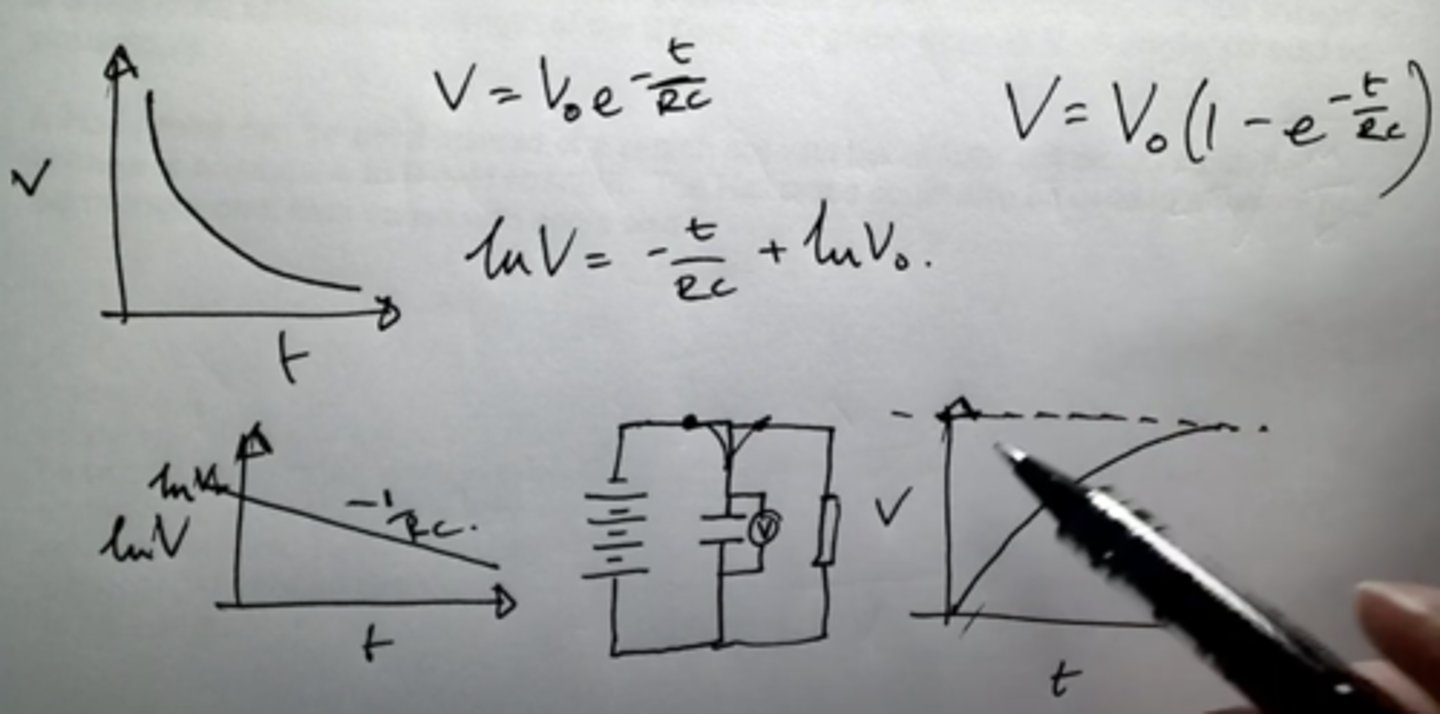
charging discharging capacitor method
Measure p.d. with a voltmeter in parallel with a capacitor and current with an ammeter in series with it as it charges and discharges through a resistor. Challenge is measuring a time base accurately, stopwatch is appropriate for large values of capacitance and resistance, chose R and C values to give time constant (RC) in range 10s to 500s. Readings every 5 or 10 seconds should be sufficient. Plot p.d. vs time and current vs time, should be exponential decay curves. Also plot InV and In vs time, should give straight lines. Charging is also an exponential decay.
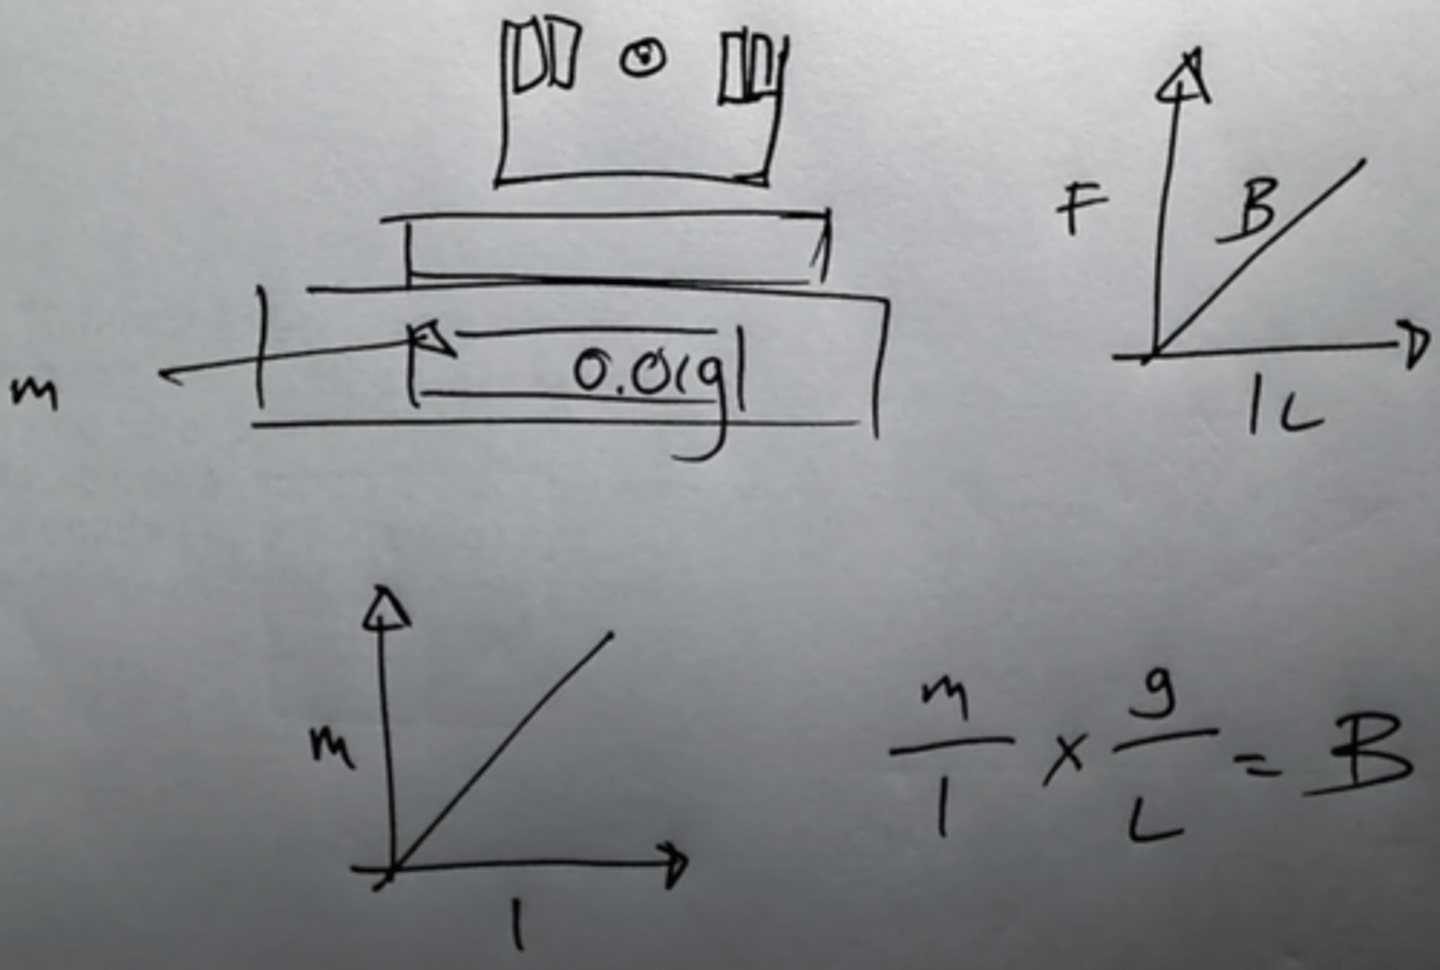
motor effect , f=bil method
Use a top pan balance to measure the force on a magnet due to proximity to a current carrying wire, by measuring an apparent mass, m, on the balance. Vary current using a variable power supply or variable resistor. Repeat for each value of current, (or use many data points,) spot anomalies and calculate a mean m. Plot m vs I, gradient x g/L gives B.
The equation F=BIL becomes mg=BIL, m/l x g/L = B
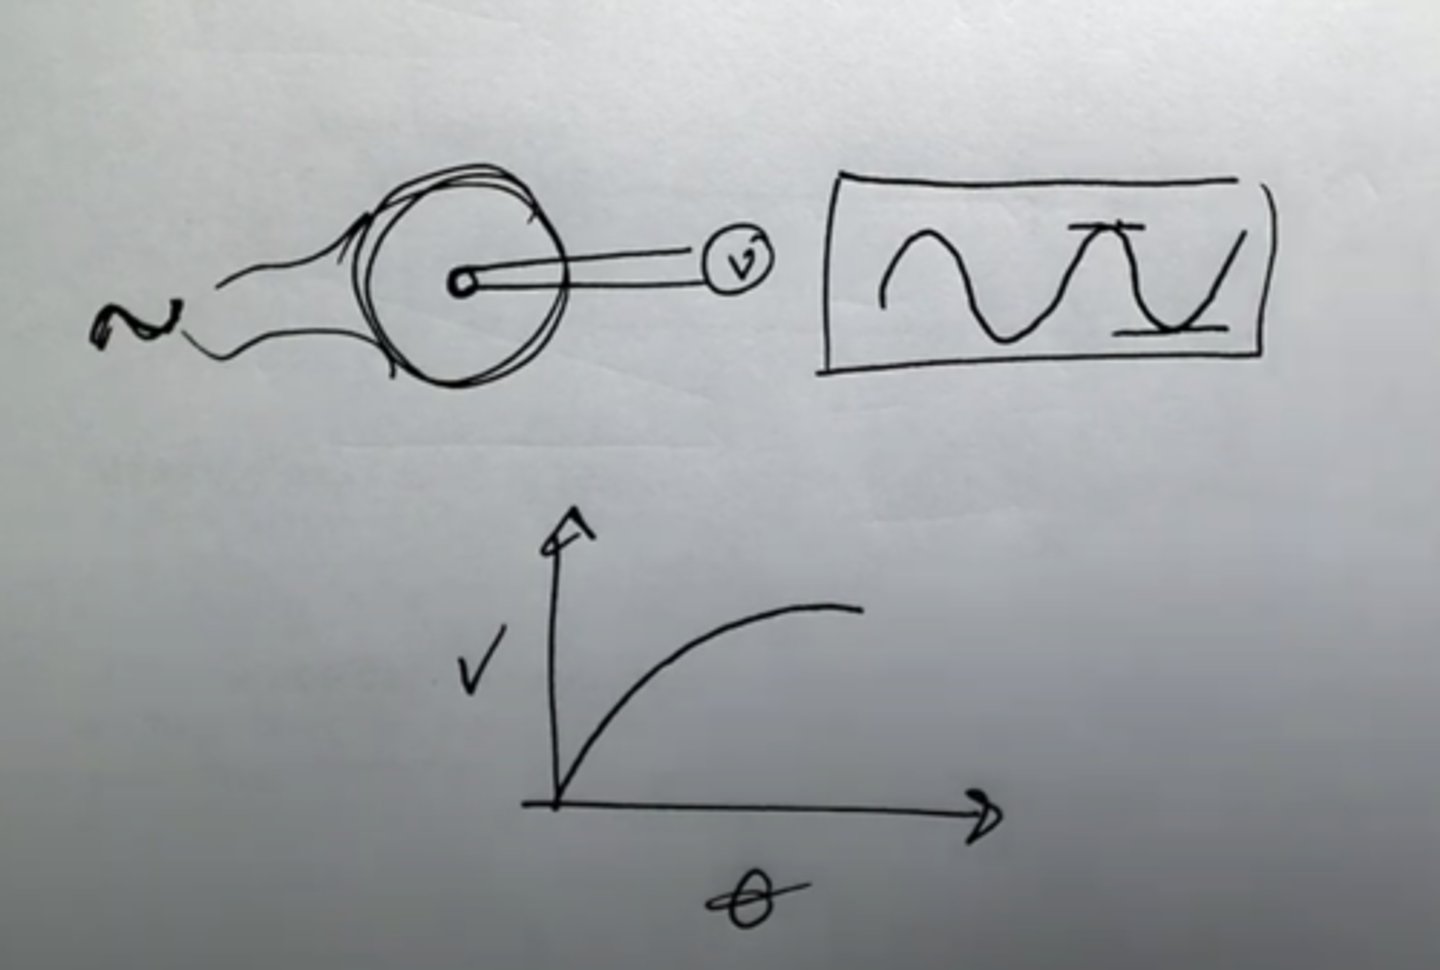
mag flux density vs angle method
Use a search coil, (5000 turns very fine copper wire), mounted in centre of large circular coil connected to ac supply, attached to an oscilloscope, (select time base (x) and volts/division (y) to give large enough graph for accurate reading.) Vary the angle of either search coil or circular coil between 0° and 90°.
Measure peak EMF in search coil this is proportional to max rate of change of flux linkage so is a measure of the max strength of the B field. Plot graph of peak V vs angle, (should be sinusoidal).
A Hall probe can be used instead of a search coil with the circular coil on DC input, hall voltage is analogous to B field strength. The Hall probe could also be used to measure how permanent mag field varies with angle also.
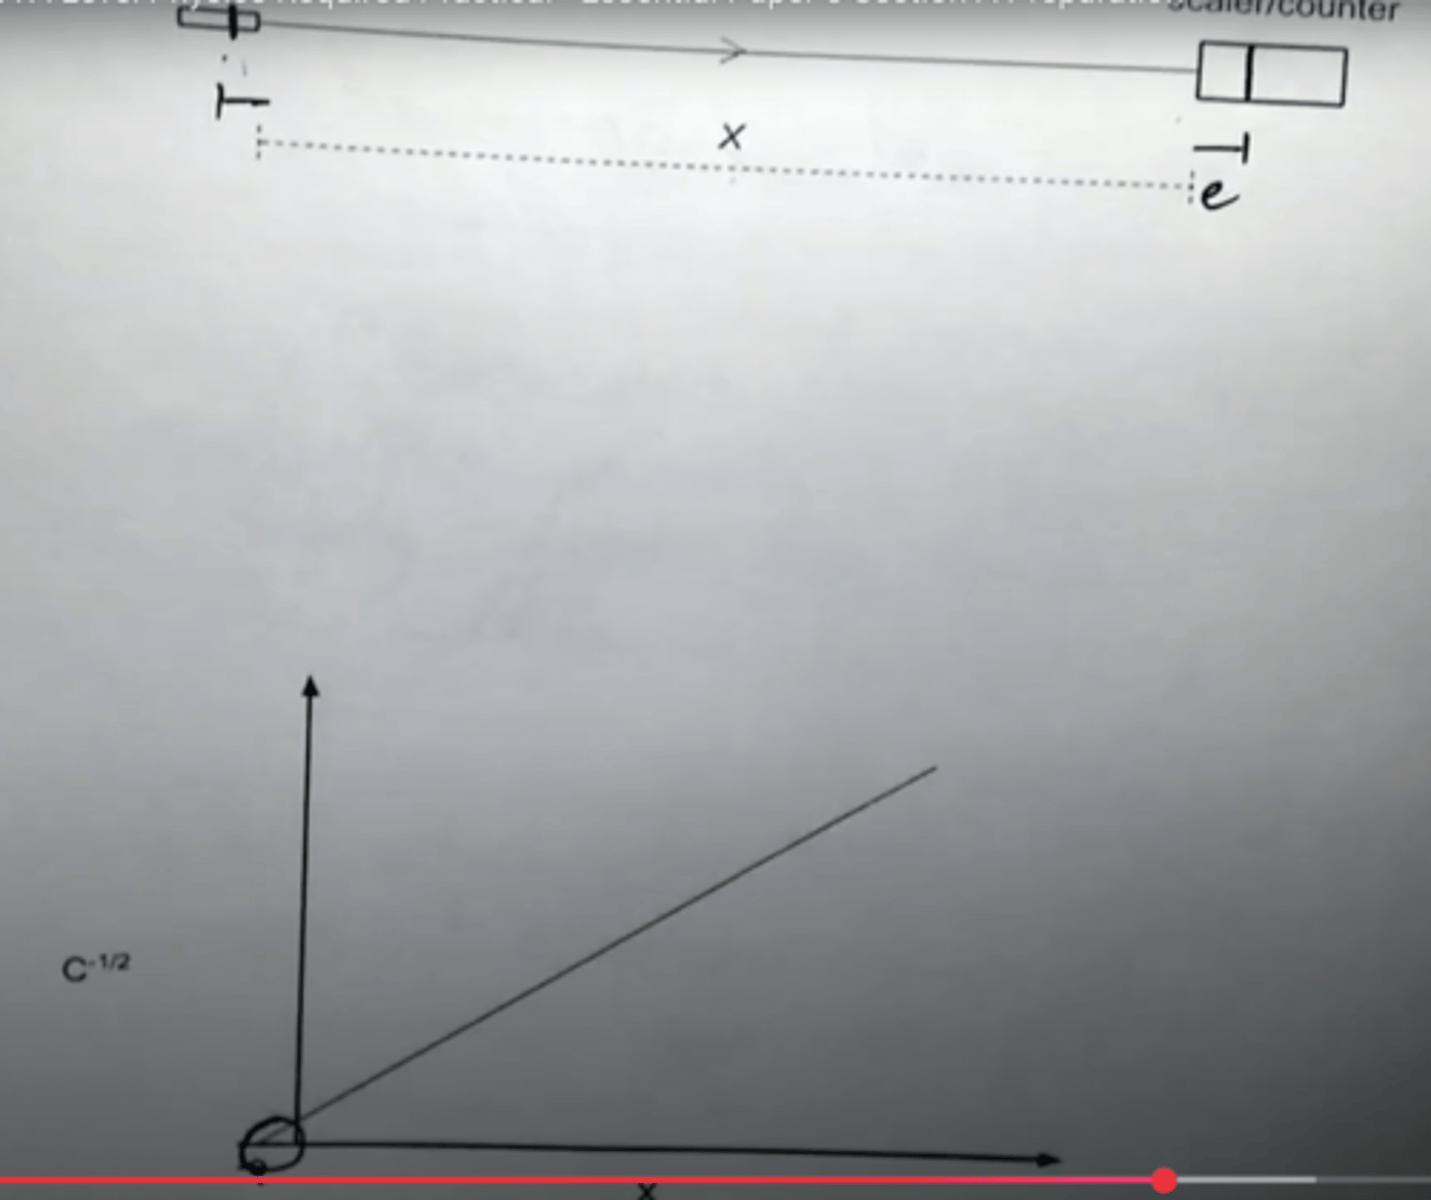
inverse square law for gamma method
Measure count rate with a GM tube and scaler for a range of distances, X, measured with metre ruler between 100mm and 600mm from a gamma emitter e.g. Co-60. Deduct background radiation level to give corrected count rate, C. Plot 1/rootC (C-1/2) vs X to give straight line. Plotting this rather than C vs 1/X^2= gives x intercept equal to any systematic error in measurement of distance (e.g. from not knowing the exact location of the source within the sealed containtainer, or depth of ionisations within GM tube.)
C is the corrected count rate - eg - background radiation
power and specific heat capacity
power = mc x change in temp/change in time
when would a search coil not be a suitable sensor for a B field
If the B field is not changing - no emf can be induced so no flux can be measured
explaining how a log linear graph shows that two variables are inversely proportional
negative gradient AND linear
if you are measuring the distance between two points on a graph where the value is log x
you must do 10^value 1 - 10^ value 2 you cannot swap the logs after
Division for the time base of an oscilloscope is
The large squares, not the small small inside
if a sound wave is moving in a block and a waveform is produced, what is the distance travelled
twice the length of the block
when new experiment would cause a waveform to change and no longer fit on an oscilloscope what must you mention
what time base/y gain to select to display the full waveform
what should u use to avoid parallax error
line up a mirror behind the fiducial marker
how can you improve the measuring wavelength with standing waves practical
making the measured distance larger by measuring through multiple maximas, this will reduce percentage uncertainty
you need to record values in a table before doing calculations on them
for example, for mass spring extension. you must record the ruler position, then add another table to calculate the extension
graphs with negative valeus have lower values at the top