Unit 2: Economic Indicators & the Business Cycle
1/57
Earn XP
Name | Mastery | Learn | Test | Matching | Spaced | Call with Kai | Chat |
|---|
No analytics yet
Send a link to your students to track their progress
58 Terms
What are general factors that GDP cannot account for?
Standard of living (leisure time, volunteerism, natural beauty, housework) and non-market transactions. (Population if we are not using GDP per capita)
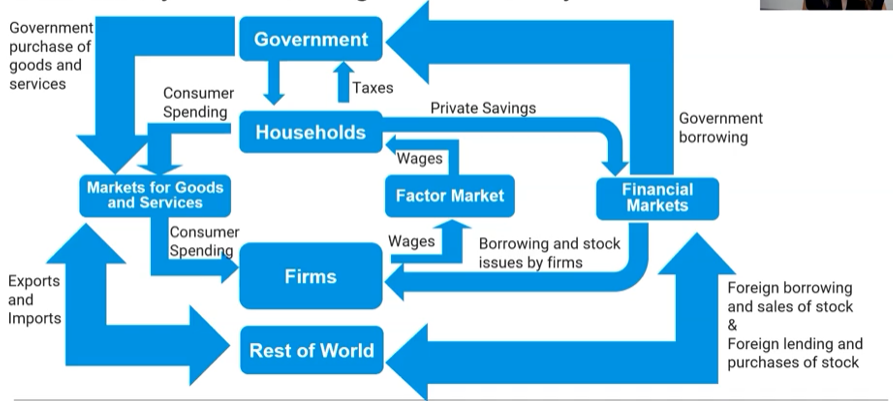
Circular Flow Diagram
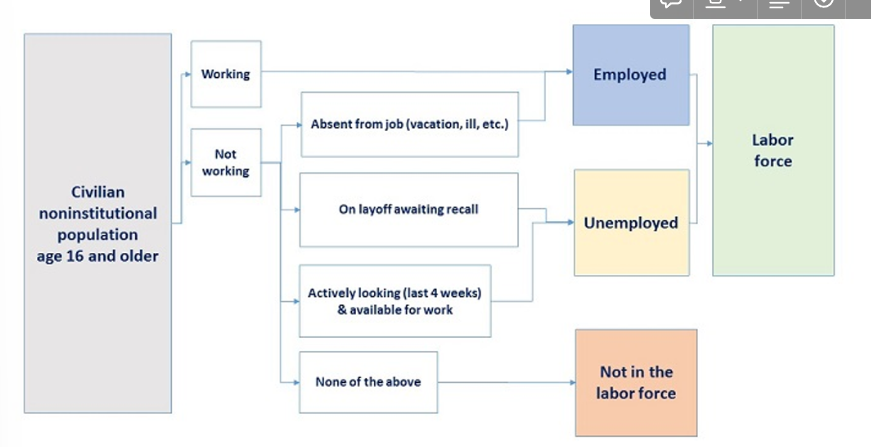
Employed
people who are currently holding a job in the economy, either full-time or part-time. (Vacations or sick leaves: STILL EMPLOYED)
Unemployed
people who are not currently employed but are actively looking for work.
Labor force participation rate
the percentage of the population, aged 16 and older, not in the military or institutionalized, that is in the labor force.

Unemployment rate
the percentage of the total number of people in the labor force who are unemployed.

Labor force diagram
Limitations of the unemployment rate
There are many people NOT in the labor force thus they aren’t included in the unemployment rate.
Does not account for discouraged workers.
Does not account for marginally attached workers.
Does not account for underemployed workers.
Discouraged workers
: non-working people who are capable of working, but have given up looking for a job due to the state of the job market. NOT IN THE LABOR FORCE!!!!!!
Marginally Attached Workers
would like to be employed and have looked for a job but are currently not looking for work.
Underemployed workers
part-timers because they cannot find full-time jobs. (They are counted as employed)
Frictional unemployment
unemployment due to the time workers spend in job search.
New graduates
Looking for new opportunities
Structural unemployment
results when there are more people seeking jobs in a labor market than there are jobs available at the current wage rate.
When workers’ skills are obsolete, no longer needed
Replaced by technology
These workers generally need to be retrained to get new skills that are useful to the job market.
Cyclical unemployment
follows the business cycle; happens during recessions, jobs usually return after the economy recovers.
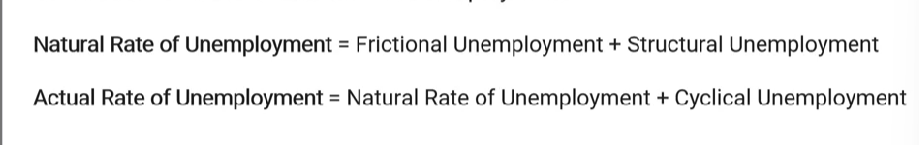
Natural Rate of Unemployment (4%-6%)
There is always going to be frictional and structural unemployment occurring naturally. Thus, a certain amount of unemployment is normal or natural in an economy. Actual unemployment fluctuates around this normal level and is considered full employment. Full employment is where there is little to no cyclical unemployment.
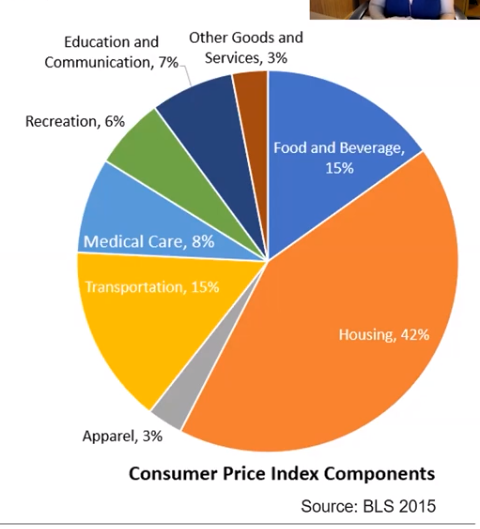
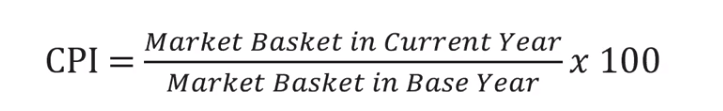
Consumer Price Index (CPI)
The average change over time in the prices paid by consumers for a FIXED “market basket” of goods and services.
Allows us to see the purchasing power of an average consumer as prices rise.
Market basket
refers to the goods and services purchased by consumers
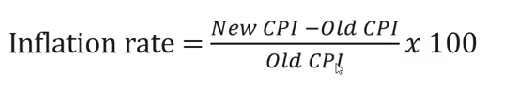
CPI and Inflation
If the CPI is rising, so is inflation.
If the CPI is falling, deflation is rising.
Deflation strengthens purchasing power.
Calculating the inflation rate using the CPI
Find the market basket value for each year.
QUANTITY IS CONSTANT FOR BOTH CALCULATIONS BY USING THE QUANTITY FOR THE BASE YEAR.
Base year good= Byear Price * Byear quantity
Current year good= Cyear Price * Byear quantity
Market basket: The sum of 3 different goods and their value of (Price Cyear * Quantity Byear)
Find the CPI using the market basket values (Rate of change formula * 100).
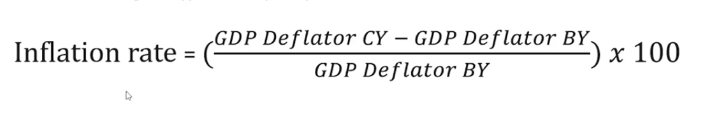
Calculate the inflation rate by the rate of change formula using the CPIs.
CPI
Inflation rate (Using CPI)
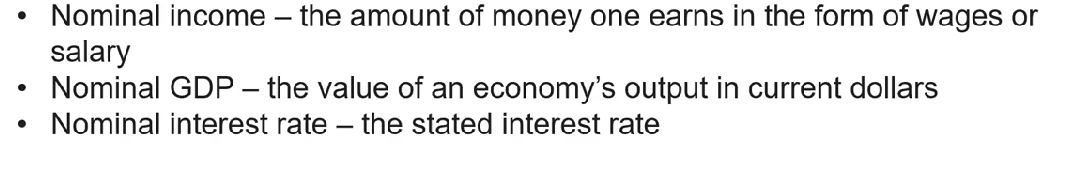
Nominal
values that have not been adjusted for inflation
Real
values that have been adjusted for inflation.

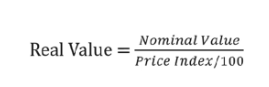
How to deflate a nominal value using a price index (CPI)
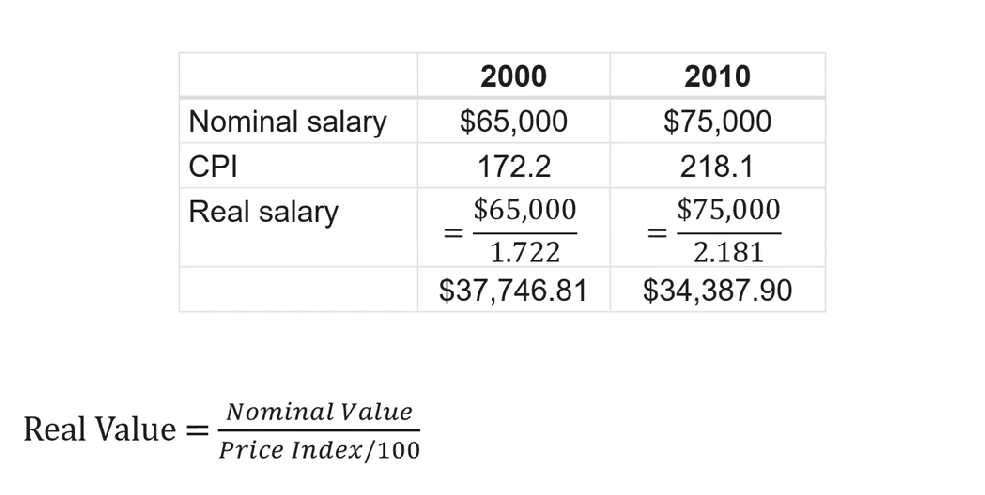
Real value formula
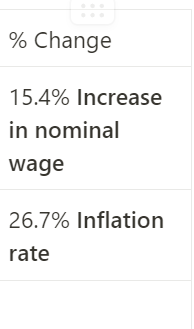
Interpreting effects of inflation on nominal wage.
If the inflation rate is higher than the rate of change in the person’s wage, they are not better off.
Limitations of CPI
Substitution bias: since the market basket is only updated every few years, it doesn’t account for goods that have been substituted for less expensive alternatives.
Introduction of new goods: the market basket does not reflect the change in purchasing power when new goods are introduced.
Unmeasured quality changes: the CPI does not reflect the change in the value of dollars when the quality goes up and down.
Volatile changes: the prices of some items in the CPI are always changing dramatically.
Inflation rate is higher than expected, who benefits and who loses?
Beneficiaries: anyone paying money at a fixed amount such as borrowers.
Losers: anyone receiving money at a fixed amount such as lenders and people on fixed income such as social security recipients.
They are receiving money with less real value than they expected.
Price stability
refers to the condition that exists when the expected inflation is equal to actual inflation.
Fosters confidence in economic decisions.
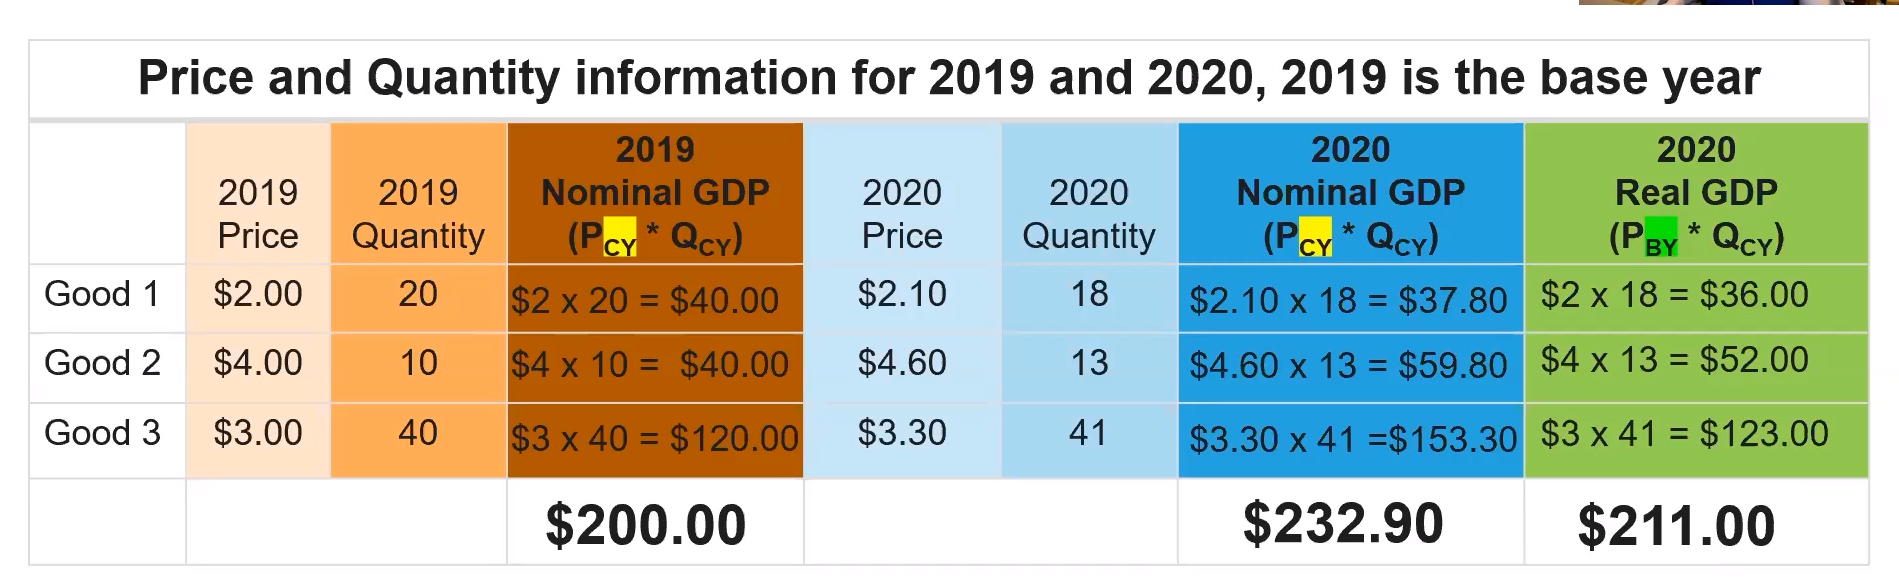
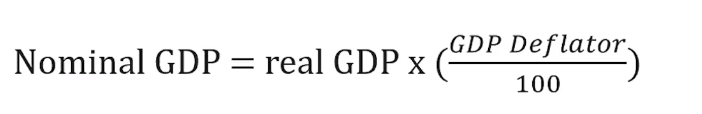
Nominal GDP
the value of an economy’s output in current dollars.
Not adjusted for inflation.
You multiply the Price in the Cyear by the Quantity in the Cyear.
You find the sum of these goods to find nominal GDP.
Nominal GDP
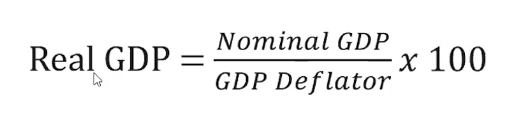
Real GDP
the value of an economy’s output in inflation-adjusted or constant dollars.
You find the sum of the goods calculated by Price in the Byear by the Quantity in the Cyear.
Real GDP
Example of how to calculate nominal and real GDP
If nominal GDP has increased relatively to a previous year, then either real GDP or Aggregate Price level have increased.
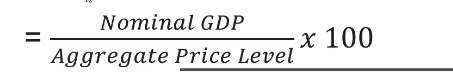
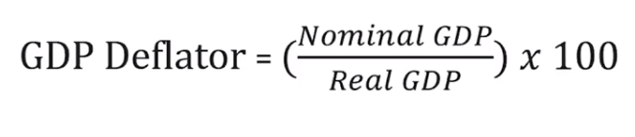
GDP Deflator
a price index that measures the price changes in ALL goods and services produced in an economy during a given period, which tells us the aggregate price level.
GDP Deflator formula
Inflation rate (GDP Deflator)
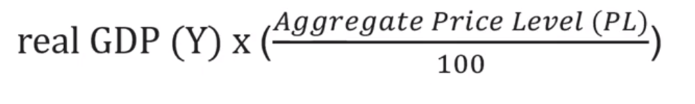
Real GDP (GDP Deflator)
Nominal GDP (GDP Deflator)
Expansionary phase
GDP is increasing
Unemployment is decreasing
Inflation is increasing
Interest rates are decreasing
Contraction (Recessionary phase)
GDP is decreasing
Unemployment is increasing
Inflation is decreasing
Interest rates are increasing
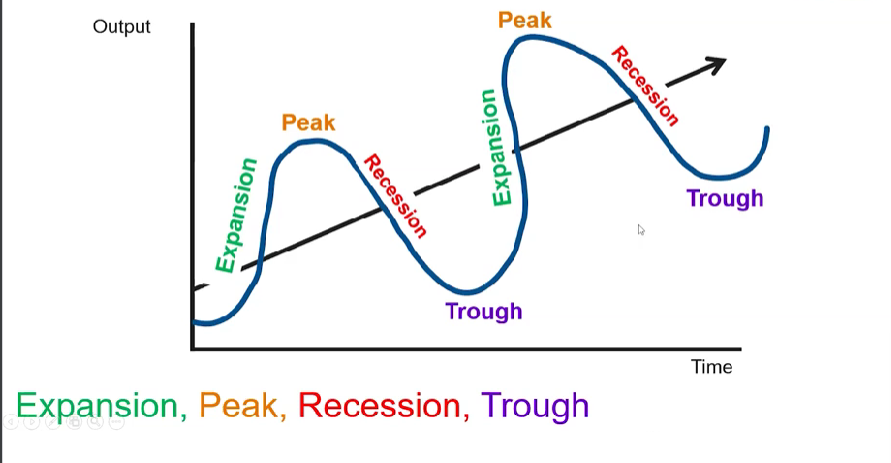
Turning points in the Business Cycle
Peak: output goes from increasing to decreasing (has reached its max point)
Trough: output goes from decreasing to increasing (has reached its min point)
Business Cycle Model
Potential output
is also called full-employment output. It is the level fo GDP where unemployment is equal to the natural rate of unemployment.
Output gaps
The difference between actual output and potential output is the output gap.
When actual output>potential output or actual output<potential output, the economy is said to be experiencing an output gap.
actual output>potential output → inflationary gap the actual rate of unemployment<NRU
actual output<potential output → recession the actual rate of unemployment> NRU