A Level CIE Biology: 18 Classification, Biodiversity & Conservation
 Call Kai
 Learn
Learn Practice Test
 Spaced Repetition
 Match
Match Flashcards
 Knowt Play
1/154

There's no tags or description
Looks like no tags are added yet.
Name | Mastery | Learn | Test | Matching | Spaced | Call with Kai | Chat |
|---|
No analytics yet
Send a link to your students to track their progress
155 Terms
species (biological species concept)
a group or organisms with similar morphological and physiological features that able to breed together and produce fertile offspring
biological species concept
reliant on determining whether inbreeding produces fertile offspring - difficult and time consuming to determine in practice. other discriminating factors that scientists can use to group similar orgs together
morphological species concept
scientists described by physical features and group together orgs that share many physical features that distinguish them from other species.
ecological species concept
when there’s a population of similar orgs living in same area at the same time, they can be described as an ecological species
taxonomy
practice of biological classification involving placing orgs into series of categories/taxa to make it easier to see evolutionary relationshisp between orgs.
domain
highest rank of hierarchical classification
cell types (major) role in classification of orgs into the 3 domains
prok cells easily distinguishable in that they lack a nucleus
euk cells have compartmentalised structures, w at least their genetic material segregated from rest of cell in a nucleus
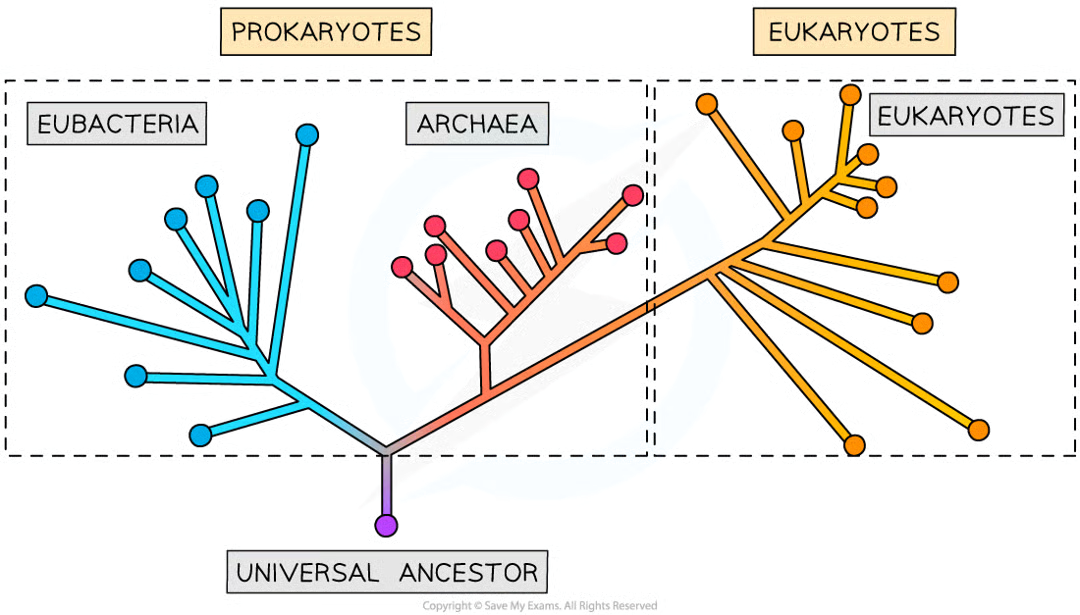
prok are divided into 2 separate groups based on molecular analysis of rna genes proving cell type insufficient classification
3 domains:
archaea (prok)
bacteria (prok)
eukarya (euk)
archaea features 9
single-celled/unicellular orgs
sometimes extremophile prokaryotes (live in extreme environments but not all)
no nucleus
not bacteria bc: 3
unique lipids in membranes of cells
no peptidoglycan in cell walls
ribosomal structure (particularly that of small subunit) more similar to euk ribosome than bac
similar size range
dna transcription similar to euk
e.g. haloboacterium salinarium (dead sea)
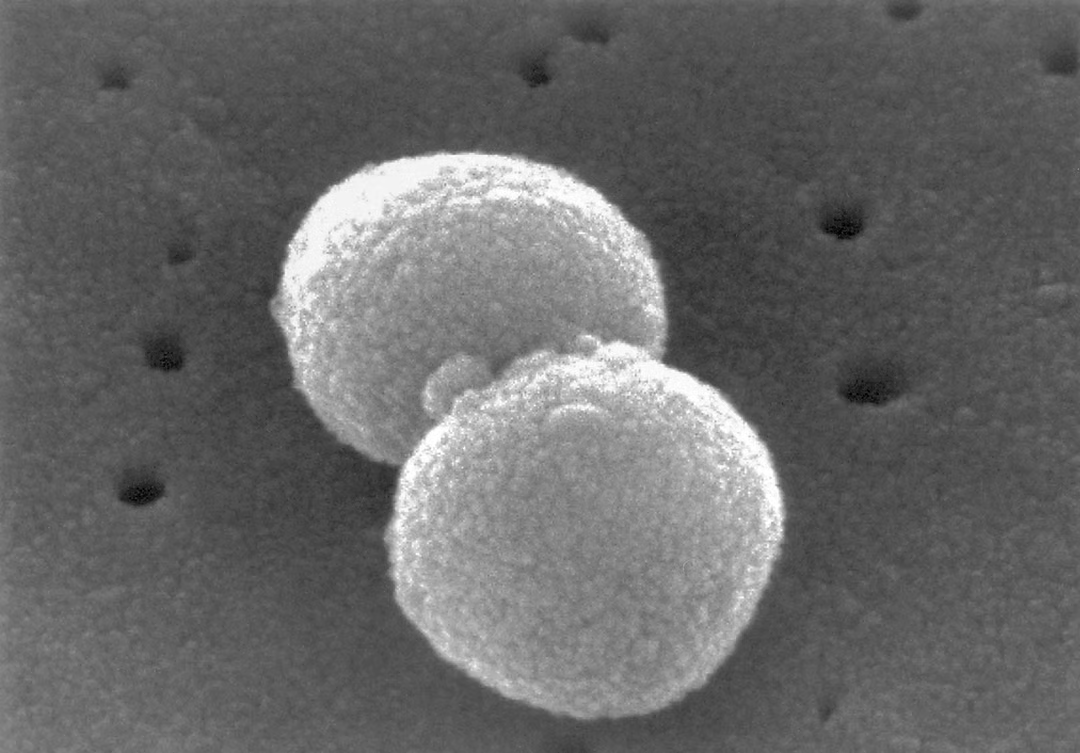
bacteria features 5
single-celled/unicellular
prok no nucleus
vary in size over wide range (smallest are bigger than alrgest known viruses and largest smaller than singlecelled euk
divide by binary fission
e.g. streptococcus pneumoniae
eukarya features
orgs w euk cells w nuclei and memb-bound organelles placed in this domain
vary massively in size from single-celled orgs several micrometres across to large multicellular orgs many metres in size e.g. blue whales
euk cells diivde by mitosis
euks can reprod sexually or asexually
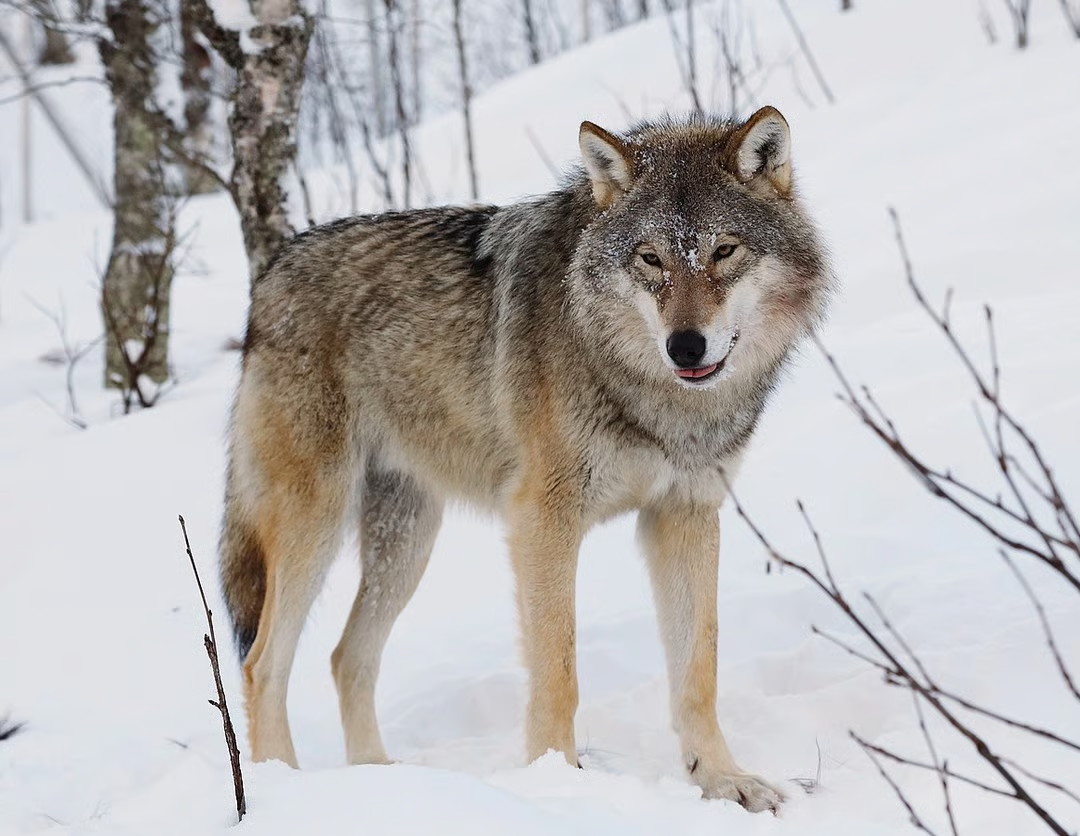
e.g. canis lupus
3 main diffs between archaea and bacteria
membrane lipids
ribosomal rna
cell wall composition
membrane lipid differences 3
archaras are completely unique, memb lipids consist of brancched hydrocarbon chains bonded to glycerol by ether linkages
memb lipids of bacteria unbranched hydrocarbon chains bonded to glycerol by ester linkages
not in bacterial or euk cells
ribosomal rna differences 4
both archaea and bacteria posses 70s ribosomes
70s ribs in archaea possess a smaller subunit similar to subunit in euk rib than sub in bac
base sequences of ribosomal rna in archae more similar to rRNA of eukarya
prim structure of ribosome proteins in archae more sim to ribosome proteins in eukarya than bacteria
composition of cell walls differences
bacteria always peptidoglycan
archaea always cell walls but not peptidoglycan
archaea: cell type, chromosome, cell memb lip, ribosome, cell walls, histones, introns
prok
circular
glycerol - ether lipids
70s ribs but small subunit more similar to euk ribs
always present w/o peptidoglycan
yes
sometimes
bacteria: cell type, chromosome, cell memb lip, ribosome, cell walls, histones, introns
prok
circ
glycerol - ester lipids
70s ribs
always present w peptidoglycan
no
rarely
euk: cell type, chromosome, cell memb lip, ribosome, cell walls, histones, introns
euk
linear chromosomes + circular mtDNA and cpDNA
glycerol - ester lipids
large 80s ribosomes in cytosol and 70s ribosomes in mitoch and chloro
sometimes present w/o peptidoglycan
yes
yes
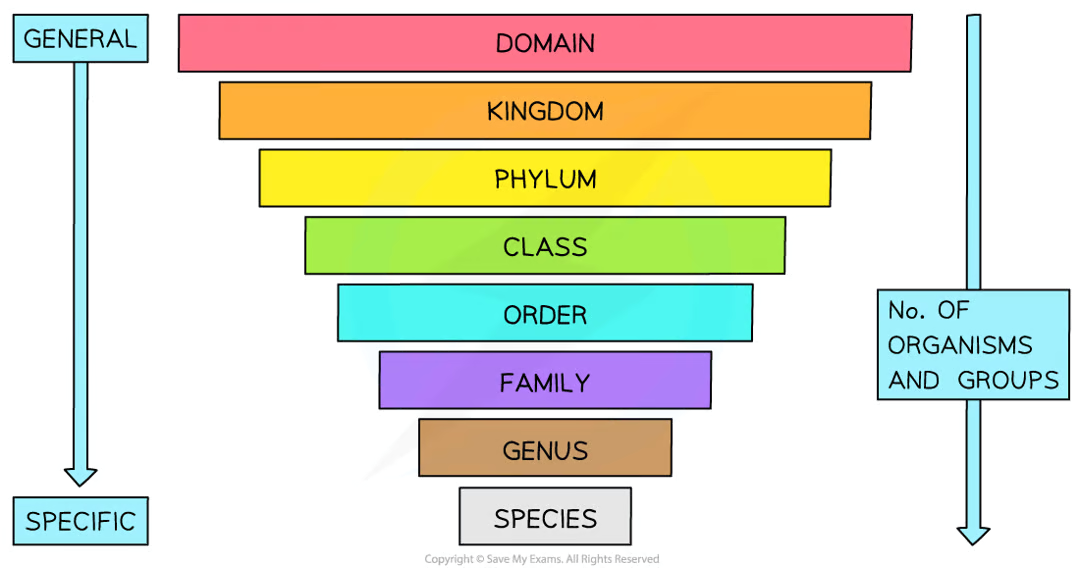
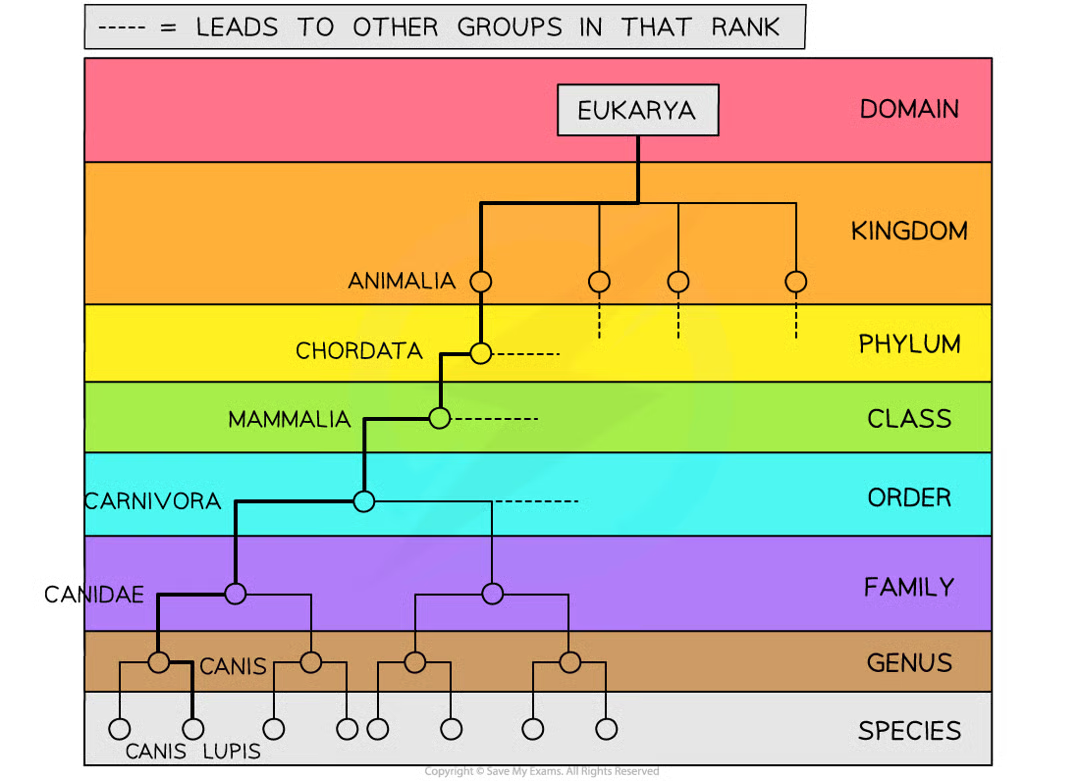
hierarchical classification system of organisms
used to organise and group similar organisms together so that evolutionary relationships between orgs more easily understood
7 taxonomic ranks (domain highest, species lowest)
similar species grouped in genus
similar genuses grouped in family
similar fams grouped in order
similar orders grouped into class
similar classes grouped into phylum
similar phyla can be grouped into kingdom
similar kingdoms can be grouped into domain
DUMB KINGS PLAY CHESS ON FANCY GOLD SQUARES
wolf and hibiscus down the taxonomic ranks
wolf: eukarya, animalia, chordata, mammalia, carnivora, canidae, canis, lupus
hibiscus: eukarya, plantae, angiospermae, dicotyledonae, malvales, malvaceae, hibiscus, rosa-sinensis
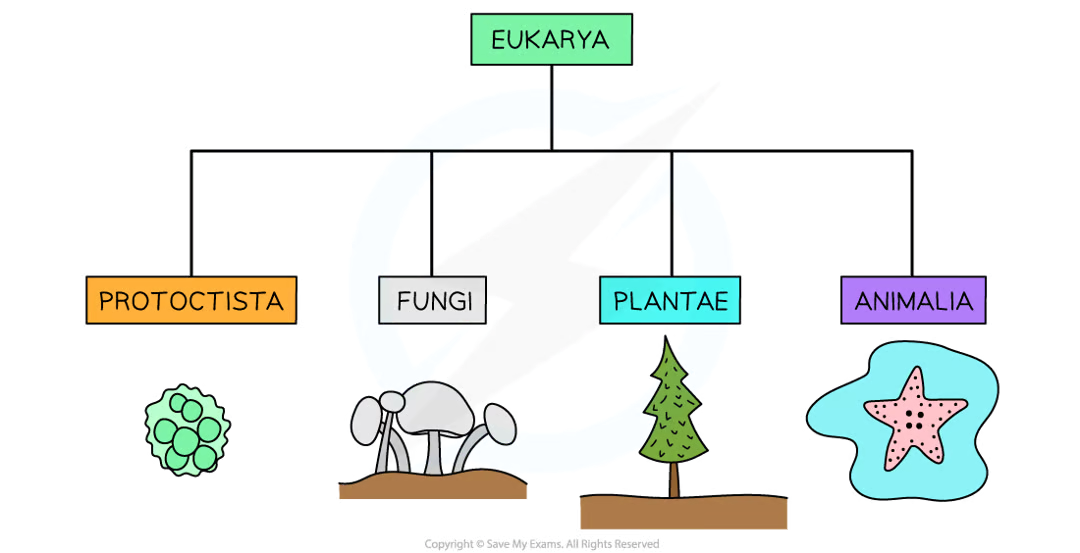
4 kingdoms of eukarya
have distinct char and features
protoctista (protoctists)
fungi
plantae (plants)
animalia (animals)
2 similarities of all kingdoms of eukarya
have cells w membrane bound nuclei separating genetic material from cytoplasm
have compartmentalisation within cells as result of presence of other organelles
kingdom protoctista features 4
eukaryotic (all euk that don’t belong to other 3)
show great diversity in all aspects of life (structure, life cycle, feeding, trophic levels, modes of locomotion)
can be single-celled or group of similar cells
protozoa has no cell wall like animals but algae have cellulose cell walls and chloroplasts like plants, both protoctists
kingdom fungi 6
oldest org in world (1500-10,000 yo)
euk
cells of fungi have non cellulose cell walls (chitin and glucans) and no cilia
fungi are heterotrophs
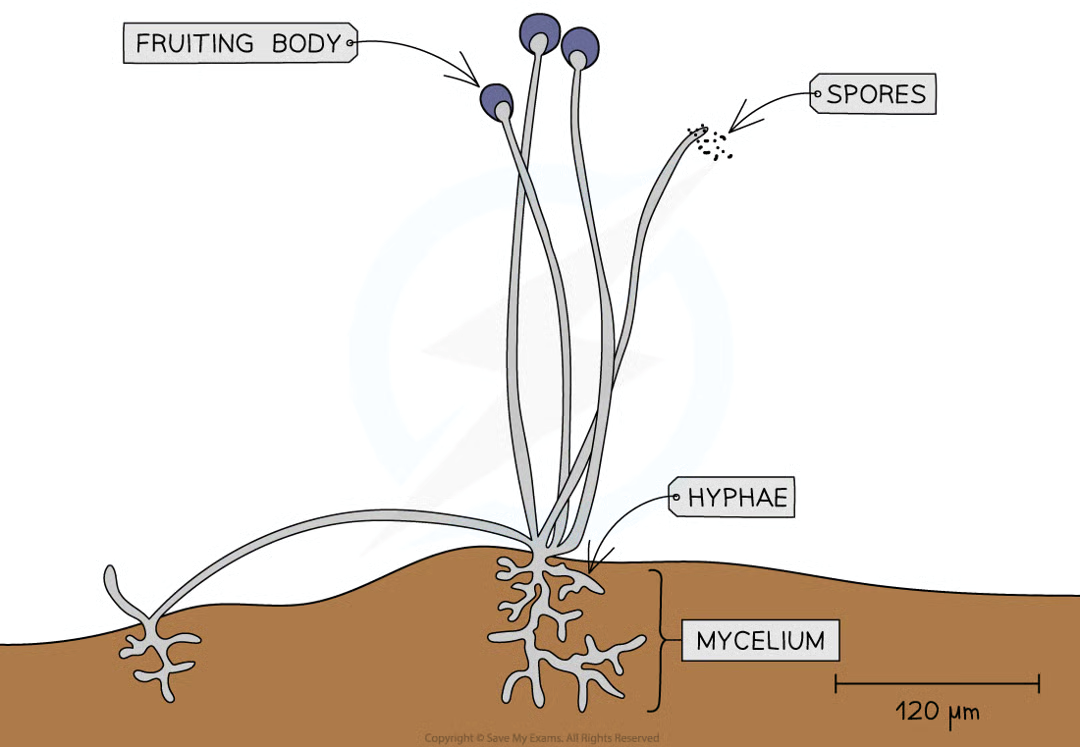
reproduce using spores that disperse onto ground nearby
have a simple body form - can be unicellular (yeast - Saccharomyces cerevisiae), can have long threads called hyphae from main fungus (mycelium), or larger fungi posses fruiting bodies that release large no. spores
heterotrophs
use organic compounds made by other organisms as their source of energy and molecules for metabolism. obtain energy and carbon by digesting dead/decaying matter extracelliularly or from being parasites on living orgs.
kingdom plantae features 8
multicellular euk orgs
cellulose cell walls
possess large (usually permanent) vacuoles for structural support
can differentiate into specialised cells to form tissues and organs
chloroplasts for photosyn (not all plant cells have)
can sometimes have flagella
autotrophs
complex body forms (branching systems above and below ground)
autotrophs
can synthesise organic compounds and mols for energy use and building biomass from inorganic compounds
kingdom animalia features 7
multicellular euk orgs
able to diff into many diff specialisedd cells that form tissues and organs
small temporary vacuoles e.g. lysosomes
no cell walls
cilia sometimes
heterotrophs (wide range of feeding mechs)
wide range of body forms (communication within complex body forms thru nervous system and chem signalling)
what are viruses
microorganisms that can only be seen using an electron microscope
virus features 5
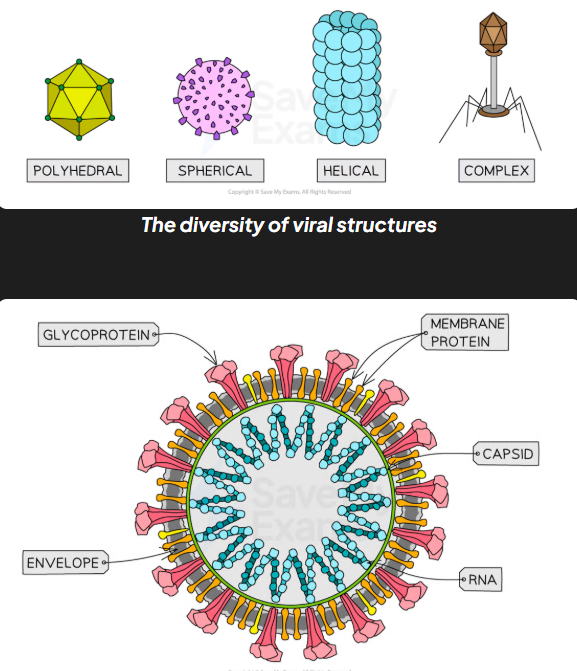
no cellular structure, acellular
have no metabolism
hijack dna replication machinery in host cells
energy viruses need for replication is provided by respiration in host cell
not part of the 3 domains.
how are viruses classified
according to type of nucleic acid (RNA or DNA) their genome is made from.
why are there different groups of viruses
in cellular orgs, dna is always double stranded and rna is usually single stranded. however in viruses dna and rna can be both
4 groups of viruses
dna single stranded viruses
dna double stranded viruses
rna single stranded viruses (SARS-CoV-2)
rna double stranded viruses
dna single strand virus example - virus, host org, disease
canine parvovirus type 2, dog, canine parvovirus
dna double strand virus example - virus, host org, disease
varicella zoster virus (VZV), human, chickenpox and shingles
rna single strand virus example - virus, host org, disease
morbillivirus, human, measles
rna double strand virus example - virus, host org, disease
human immunodeficiency virus, human, aids
communities
when species interact with other species
ecosystem
a relatively self-contained community of interacting organisms and the environment they live in and interact with. (when communities interact with each other and the environment they live in). vary in size and scale and complexity.
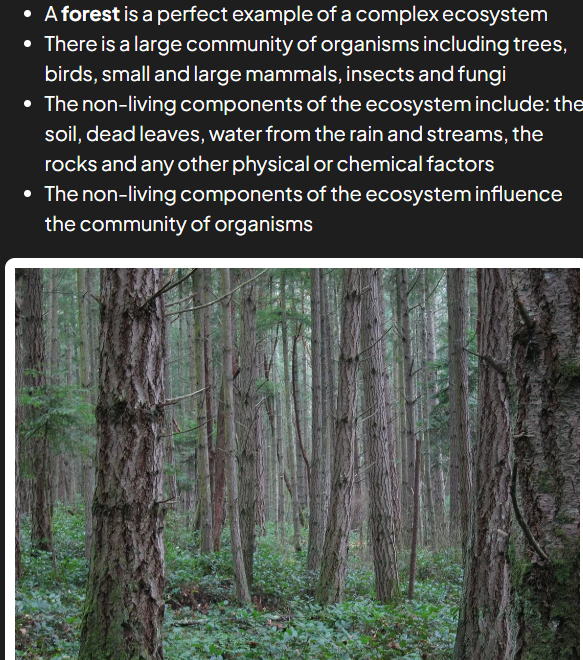
flow of energy
occurs within ecosystem where nutrients are recycled
habitat
the place where a species lives within an ecosystem
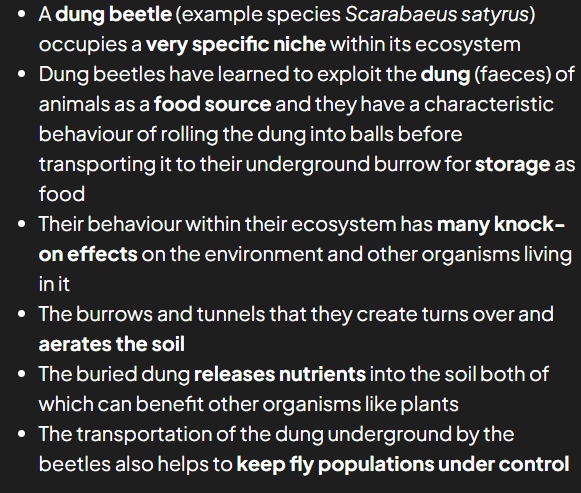
niche
role that species plays within ecosystem. encompasses where in environment the orgnaism is, how it gets its energy and how it interacts w other species and physical env. how org fits into ecosystem
biodiversity
the study of all the variation that exists within and between all forms of life and looks at the range and variety of genes species and habitats within a particular region
3 diff biodiversity levels:
no. and range of diff ecosystems and habitats (ecosystem diversity)
no. species and their relative abundance (species diversity)
genetic variation within each species (genetic diversity)
why is biodiversity important
for resilience of ecosystems, in that it allows them to resist changes in the environment
ecosystem/habitat diversity
range of different ecosystems or habitats within particular area or region
large no. diff habitats = ___ biodiv
high e.g. coral reef, very complex w many microhabitats and niches to be exploited
1-2 diff habitats = ___ biodiv
low e.g. large sandy deserts as conditions same throughout
species richness
no. species within an ecosystem e.g. tropical rainforest species rich
species diversity
looks at no. diff species in ecosystem and also evenness of abundance across the diff species present.
greater no. species in ecosystem = more evenly distrib no. orgs in each then greater species diversity e.g. large no. diff species but only 3-4 individuals so not high spec div
why are ecosystems w high species diversity stabler than lower species div
more resilient to env changes e.g. pine forests florida dominated by 1 or 2 tree spcies, if pathogen then whole pop could collapse
genetic diveristy
diversity of alleles and genes in the genome of species as indi may have same genes but not same alleles
how is gen div measured
working out proportion of genes that have more than one form (allele) and how many possible alleles each gene has
why might gen diff/diveristy between pops of same species occur
slightly diff ranges in habitat so subject to diff selection pressures that affect allele frequency in pop
why is there genetic div within single pop of species
helps population adapt and survive when change sin env occur e.g. biotic factors like new predators, pathogens, competition w other species or abiotic factors like temp, humidity, rainfall changes
why is random sampling used 2
identification and cataloging as well as time are needed to build species list in ecosystem which is possible where species are very large or areas very small
otherwise, its impossible, so different samples of area taken and used to make estimates of total species no. in area
sampling
method of investigating abundance and distribution of species and populations
2 types of sampling
random
systematic
random sampling
positions of sampling points completely random/due to chance and is beneficial because no bias on part of person carrying out sampling that may affect results
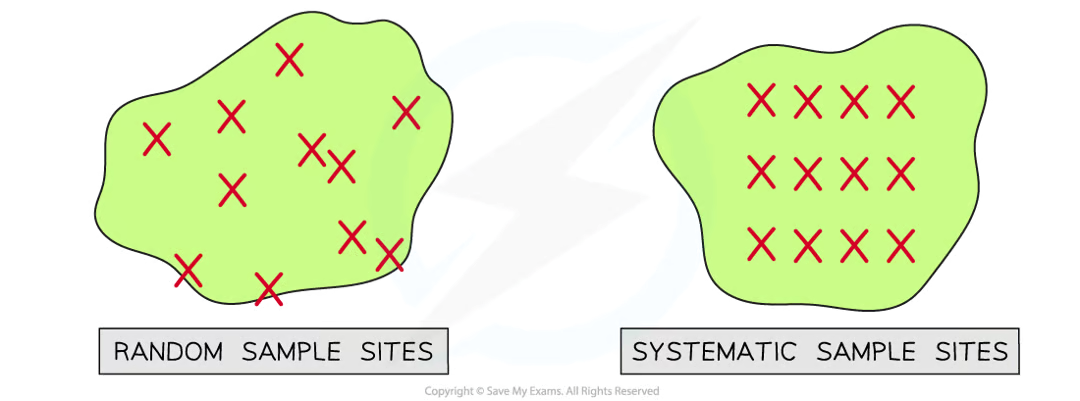
systematic sampling
positions of sampling points chosen by person carrying out sampling but possiblity of bias to certain areas or deliberately place quadrats in areas w fewer species (quicker and easier) so unrepresentative of area
when is random sampling best
when sampling area is reasonably uniform w no clear pattern to way species distrib
distribution of species
how its spread throughout ecosystem
abundance of species
no. individuals of that species
how can distrib + abundance of species be assessed 3:
frame quadrats
line and belt transects
mark-release-recapture
frame quadrats: why, what, how, result 4
used when some ecosystems v complex w large no. diff species of diff sizes, sampling estimates distrib and abundance of species
quadrats of different sizes used depending on what is being measured and what is most suitable, usually of wood or metal and square shape (same length sides)
quadrats laid randomly in area to avoid sampling bias (sample area → grid format and each square labelled w number then random number generator used to pick)
once quadrat laid, abundance of all diff species can be recorded
results from quadrats use
calculate predicted frequency and density of a species within an area
species frequency
probability that species will be found within any quadrat in the sample area
species freq calc
number of quadrats that species was present/total no. quadrats used then x 100
species density
indicates how many individuals of that species there are per unit area
species density calc
no individuals counted across all quadrates/total area of all quadrats
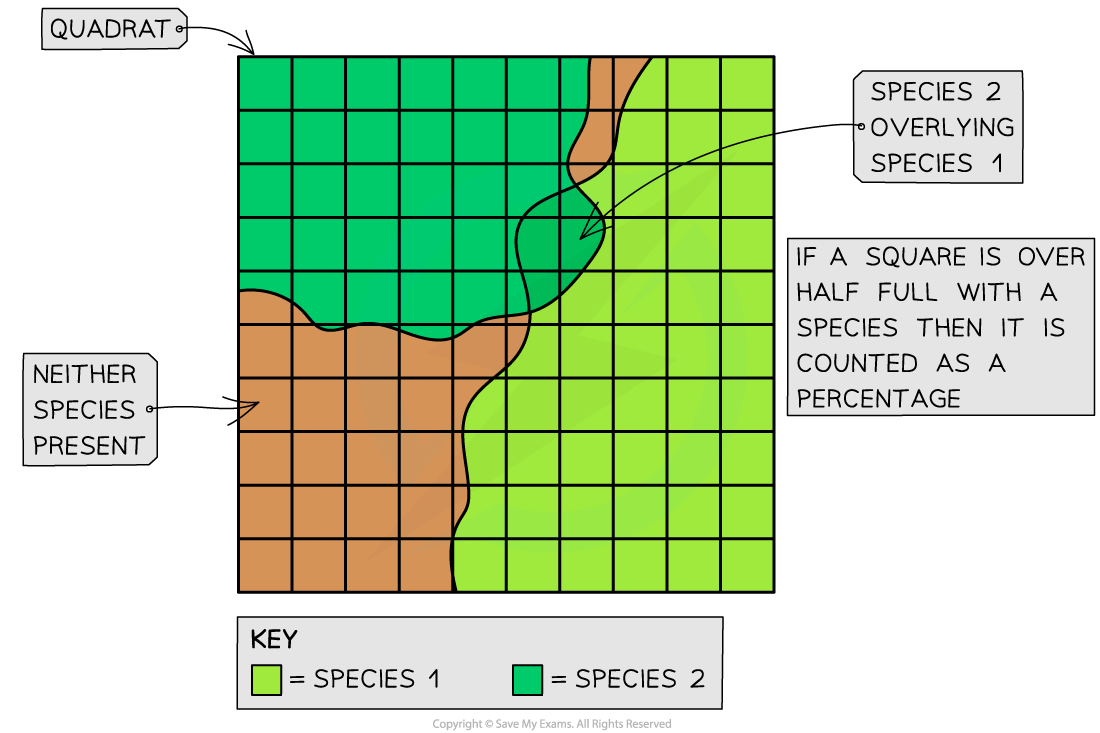
why and how is percentage cover used
hard to count
quadrat divided into 100 smaller squares
no. squares species found in is equivalent to percentage cover in quadrate e.g. 89/100 = 89%
when are line and belt transects used
when investigating species distrib in areas where there are changes in physical conditions (altitude, soil pH, light intesity) as transects can show how species distrib change w diff physical conditions in the area
transect
line represented by a measuring tape along which sample are taken
line transect method 3
lay out measuring tape in straight line across the sample area
at equal distances along the tape record the identity of the organisms that touch the line. e.g. every 2m
produces qualitative data
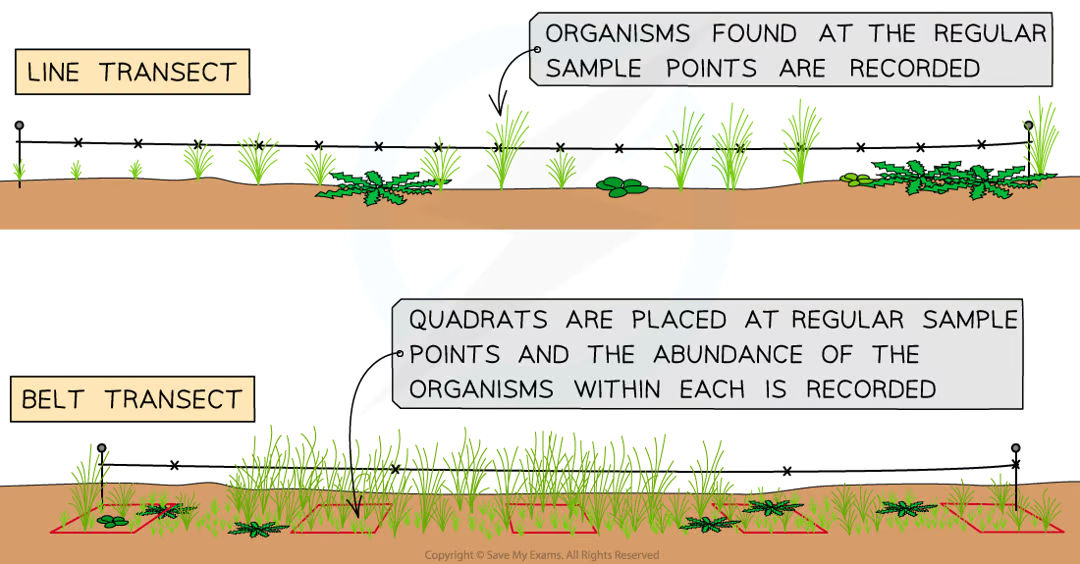
belt transect method 2
place quadrats at regular intervals along the tape and record the abundance of each species within each quadrat
this produces quantitative data
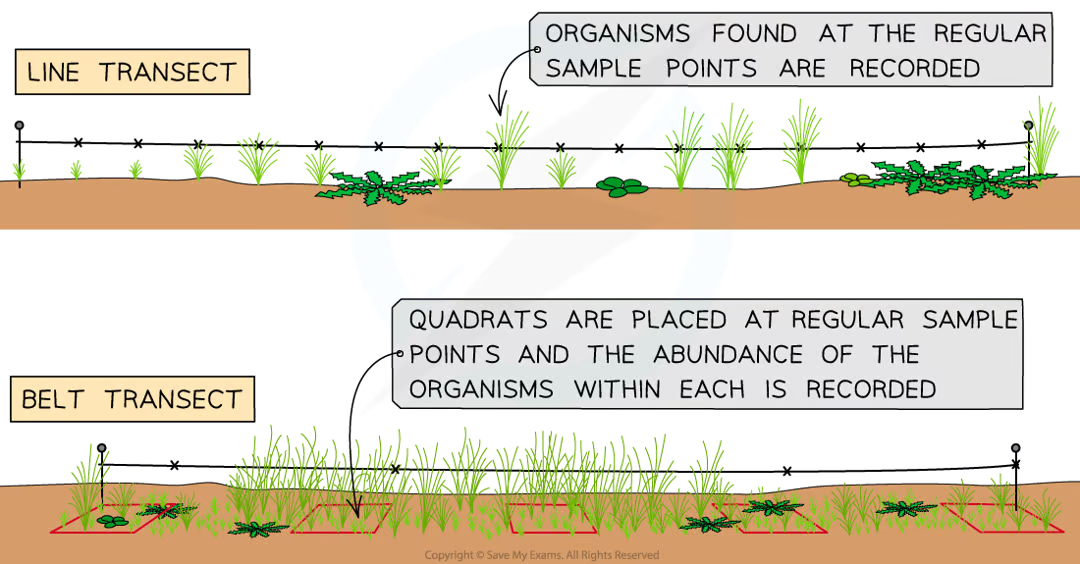
when is mark-release-recapture used
stationary organisms as difficult w mobile/migrating animals
used in conjunction w lincoln index
mark-release-recapture method 6
first large sample taken - as many indi as possible captured/collected, counted and marked in a way that wont affect survival
returned to their habitat and allowed to mix randomly with the rest of the population
when sufficient amt of time passed another large sample captured
no. marked and unmakred counted within samlpe
proportion of marked to unmark indi is used to calc estimate of pop size
formula for mark-release-recapture
N (pop estimate) = n1 (no. marked indi released) x n2 (no. indi in second sample marked and unmarked) / m2 (no. marked indi in 2nd sample)
correlation
association or relationship between variables
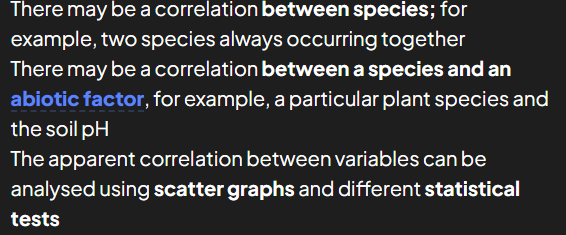
causation
occurs when one variable has an influence on or is influenced by another
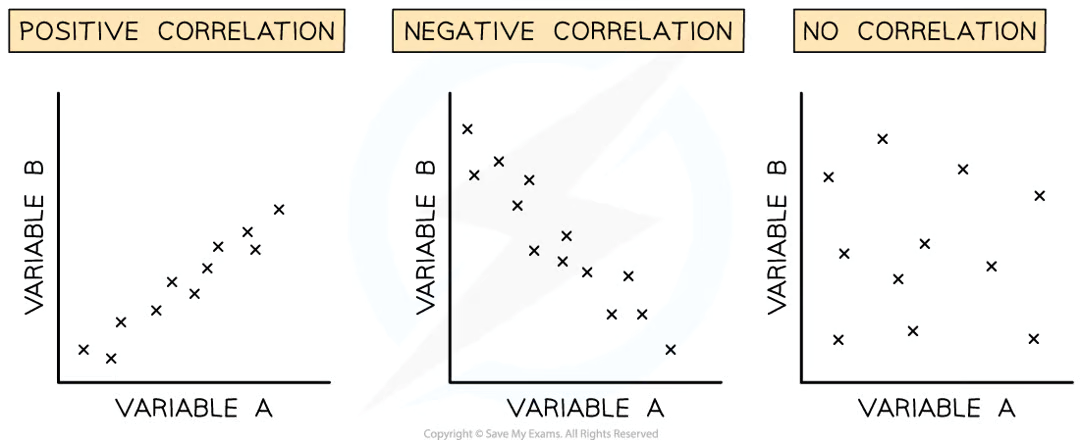
scatter graph
used to get a broad overview of the correlation between 2 variables the data points for both variables
what does correlation coefficient r indicate
strength of the relationsihp between variables. can be calc to determine whether linear relationship exists between variables and how strong relat is
perfect correlation
occurs when all of the data points lie on a straight line with a correlation coefficient of 1.0 or -1.0
correlation can be…
positive or negative.
positive correlation: as A increases, B increases
negative correlation: as A increases, B decreases
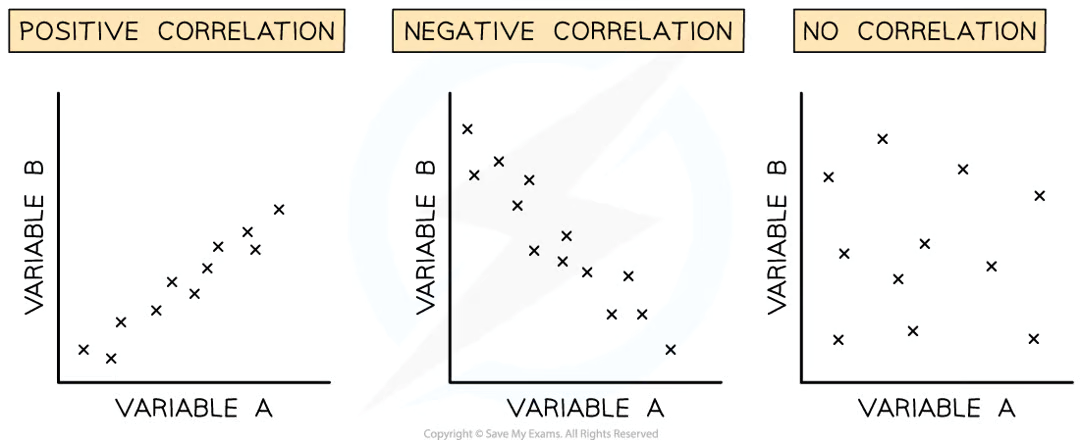
if correlation coefficient is 0…
no correlation between variables
what is pearsons linear correlation
statistical test that determines whether there’s linear correlation between 2 variables
when can pearsons be used
quantitative data (number counted and numerical value recorded)
show a linear relationship upon visual inspection
shows normal distribution
pearsons method
create scattergraph of data gathered and identify if a linear correlation exists
state null hypothesis
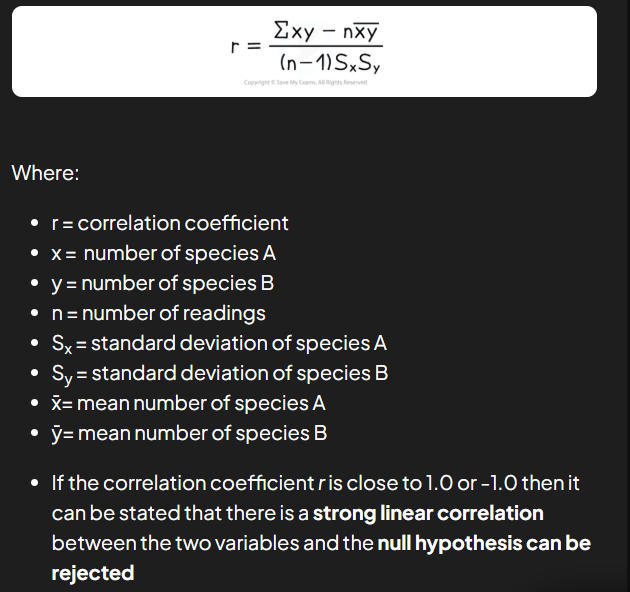
use the following equation to work out pearsons correlation coefficient r
pearsons correlation coefficient r
spearmans rank correlation test
used to determine whether there’s correlation between variables
when can u use spearmans
data not quantitative (abundance scale over count)
visual inspection of data suggests non-linear correlation
may not be normally distrib
spearmans method
create scatter graph and identify possible linear correlation
state a null hypothesis
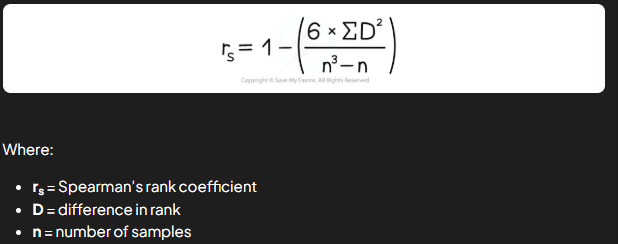
use following equation to work out spearmans rank correlation coefficient r
refer to a table that relates critical values of rs to levels of probability
spearmans rank correlation
if value calc for spearmans>critical value for n at 0.05 then..
null hypothesis can be rejected = no correlation between 2 variables
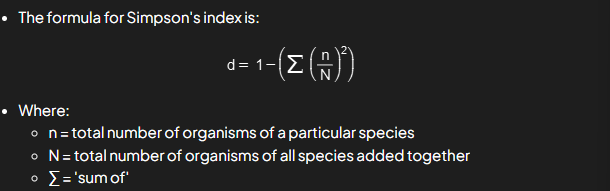
simpsons index calculation
simpsons index calc steps
calculate n/N for each species
square each of these values
add them together and subtract total from 1
values of D
can be between 0-1
1=high lvl biodiv
0=low lvl
extinction
when a species comes to an end or dies out. natural biological process
mass extinction events
past where a very large number of species went extinct at one time, rate of extinction during these periods v high caused by major and sudden shifts in environment e.g. ice age or asteroids. earth currently undergoing bc of humans