Unit 1-1.6 progress check MCQ answers
1/39
Earn XP
Description and Tags
Name | Mastery | Learn | Test | Matching | Spaced | Call with Kai | Chat |
|---|
No analytics yet
Send a link to your students to track their progress
40 Terms
The table describes rates of change of a function f for selected intervals of x. The function f is defined for 0≤x≤4. On which of the following intervals is the graph of f concave down?
B) 1 < x < 2
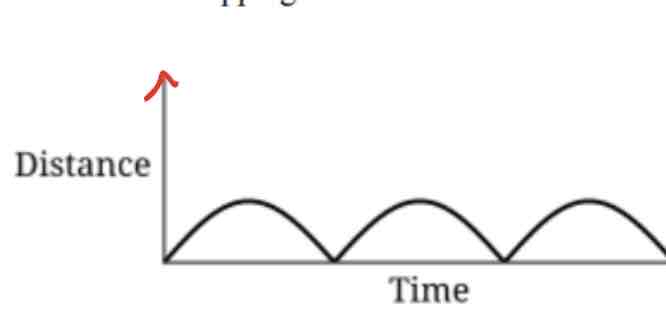
A toy car travels around a circular track as shown in the figure. As the toy car travels around the track, its distance from the wall can be modeled by a graph where the y-axis represents the distance between the car and the wall, and the x-axis represents time. Which of the following graphs models this relationship as the car goes around the track three times without stopping?
A)
The graph of the function fis given for -3 ≤ x ≤ 6. Which of the following statements about the rate of change of fover the interval 2 < x < 6 is true?
D) the rate of change is decreasing
The table gives characteristics of the rates of change of the function f on different intervals. Which of the following is true about fon the interval 3 < x < 4?
A) f is increasing, and the graph of f is concave down
The figure shows the graph of a function f. The zero and extrema for fare labeled, and the point of inflection of the graph of fis labeled. Let A, B, C, D, and E represent the x-coordinates at those points. Of the following, on which interval is f increasing and the graph of f concave down?
A) the interval from A to B
The depth of water, in feet, at a certain place in a lake is modeled by a function W. The graph of y = W(t) is
shown for 0 ≤ t ≤ 30, where t is the number of days since the first day of a month. What are all intervals of t on which the depth of water is increasing at a decreasing rate?
A) (3,6) only
Two drones are flying over a given area, and their heights above the ground are changing. The table gives the change in height, in feet, for the drones over successive 6-second intervals. Which of the following is true about the
average rates of change for drone A and drone B over the time interval from t = 0 seconds to t = 30 seconds?
A) the average rates of change are equal
The graph of the function y = g(x) is given. Of the following, on which interval is the average rate of change of g least?
A) -3 < x < -2
The daily high temperature at a certain point in a river is modeled by the graph. Each point on a vertical gridline indicates the temperature, in degrees Celsius, on the first day of the indicated month. Of the following, on the first day of which month is the rate of change of the temperature the greatest?
B) May
The function fis given by f(x) = x? + 3x - 5. Which of the following describes f?
D) for any interval of x < -1.5 the function has a negative rate of change, and for any interval of x > -1.5 , the function has a positive rate of change
The function fhas a negative average rate of change on every interval of x in the interval 0 ≤ x ≤ 10. The function g has a negative average rate of change on every interval of x in the interval 0 ≤ x < 5, and a positive average rate of change on every interval of x in the interval 5 < x ≤ 10. Which of the following statements must be true about the function h, defined by h(x) = f(x) + 9(x), on the interval 0 ≤ x ≤ 10?
D) h is decreasing on 0 < x < 5; h can be increasing, decreasing, or both increasing and decreasing on 5 < x < 10
The table gives the average rates of change of a function fover different intervals. On which of the intervals does the function increase the most?
D) 8 < x < 10
The table gives values of the function f for selected values of x. If the function fis linear, what is the value of f(13)?
D) 34/3
The function f is defined for all real values of x. For a constant a, the average rate of change of f from x = a to
X= a + 1 is given by the expression 2a + 1. Which of the following statements is true?
C) The average rate of change of f over consecutive equal-length input-value intervals is increasing at a constant rate, so the graph of f could be a line with a positive slope.
The average rate of change of the quadratic function p is —4 on the interval 0 ≤ x ≤ 2 and —1 on the interval 2 ≤ x ≤ 4. What is the average rate of change of p on the interval 6 ≤ x ≤ 8?
B) 3
An object is moving in a straight line from a starting point. The distance, in meters, from the starting point at selected times, in seconds, is given in the table. If the pattern is consistent, which of the following statements about the rate of change of the rates of change of distance over time is true?
B) the rate of change of the rates of change is 0 meters per second, and the object is neither speeding up nor slowing down
The table gives values of a function f for selected values of x. Which of the following conclusions with reason is consistent with the data in the table?
D) f could be a quadratic function because the rates of change over consecutive equal-length intervals in the table can be described by y = 2x + 1
The function fis not explicitly given. The function g is given by 9(x) = f(x + 1) - f(x). The function h is
given by h(x) = g(x + 1) - g(x). If h(x) = —6 for all values of x, which of the following statements must be true?
D) Because h is negative and constant, g is decreasing, and the graph of fis concave down.
The table shows values for a function g at selected values of x. Which of the following claim and explanation statements best fits these data?
D) 9 is best modeled by a quadratic function, because the change in the average rates of change over consecutive equal-length input-value intervals is constant.
The rate of people entering a subway car on a particular day is modeled by the function R, where R(t) = 0.03t° - 0.846t? + 6.587t + 1.428 for 0 ≤ t ≤ 20. R(t) is measured in people per hour, and t is measured in hours since the subway began service for the day. Based on the model, at what value of t does the rate of people entering the subway car change from increasing to decreasing?
D) t = 5.505
For the polynomial function g, the rate of change of g is increasing for x < 2 and decreasing for x > 2. Which of the following must be true?
D) The graph of g has a point of inflection at x = 2, is concave up for x < 2, and is concave down for x > 2.
The polynomial function f is given by f(x) = (2 - 4)(32 - 1,?. Which of the following descriptions of fis
true?
D) f is a polynomial of degree 3 with a leading coefficient of 9.
Values of the polynomial function for selected values of a are given in the table If all of the zeros of the function fare given in the table, which of the following must be true?
B) The function f has a local minimum at (5, 0).
The graph of the polynomial function g is shown. The function f is defined for 0 ≤ x ≤ 3 and is identical to the function 9 on that interval. How many total local minima and local maxima does the function f have?
B) 4
The polynomial function fis given by f(x) = ax* +bx° + cx? + dx + k, where a ‡ 0 and b, c, d, and k are constants. Which of the following statements about f is true?
B) f has either a global maximum or a global minimum, but not both.
The figure shown is the graph of a polynomial function g. Which of the following could be an expression for g(x)?
C) 0.25 (х - 5) (x - 1) (x + 8)
The polynomial function p is an odd function. If p(3) = —4 is a relative maximum of p, which of the following statements about p(-3) must be true?
A) P(-3) = 4 is a relative maximum.
The polynomial function p is given by p(x) = (x + 3) (x? - 2x - 15). Which of the following describes the
zeros of p?
A) p has exactly two distinct real zeros.
The polynomial function k is given by k(x) = ax* - bx® + 15, where a and b are nonzero real constants. Each of the zeros of k has multiplicity 1. In the xy-plane, an x-intercept of the graph of k is (17.997,0). A zero of k is -0.478 - 0.8012. Which of the following statements must be true?
B ) -0.478 + 0.801 is a zero of k.
A polynomial function p is given by p(x) = -2(x - 4) (x + 2). What are all intervals on which p(x) ≥0?
D ) (-∞, -2] U [0,4]
The polynomial function P is given by P(x) = 3x (x + 1)°(x - a), where a is a real number. Which of the following could be the graph of y = P(x)?
D
The table gives values of a polynomial function Q for selected values of a. What is the degree of Q?
C ) 4
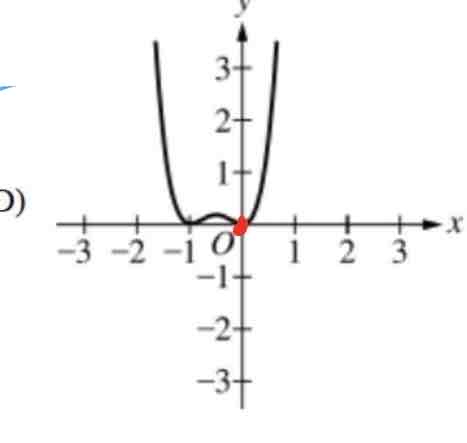
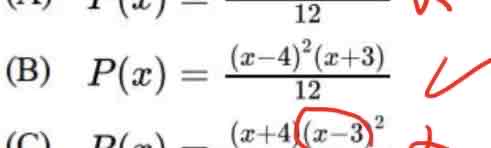
The graph of the polynomial function y = P(x) is shown. Which of the following could define P(x) ?
B)
The leading term of the polynomial function p is anx" where an is a real number and n is a positive integer. The factors of p include (x - 3), (a - i), and (x (2 +i)). What is the least possible value of n ?
C) 5
The function Q is a polynomial of degree 3. If Q(5) = 0, which of the following must be true?
C) Q(x) can be expressed as (x - 5) • P(x), where P(x) is a polynomial of degree 2.
A polynomial function has the form p(x) = ax' + back, where a and b are nonzero constants, j and k are nonnegative integers. Which of the following conditions guarantees that p is an even function?
B) j = 2k and k is even

C) the degree of f is odd, and the leading coefficient is negative

A) -5x - 2x^4

B) lim f(x) positive infinity = - infinity
The function fis given by f(x) = 5x6 - 2x3 - 3. Which of the following describes the end behavior of f?
Lim (negative infinity) f(x) = infinity and lim (positive infinity) f(x) = infinity