AP MACRO EXAM PREP
1/54
Earn XP
Name | Mastery | Learn | Test | Matching | Spaced |
|---|
No study sessions yet.
55 Terms
Economics
The social science that studies how individuals and societies allocate scarce resources to satisfy unlimited needs and wants.
Scarcity
A fundamental economic problem of having seemingly unlimited human wants in a world of limited resources.
Opportunity Cost
The value of the next best alternative that is forgone when a choice is made.
Production Possibility Curve (PPC)
A graphical representation that shows the maximum possible output combinations of two goods that can be produced with available resources.
Productive Resources
The inputs used in the production of goods and services, including land, labor, capital, and entrepreneurship.
Absolute Advantage
The ability of a party to produce more of a good or service with the same amount of resources than another party.
Based on raw data before calculations
Comparative Advantage
The ability of a party to produce a good or service at a lower opportunity cost than another party.
There will typically be 2 products that both countries produce. When doing opp cost, put cost of one product over the other product (undesired/desired)
EX: If Country A can produce 10 apples or 5 oranges, its opportunity cost of producing one orange is 2 apples. Conversely, if Country B can produce 8 apples or 4 oranges, its opportunity cost of producing one orange is 2 apples as well.
Law of Supply
Price & Supply = DIRECT relationship
as price increases, supply increases and vice versa.
Law of Demand
Prices & Demand = INVERSE relationship
As the price of a good decreases, the quantity demanded increases, and vice versa.
Equilibrium Price
The price at which the quantity demanded equals the quantity supplied.
Elasticity vs Inelasticity
Elasticity: Demand moves “freely” →CHOICE
Inelasticity: Demand does NOT move → NO CHOICE
Terms of Trade
The ratio at which one good can be exchanged for another, which must be mutually beneficial for both parties involved.
“Middle-ground” between opportunity costs
Artififical P Factor Models
These are theoretical frameworks that attempt to define and quantify the impact of price factors on the supply and demand in a market, often used to assess market efficiency.
Price Floor: UNofficial price ABOVE “E”; QD<QS = SURPLUS
Price Ceiling: BELOW “E”; QS < QD = SHORTAGE
Exact Amount
Difference between QD and QS
Determinants of Supply and Demand
Factors that influence the quantity of a good or service that producers are willing to supply and consumers are willing to purchase.
Supply: 1) changes in # of suppliers, 2) changes in tech, 3) changes in resource quality/availability, 4) changes in govt regulations, 5) expected future prices
Demand: 1) changes in consumer income (normal: brand name vs inferior: off-brand), 2) changes in consumer preferences, 3) changes in prices of related goods (substitute & complementary goods → INVERSE demand & DIRECT demand), 4) changes in population, 5) expected future prices.
What are the main problems in economy?
Increase in UNemployment %
Inflation %
3 Economic Theories
Classical/Austrian-School:
Free-market, Markets will self-correct, laissez-faire, concerned about LONG-RUN (Long-Run Self-Adjustment → LR Self-Adjustment)
Keynesian:
GOVERNMENT to fix economy, birth of deficit spending AKA increase in national debt, Great Depression, concerned about SHORT-RUN
Monetarism:
Aggregate Demand (AD)
Total/national Demand for ALL finished goods & services
How does AD SHIFT?
GDP! (ΔC/I/G/X/-M)
What is an AS/AD model?
LRAS = Long-Run Aggregate Supply
SRAS = Short-Run Aggregate Supply
AD = Aggregate Demand
Yfe = Full employment
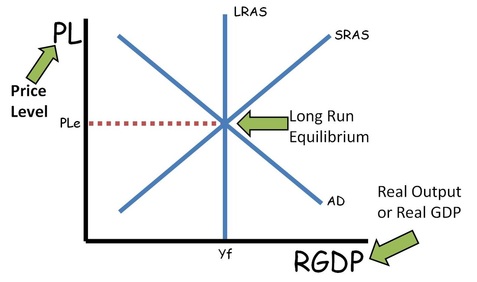
Long-Run vs Short-Run EQUILIBRIUM
LR Equilibrium = AD, SRAS, LRAS all in the MIDDLE/line up to Yfe
SR Equilibrium = NOT in the middle (AD crosses on SRAS middle)
OUTput vs INflationary Gap
OUTput gap = LEFT gap from equilirbium
INflationary gap = RIGHT gap from equilibrium
Fiscal Policy
OUTput gap = EXPANSIONARY fiscal policy (INCREASE Govt Spending OR DECREASE taxes)
INflationary gap = CONTRACTIONARY fiscal policy (DECREASE Govt Spending OR INCREASE taxes)
INCREASING G > DECREASING Taxes (Multiplier is BIGGER)
Fiscal Policy Formulas
MPC (marginal propensity to consume) = ΔC/ΔY → $Spent/$Given OR Have
MPC + MPS (marginal propensity to save) ≡ 1
G(x) (Govt Multiplier) = 1/1-MPC
T(x) (Tax Multiplier) = MPC/1-MPC
Can an increase in Govt spending change the NATURAL rate of unemployment?
NO; There will ALWAYS be a NATURAL rate of unemployment
How to find MPC from table:
find ΔY & ΔC from base values” AKA don’t worry about the thousands
EX:
ΔY ΔC
18 (,000) 19(,000)
22 (,000) 22(,000)
26 (,000) 25(,000)
ΔY = 8; ΔC = 6
→ 6/8 → MPC = 0.75
Do other countries’ income affect others?
YES!
If the countries are trading with each other, GDP is affected
EX:
Japan’s Income DECREASED, Demand for IMPORTS DECREASED → U.S.’ Aggregate Demand DECREASES for EXPORTS, GDP DECREASES
What do you do when both EXPANSIONARY & CONTRACTIONARY policy are applied?
Find the difference between the multiplied values
EX:
(-) $100B in G & (-) $100B in Taxes; MPC: 0.8, MPS: 0.2
G(x) = 1/0.2 = 5
T(x) = 0.8/0.2 = 4
$500B - $400B = $100B
Government DECREASED $100B
Aggregate Supply (AS)
TOTAL supply of G&S in an economy aka EVERY PRODUCER COMBINE
How does AS move?
NORMAL Supply shifts
LRAS (Long-Run Aggregate Supply)
@FULL employment/Efficient & MAX capacity (similar to PPC curve)
NOT temporary (will take long)
CHANGES if ECONOMY changes:
↑/↓ Capital
↑/↓Labor Force Size (ppl)
↑/↓Tech
↑/↓Human Capital (degree)
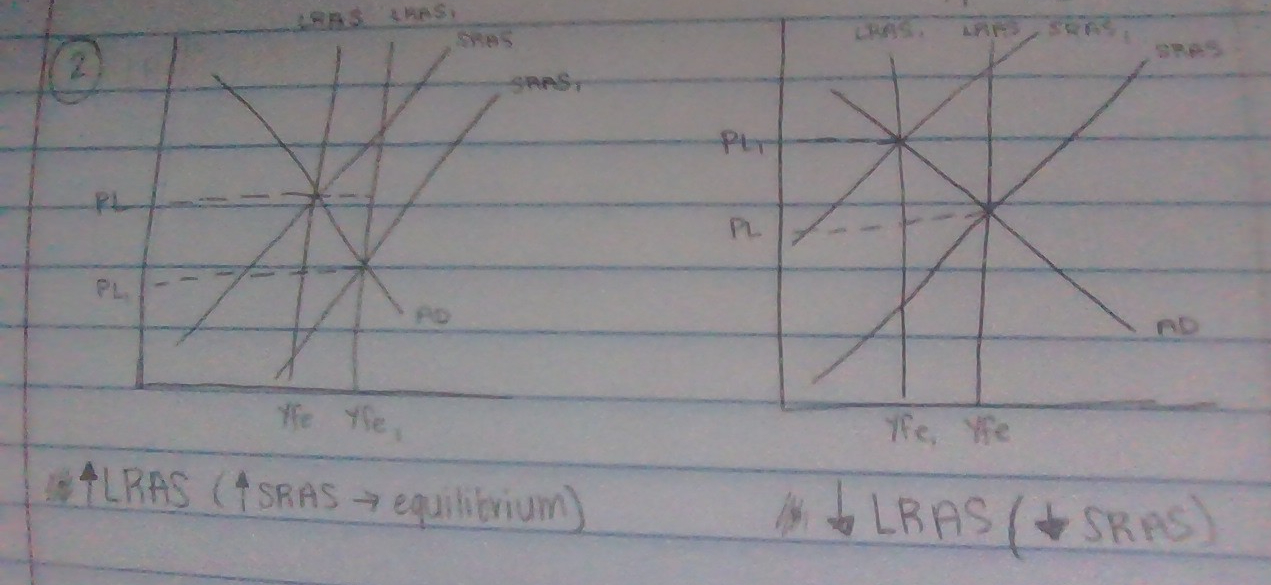
What happens when ↑/↓ LRAS?
↑ LRAS (↑ SRAS → equilibrium → ↓PL)
↓ LRAS (↓ SRAS → equilibrium → ↑PL)
SRAS (Short-Run Aggregate Supply)
TEMPORARY
typically from ↑ UNemployment % OR ↑ Inflation %
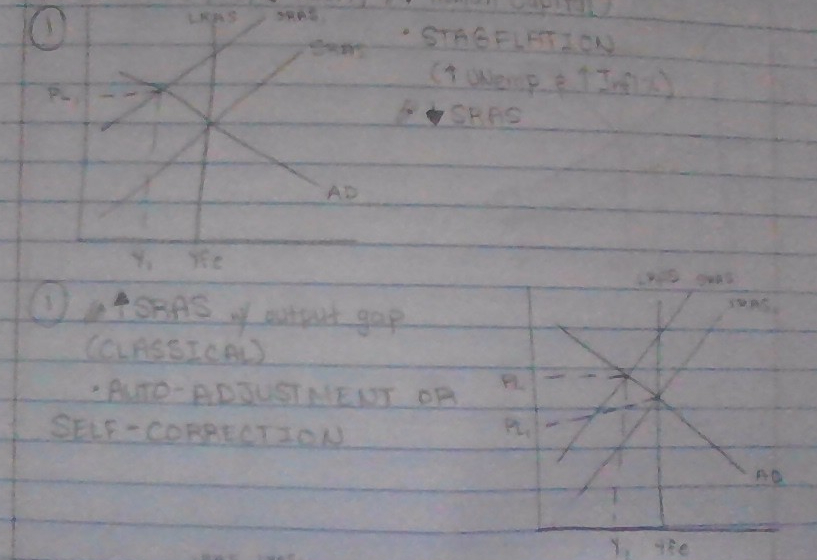
What happens when ↑/↓ SRAS
↓ SRAS → STAGFLATION (↑UNemp & ↑ Infl)
ALSO called (-) supply shock
↑ SRAS → Auto-Adjustment/Self-Correction
When given a table of SAVINGS
CALCULATE MPS!!
EX:
Savings: 2,000 → 2,200
Disposable Income: 10,000 → 12,000
(2,200-2,000)/(12,000-10,000) = 0.1 (MPS) → MPC = 0.9
When do I multiply or divide the multiplier?
MULTIPLY:
Finding TOTAL Δ AD or MAXIMUM Δ
DIVIDE:
Finding MINIMUM Δ AD
Automatic Stablizers
mechanisms built into budget that keep economy from going from 100% → 0% (EX: tax rate, welfare, UNemployment insurance/$$)
FISCAL policies
When PL ↓…
Nominal wages ↓
Monetary Policy
Central bank actions to control money supply and interest rates (to fight UNemployment & Inflation)
Money Multiplier
mm = 1/Reserve Ratio
Multiply: to find MAXIMUM change in Money Supply (MS)
Divide: to find MINIMUM change in Money Supply (MS)
Expansionary vs Contractionary Monetary Policy
Expansionary: INCREASES MS —> DECREASE interest rates —> INCREASES PL (price levels)
BUY bonds in O.M.O (open market operations), DECREASE discount rate & reserve requirement
Contractionary: DECREASES MS —> INCREASE interest rates —> DECREASES PL (price levels)
SELL bonds in OMO, INCREASE discount rate & reserve requirement
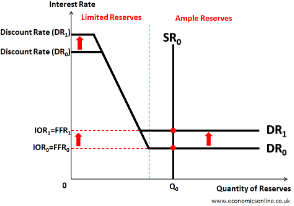
Limited Reserves
banks are REQUIRED to have a reserve requirement (RR%) and/or excess reserves (ER)
What are bonds?
Temporary loan to a firm/government to earn i% (interest rates) OVERTIME (money will GROW/SLOW)
Relationship between bonds and i%
INVERSE!! As interest rates RISE, bond prices FALL and vice versa
M0 - M3
M0 (monetary base/money base): CASH & deposits @FED (federal reserve/central bank)
M1: M0 + savings acct
M2: M1 + SMALL deposits ($ < 100K)
M3: M2 + LARGE deposits (100K +)
MOST liquid to LESS liquid
Fractional Reserve Banking
KEEP fraction of $, REST is loaned with i%
Bank to bank loan each other EXCESS RESERVES
RR (required reserve): percentage of money deposited in acct
“NEW” $: bonds, NOT cash; MS will change by 100%
“OLD” $: CASH; MS will change by MAXIMUM $ - original
Liabilities: OWED $
Assets: OWNS $

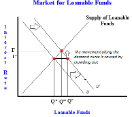
Loanable Funds Market
THEORY
LFS (Loanable Funds Supply) shifts when:
↑/↓ household savings
↑/↓ business profit
↑/↓ Govt surplus
↑/↓ foreign invest
LFD (Loanable Funds Demand) shifts when:
↑/↓ household consumption
↑/↓ business spending
↑/↓ Govt spending
↑/↓ foreign demand
Affects BOTH r% (real interest rates) & $ of loans
#1 Example of LFM (Loanable Funds Market)
Govt crowding out
Real = …
nominal i% - expected inflation = real (adjusted for inflation)
↑/↓ Capital Formation/Shock
↑/↓ Long-run growth = ↑/↓ investment
Ample Reserves
keep reserves @ FED/earn i%; RR = 0% {post 2008 econ. crisis)
Shift Demand?
↑/↓ IOR (interest on reserves): interest rates that FED pays banks to KEEP reserves
↑ IOR = ↓ Demand (EXPANSIONARY)
↓ IOR = ↑ Demand (Contractionary)
Δ (X-M) =
Δ AD
↑ X/ ↓M = ↑ AD
↓ X/ ↑M = ↓ AD
F.O.R.E.X.
currency exchange/global transactions happen every milisecond
Exchange Rate
the price of 1 nation’s currency in terms of another
SIMPLER WORDS: How much of their $ will my $ buy?
2 Different Types of Currency Value
1) Appreciation (+): currency is STRONGER, ↓ X (- AD)/↑M OR ↑ r (real interest rates) —> inflow
2) Depreciation (-): currency is WEAKER, ↑X (+ AD)/ ↓M OR ↓ r —> outflow