AP MACROECONOMICS: UNIT 3 NATIONAL INCOME AND PRICE DETERMINATION
1/58
Earn XP
Description and Tags
Name | Mastery | Learn | Test | Matching | Spaced | Call with Kai |
|---|
No analytics yet
Send a link to your students to track their progress
59 Terms
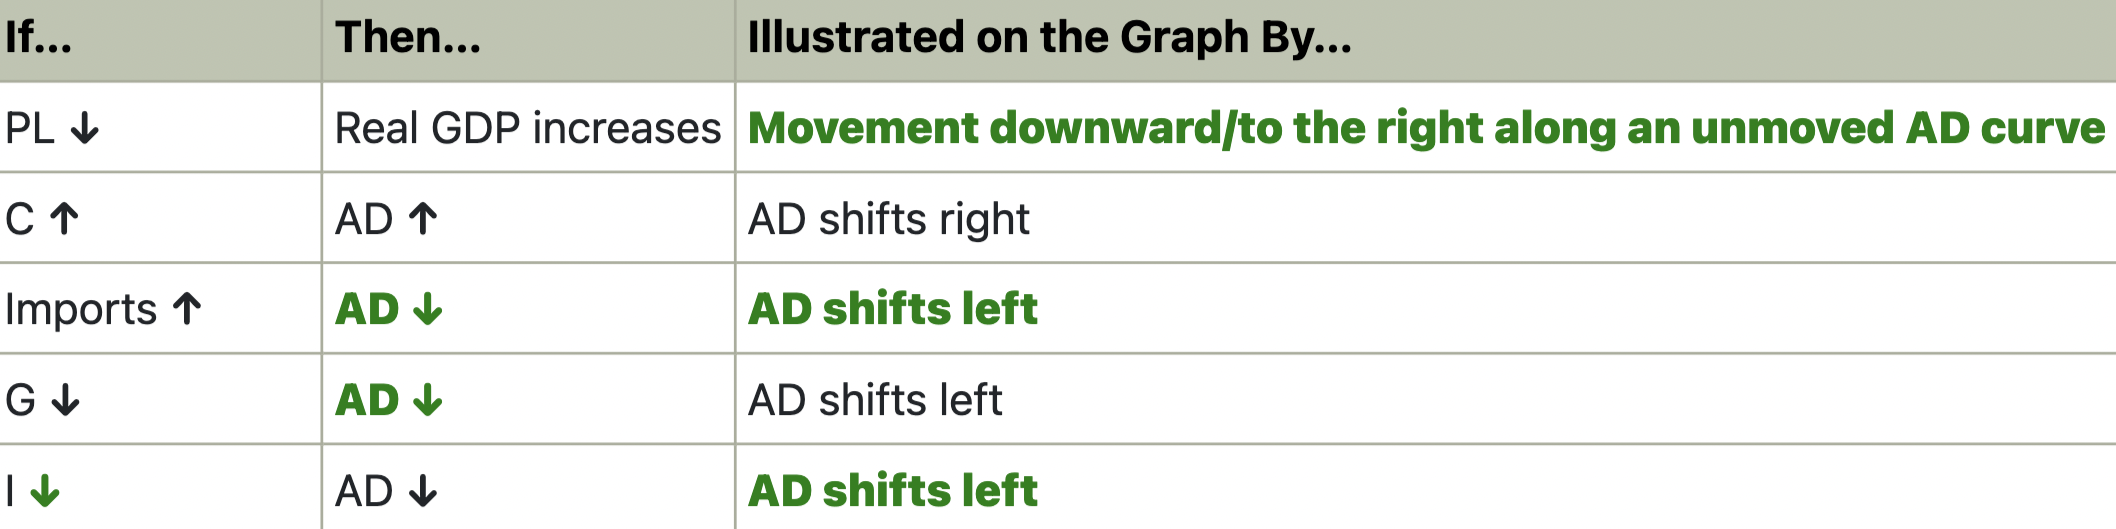
Aggregate Demand
A model that shows the different quantities of real output demanded in a whole economy at different composite price levels.
Price Level
The aggregation (not average) of all prices in an economy using a price index.
Real Wealth Effect
Changes in the price level affect the real value of consumer assets (like houses, savings, investments) in the opposite direction.
Interest Rate Effect
The price level directly impacts the interest rate that banks charge to borrowers, which in turn effects changes in business investment and consumption loans.
Foreign Trade Effect
As the domestic price level falls, ceteris paribus, more will be exported and less will be imported, causing net exports to rise.
INFO CHART
Autonomous Expenditure
The spending consumers must do even if they have zero disposable income; spending that is independent of an increase in income, in contrast to induced spending.
Induced Expenditure
Spending that is the direct result of an increase in income.
Marginal Propensity to Consume
The fraction of each additional dollar of income that households will spend, expressed as a number between 0 and 1.
Marginal Propensity to Save
The fraction of each additional dollar of income that households will save, expressed as a number between 0 and 1.
Spending Multiplier
The principle that any autonomous expenditure will result in a change in aggregate demand by a maximum value of the expenditure multiplied by 1/MPS, or the inverse of the marginal propensity to consume.
Tax Multiplier
The principle that any change in taxes will result in a change in aggregate demand up to the dollar value of the tax change multiplied by MPC/MPS, or the marginal propensity to consume divided by the marginal propensity to save; the impact is negative.
Short-Run Aggregate Supply (SRAS)
The relationship between price level and the total value of goods and services supplied in an economy in a period in which some input costs are fixed.
Sticky Wages
Inflexible prices for labor; the idea that a variety of factors prevent wages from responding directly to changes in market conditions.
Menu Costs
All the supplier costs associated with changing prices, the classic example being the cost of printing new restaurant menus due to entrée price changes.
Productivity Changes
Any of the factors of production (think robotics, increased literacy, etc… improvements in productivity will shift SRAS to the right while loss of productivity will shift SRAS left).
Input Price Changes
(Anything that makes land, labor, and/or capital more or less expensive … higher input prices, like the wage rate, will shift SRAS to the left while lower machinery prices will shift SRAS to the right).
Expected Changes in Inflation
(If suppliers think the price level is headed up, they'll produce less or wait, shifting SRAS left; they will have greater profitability after the price level increases. If they think inflation is slowing down or that there could be deflation, they'll produce more, shifting SRAS right; they will have greater profitability producing now rather than after the price level falls.)
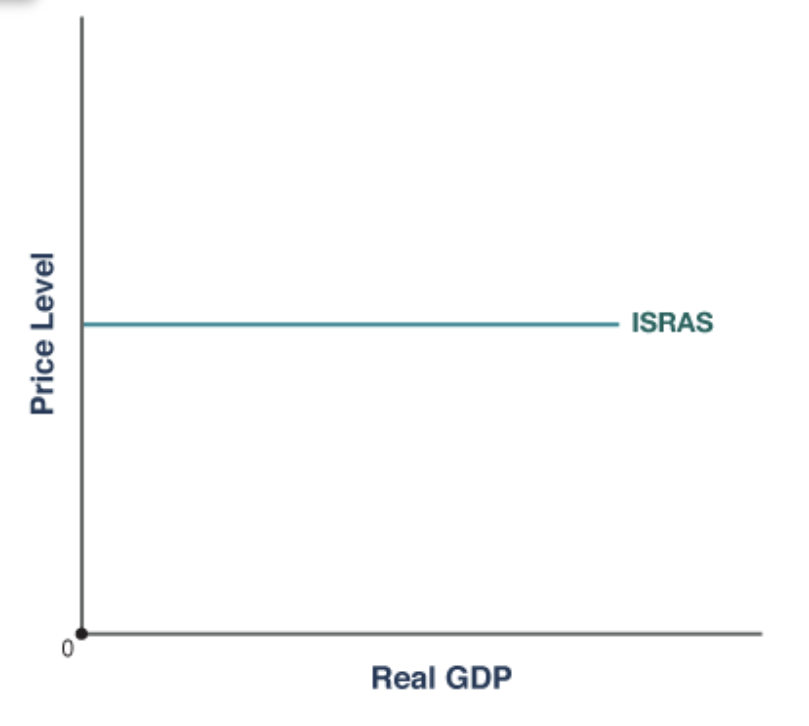
Immediate Short-Run Aggregate Supply (ISRAS)
It reflects that shortest timescale (think lunch rush) when both input and output prices are fixed, and the only determinant of real GDP is aggregate demand.
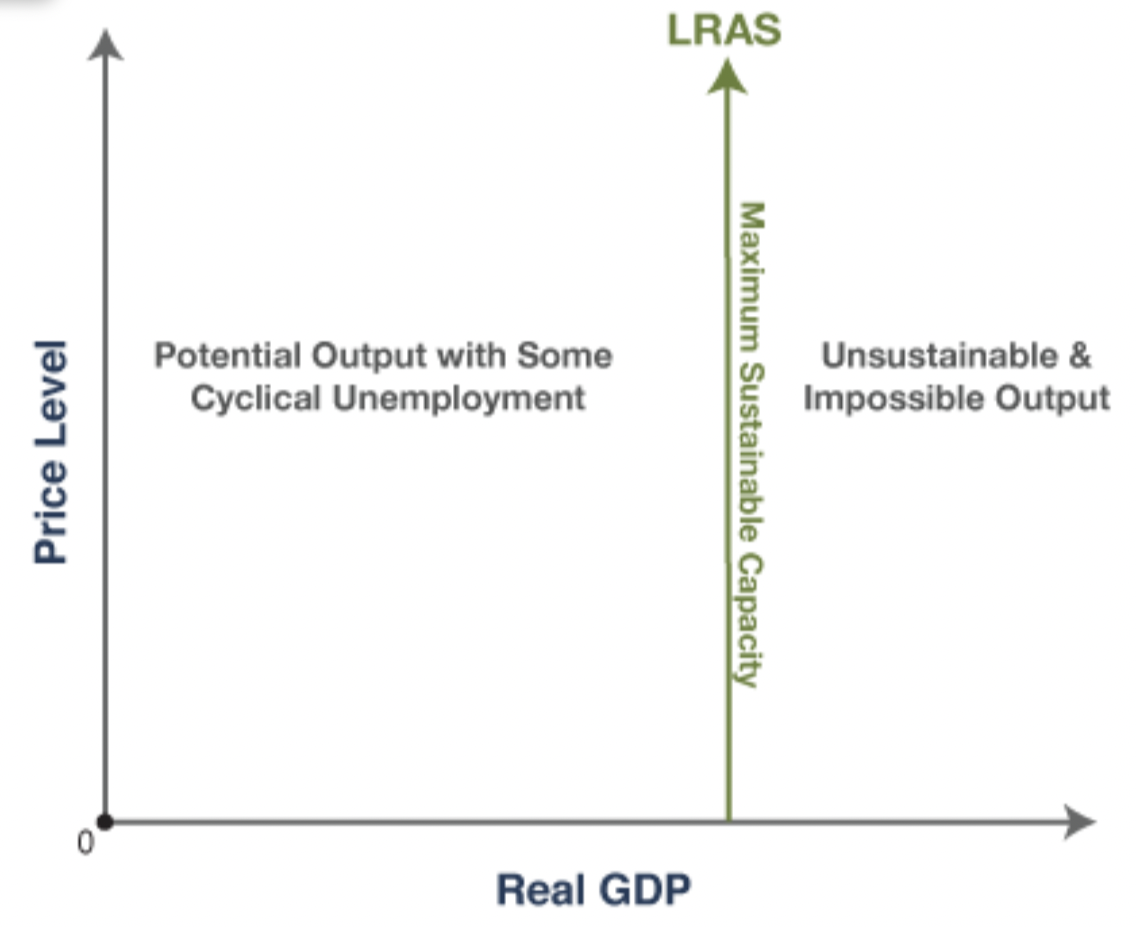
Maximum Sustainable Capacity
The aggregate output of the economy when at full employment of resources; real GDP at LRAS.
Long-Run Aggregate Supply (LRAS)
The maximum sustainable aggregate output in an economy when all prices, costs, and wages are flexible, represented by a vertical on the AD–AS model.
Three Output Ranges
ISRAS
resource costs AND prices charged to consumers are fixed Shape: —
SRAS
resource costs are fixed or very sticky, and prices charged to consumers are flexible Shape: /
LRAS
resource costs AND prices charged to consumers are flexible Shape: |
LRAS shifts to the right (increases) when there is …
more labor force participation
more capital available
more natural resources available
better human capital (education/training)
technological progress/growth in productivity
reduced business regulation
CONNECTIONS
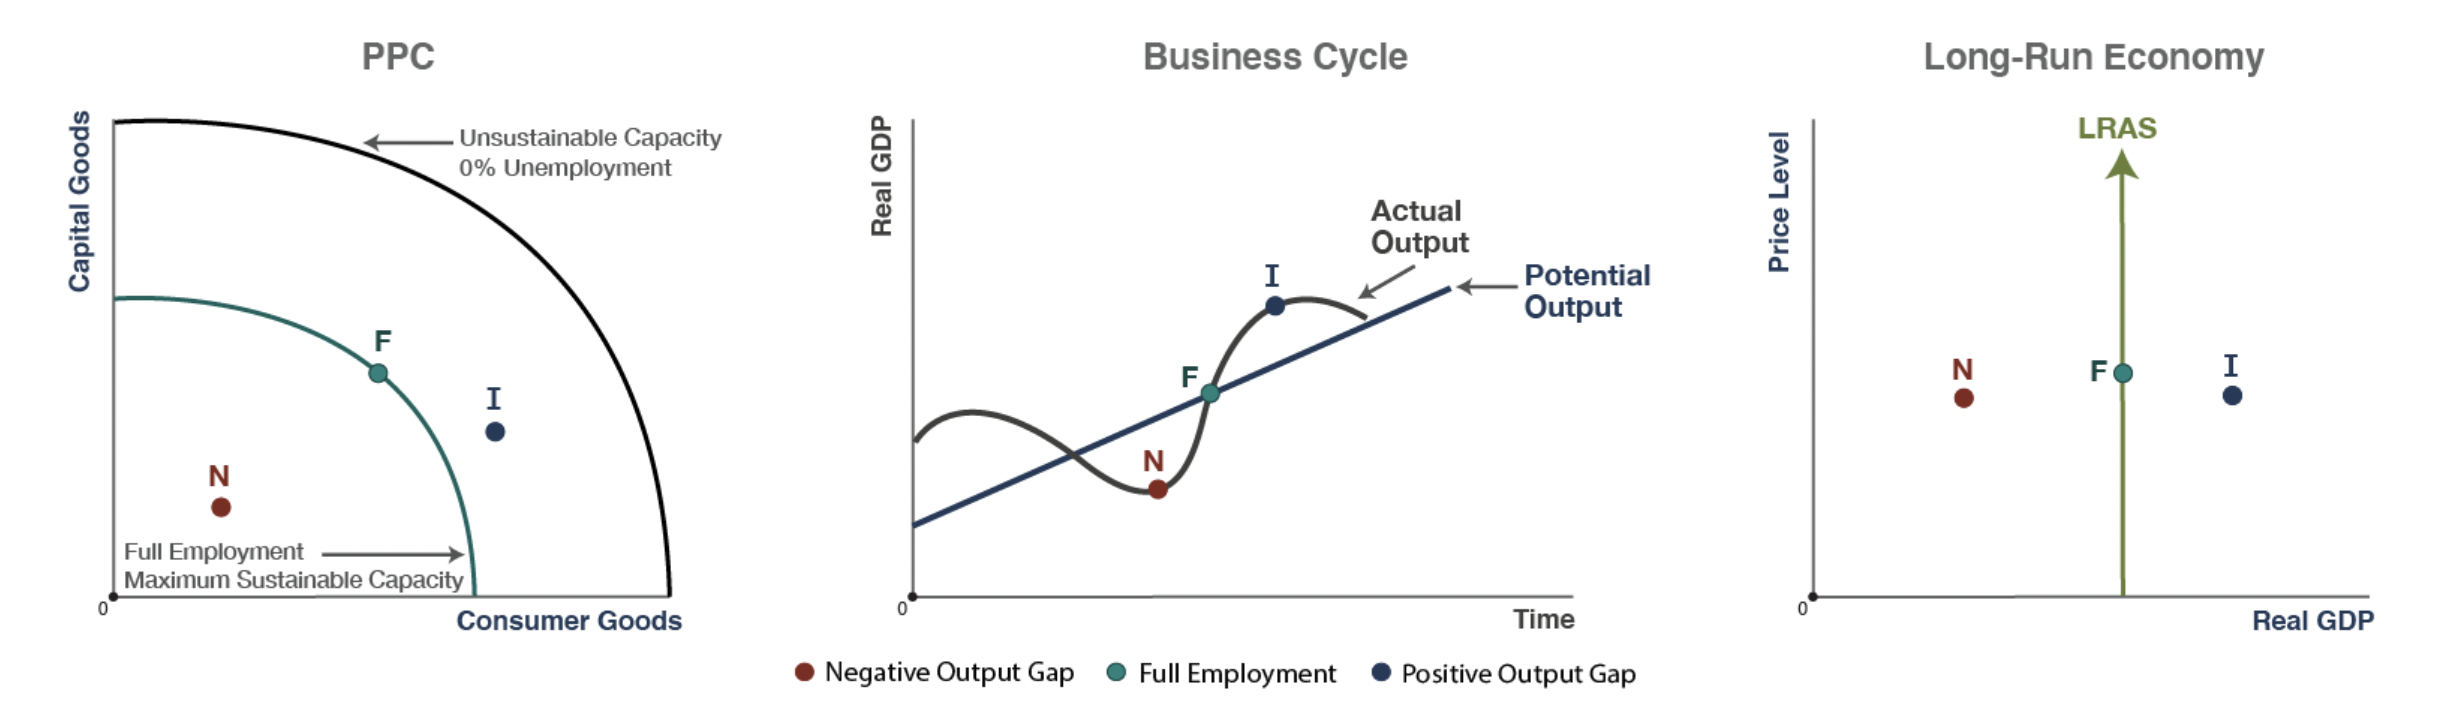
AD-AS Model
Model that shows the downward-sloped aggregate demand curve, upward-sloping short-run aggregate supply, and the vertical long-run aggregate supply, illustrating a negative output gap, full employment, or an inflationary gap.
Short-Run Equilibrium
The intersection point of aggregate demand and the short-run aggregate supply curve, which sets the equilibrium price level and aggregate output in the economy.
Long-Run Equilibrium
The equilibrium price level and aggregate output with full employment, indicated by the intersection of aggregate demand, short-run aggregate supply, and long-run aggregate supply at the same point.
Positive Demand Shock
A shift of the aggregate demand curve to the right.
Negative Demand Shock
A shift of the aggregate demand curve to the left.
Positive Supply Shock
A shift of the short-run aggregate supply curve to the right.
Negative Supply Shock
A shift of the short-run aggregate supply curve to the left.
Demand-Pull Inflation
A situation in which a rightward shift of aggregate demand pulls the price level in an economy up.
Cost-Push Inflation
When a leftward shift of the short-run aggregate supply curve pushes the price level in an economy up.
Stagflation
A situation in which an economy experiences high unemployment and high inflation, so economic stagnation and inflation, most often caused by a negative supply shock.
Disinflation
Slowing of the rate of inflation, NOT a decrease in price level (that’s depression!)
Fiscal Policy
Use of government taxing or spending legislation to impact the price level, aggregate demand, and real output of an economy.
Government spending multiplier is STRONGER than the tax multiplier.
Tax changes are less powerful than spending changes to address a recessionary gap.
Expansionary Fiscal Policy
Any government policy with the goal of reducing unemployment and increasing economic growth.
Contractionary Fiscal Policy
Any government policy with the goal of lowering the inflation rate.
Recognition Lag
The time it takes for policymakers to recognize a problem.
Administrative Lag
The time it takes to achieve consensus on the policy that will help to fix it.
Operational Lag
This time for execution, or carrying out of the policy action.
Discretionary Spending
Government spending enacted through a legislative bill setting a specific dollar amount for a certain purpose.
Mandatory Spending
Government spending that is determined by existing legislation and the number of eligible recipients.
Automatic Stabilizers
Mechanism of existing government policy where tax revenues and safety net spending adjust reflexively in response to fluctuations in the business cycle.
Social Service Programs
Government, institutional, or agency policies that provide assistance to people in need, often called "safety net programs"; transfer payments in these programs act as automatic stabilizers in the economy.
Transfer Payment
Money granted by the government to households to influence their behavior in some way; income redistributed by the government.
Regressive Tax Structure
System in which a person pays a lower percentage of their income as their income increases.
Proportional Tax Structure
A system in which a person's tax burden increases at the same rate as their income.
Progressive Tax Structure
A system in which a person pays a higher percentage of their income in taxes as their income increases.
Tax Bracket
In a progressive system, a defined range of incomes that are taxed at a certain rate.
Tax Revenues
The dollar value government collects in various forms of taxes, not to be confused with the tax rates which determine how much is collected; tax revenues automatically adjust in response to economic fluctuations.
During a recession…
Tax revenues automatically decrease as the GDP decreases, which has the tax multiplier effect of helping consumption and lessening the severity of recession.
During an inflationary period…
Tax revenues automatically increase as the GDP increases, slowing consumption down and keeping the economy from overheating.
Two main types of automatic stabilizers
Social service ("safety net") programs and taxes (especially the progressive income tax).
THE DIFFERENCE!
TAX RATE IS %, WHILE TAX REVENUE IS THE AMOUNT PAID TO THE GOVT!