SE385
1/46
There's no tags or description
Looks like no tags are added yet.
Name | Mastery | Learn | Test | Matching | Spaced | Call with Kai |
|---|
No analytics yet
Send a link to your students to track their progress
47 Terms
Definition of decision
An irrevocable allocation of resources where once a choice is made, it cannot be reversed.
Definition of Good decision
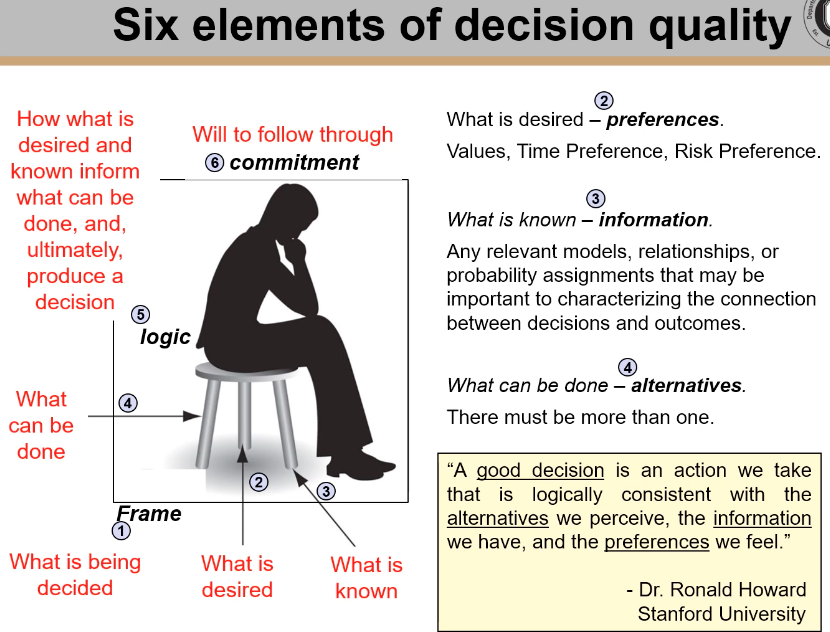
A good decision is an action we take that is logically consistent with the alternatives we perceive, the information we have, and the preferences we feel.
6 basic elements of decision quality (FPIALC)
Frame,
preferences,
information,
alternatives,
logic
commitment.
Definition of Decision Analysis
A set of tools used to ensure the best decisions are made to increase the likelihood of positive outcomes.
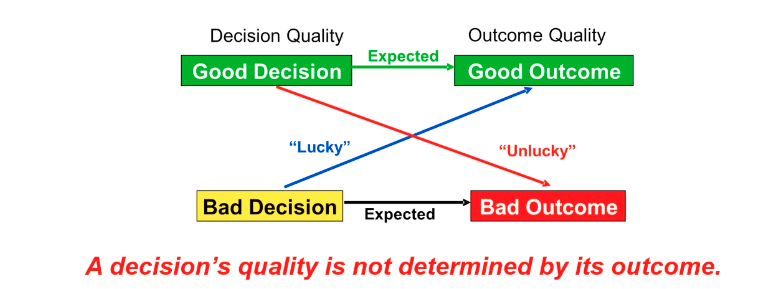
Difference between good decisions and good outcomes
A good decision is the process of making a well-thought-out choice based on analysis and tools like decision analysis. It involves considering factors like frame, preferences, information, alternatives, logic, and commitment. On the other hand, a good outcome is the result of a decision, which may not always align with the decision quality due to factors like luck. Making a good decision increases the likelihood of a good outcome, but it is not guaranteed.
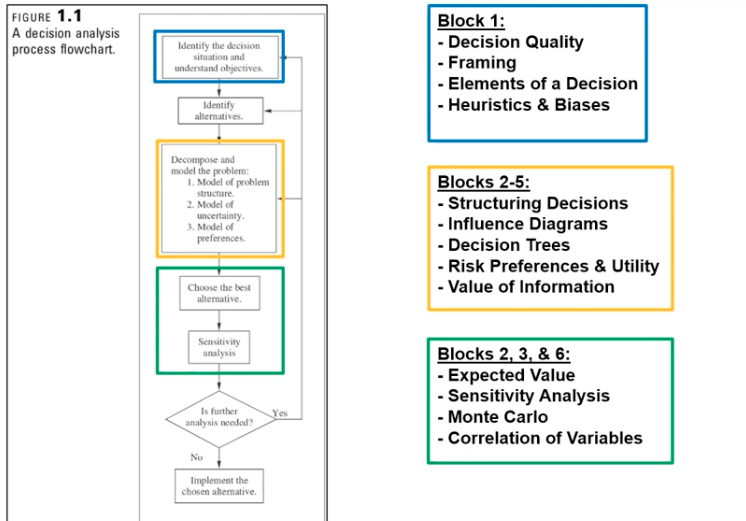
Explain the decision analysis process flow chart and explain the decision analysis process
The decision analysis process flowchart involves several steps:
1. Identify the decision situation and objectives.
2. Identify alternatives.
3. Decompose the problem.
4. Choose the best alternative.
5. Conduct sensitivity analysis.
6. Decide if more analysis is needed. If yes, repeat the process; if not, implement the chosen alternative.
Decision analysis is a toolset to ensure optimal decision-making by considering factors like frame, preferences, information, alternatives, logic, and commitment.
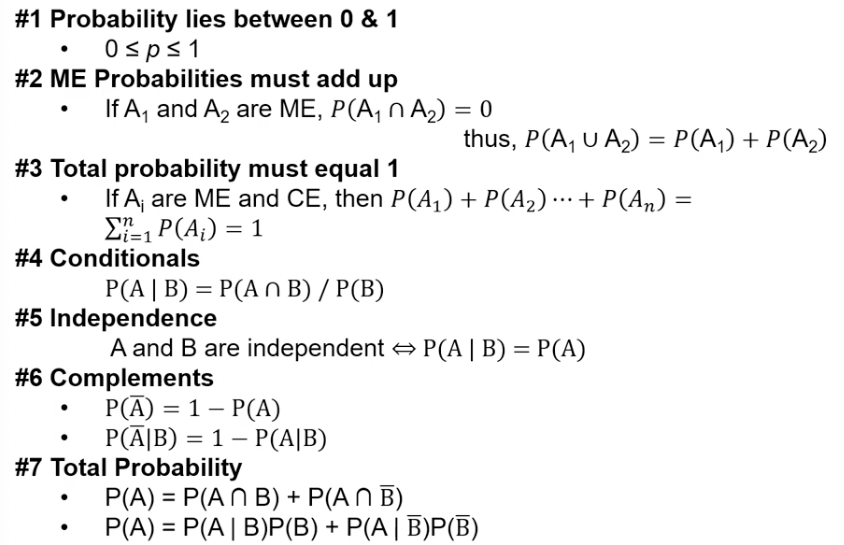
7 Probability Rules
1. Probabilities must be between zero and one.
2. Mutually exclusive probabilities must add up.
3. Total probabilities must equal one for them to be collectively exhaustive.
4. For conditional probabilities, the probability of A given B is the intersection of A and B divided by the probability of B.
5. If A and B are independent, the probability of A given B is the same as the probability of A.
6. The complement rule: probability of not A is 1 minus the probability of A.
7. Total probabilities rule: probability of A is equal to the probability of A intersect B plus the probability of A intersecting not B.
What are the three types of probability used to express uncertainty in decision analysis
Joint, Conditional, Marginal
Joint Probability
Joint probability refers to the probability of two events happening simultaneously.
Conditional Probability
Conditional probability is the likelihood of an event occurring given that another event has already occurred.
Marginal Probability
Marginal probability is the probability of a single event without considering any other events.
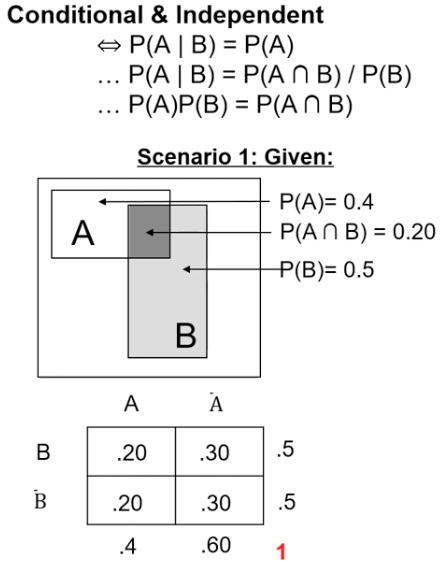
Conditional and Independent
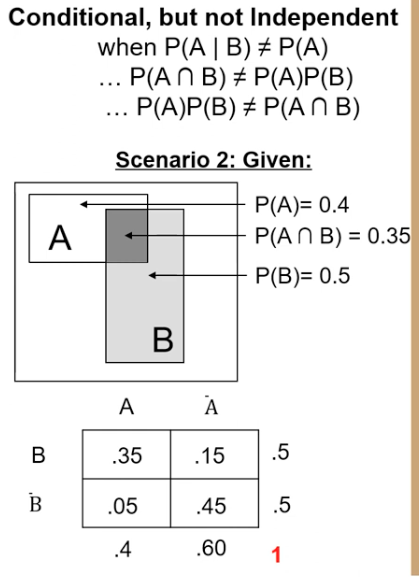
Conditional, but not independent
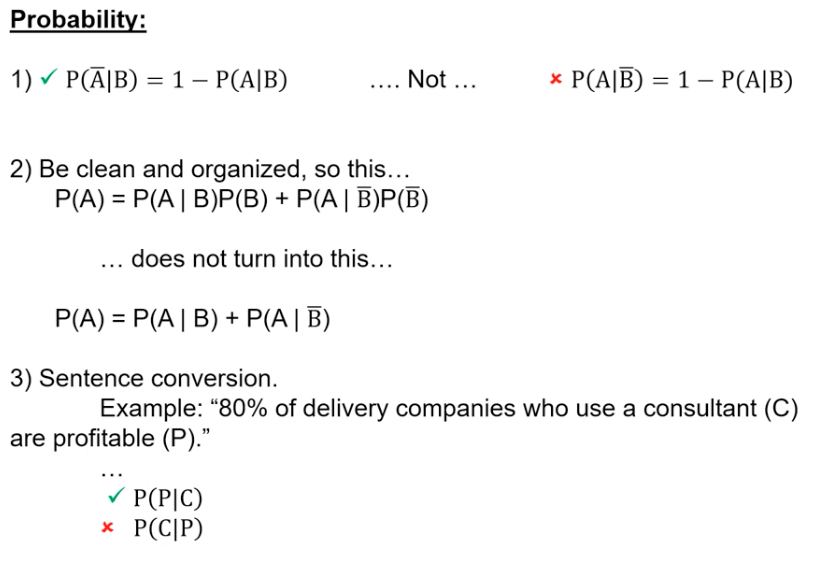
Common Mistakes
Key Probability Formula what is the main one for Joint, Conditional, and Marginal
Key Formulas
Joint Probability:
P(A and B) = P(A|B) P(B) OR P(B|A) P(A)
Conditional Probability:
P(A|B) = P(A and B) / P(B)
Marginal Probability: Found by summing joint probabilities across a row or column in a probability table (described below).
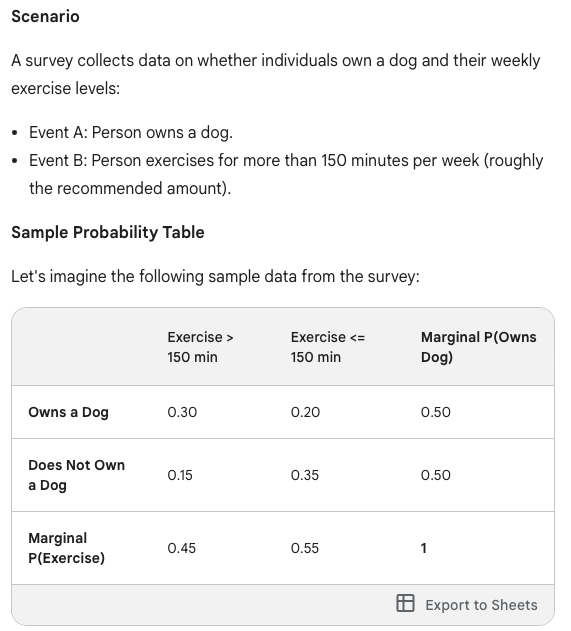
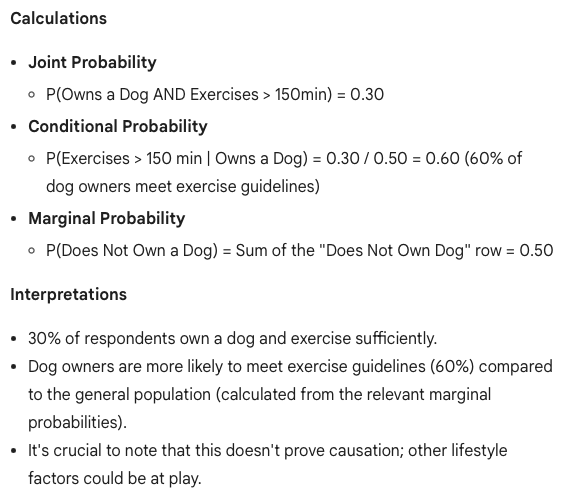
Example of Probability Calculation
Joint Probability
P(Owns a Dog AND Exercises > 150min) = 0.30
Conditional Probability
P(Exercises > 150 min | Owns a Dog) = 0.30 / 0.50 = 0.60 (60% of dog owners meet exercise guidelines)
Marginal Probability
P(Does Not Own a Dog) = Sum of the "Does Not Own Dog" row = 0.50
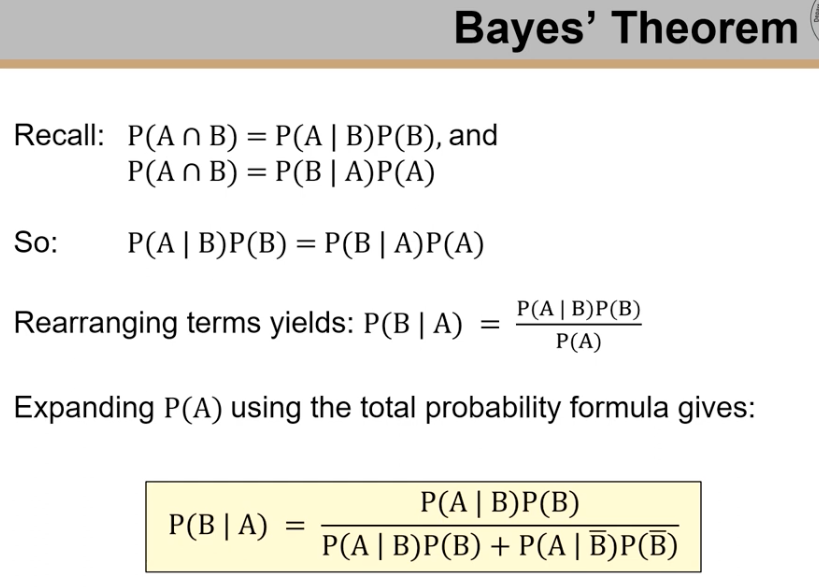
Bayes Theorem
Bayes' theorem calculates the probability of an event happening based on prior knowledge of conditions related to the event. It involves finding the probability of event A given event B, using the probability of event B given event A, along with the individual probabilities of events A and B. The formula is: P(A|B) = P(B|A) * P(A) / P(B).
Steps to Modeling a decision problem
Identify the values and objectives
Structure the elements into logical frameworks
Refinement
Identify the values and objectives
Identify the fundamental objective first
Determine how they will be measured via an attribute scale
Natural ($ profit)
Artificial
Proxy(GPA)
Constructed (1-5 star rating, scale)
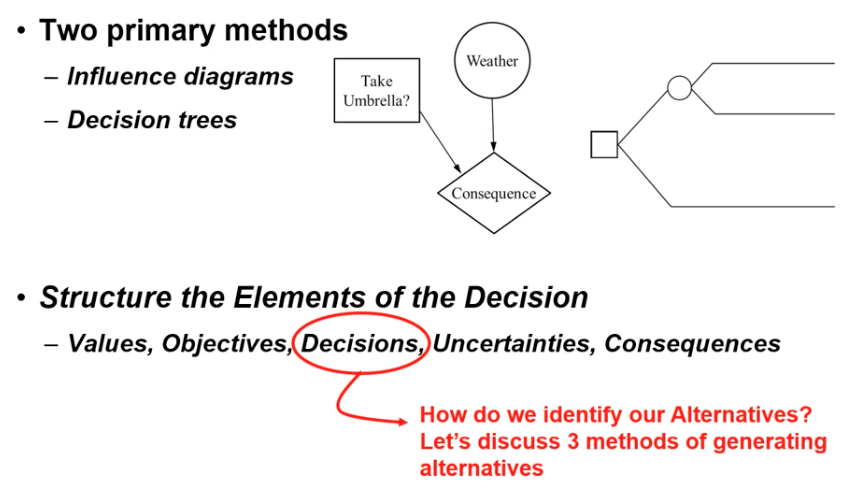
3 Value Focused Thinking Approaches to creating alternatives
Fundamental Objective/Value Hierarchy
Bottom up understands values + objectives to make decisions focused on them
Means-Objective Network
Provides guidance on what to do to accomplish the Fundamental Objective
Strategy Table
Used when alternatives are complex and numerous
The importance of creating distinctions in Decision Analysis and how the clarity test assists in this process
Given perfect information about all aspects of the decision, is it possible to tell exactly what happened at every node. with no interpretation or judgement?
Structure the elements into a logical framework
Primary methods
Influence diagrams
Decision trees
Elements of a decision
Values/ Objectives
Decisions
Uncertainties
Consequences
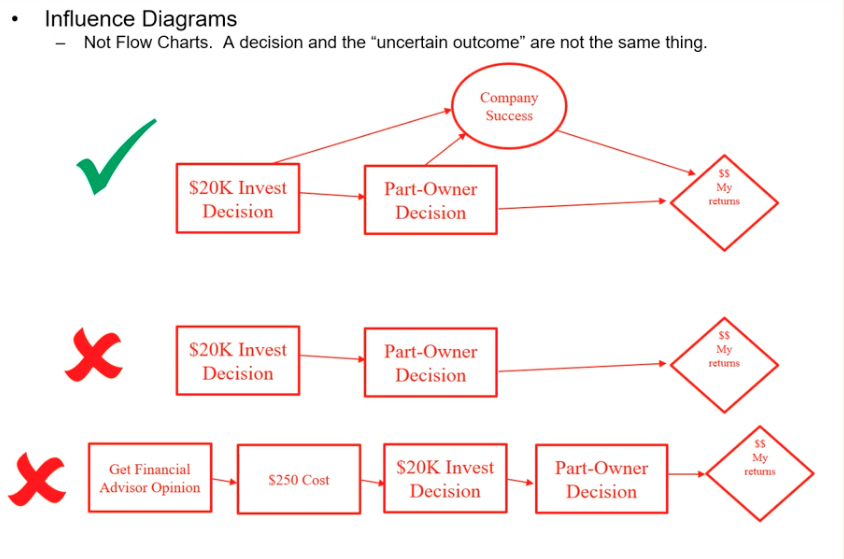
Influence Diagrams
Graphical representations that show the relationships between different variables or nodes in a decision-making process.
Rules of Influence Diagrams
No loops
One value measure
Directed path to only decision nodes
Four Elements of a decision
Values/ Objectives
Decisions
Uncertainties
Consequences
Decision Context
When facing a difficult decision a decision maker must identify his or her relevant objectives to avoid focusing on irrelevant issues.
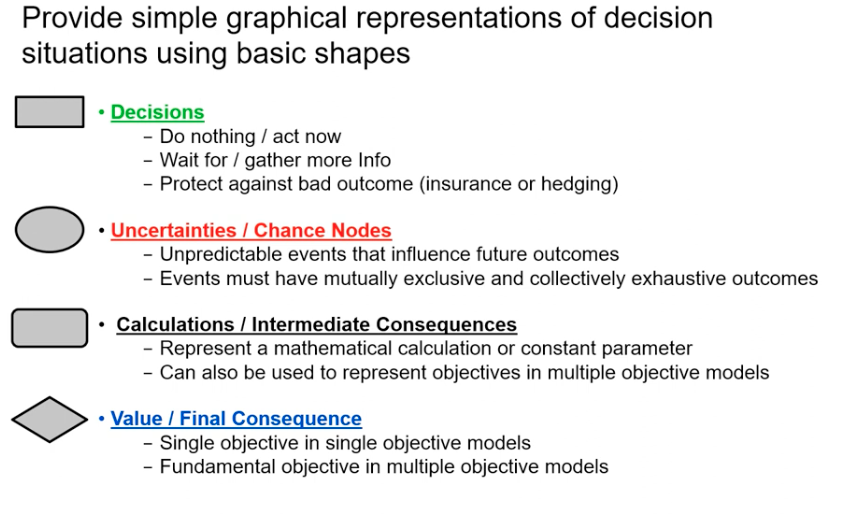
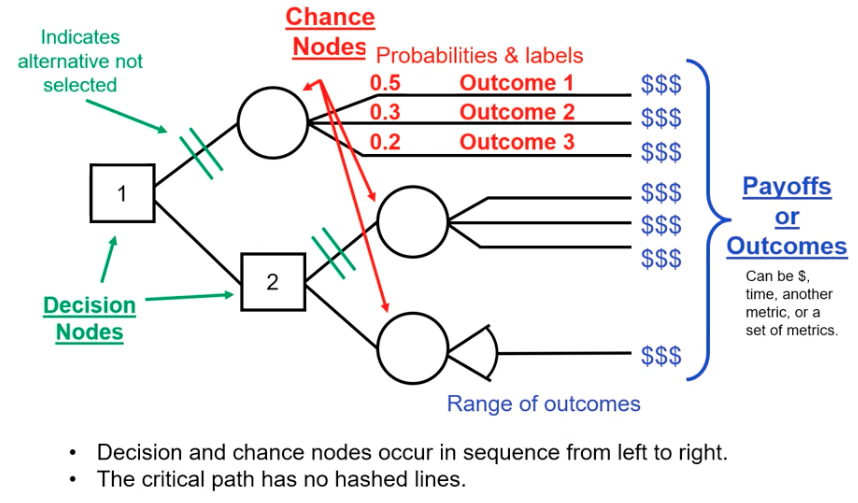
Decision Node
Do nothing / act now
Wait for / gather information
Protect against bad outcome

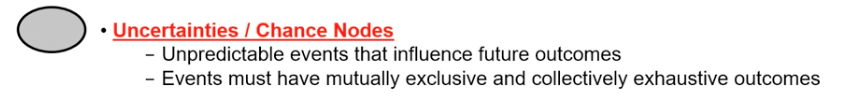
Uncertainty Node
Unpredictable events that influence future outcomes
Events must have mutually exclusive and collectively exhaustive outcomes
Calculation Node
Represents a mathematical calculation or constant parameter
Can also be used to represent objectives in multiple objective models

Value / Final Consequence Node
Single objective in single objective model
Fundamental objective in multiple objective model

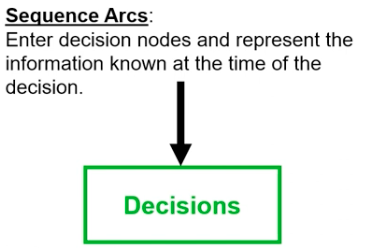
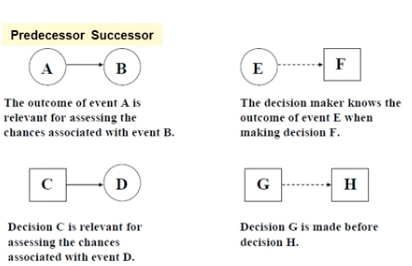
Sequence Arc
Only enters a decision node and represents that information known at the time of the decision
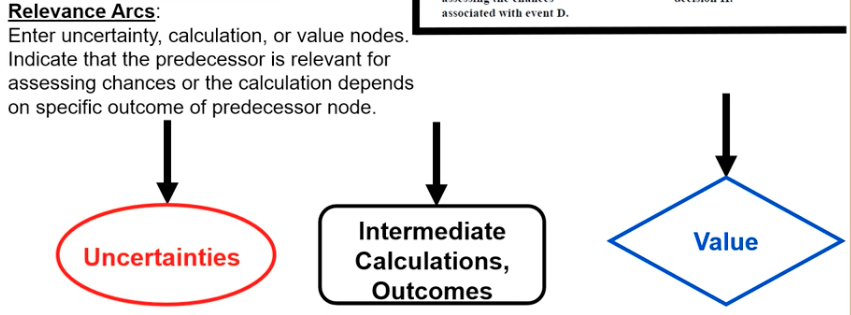
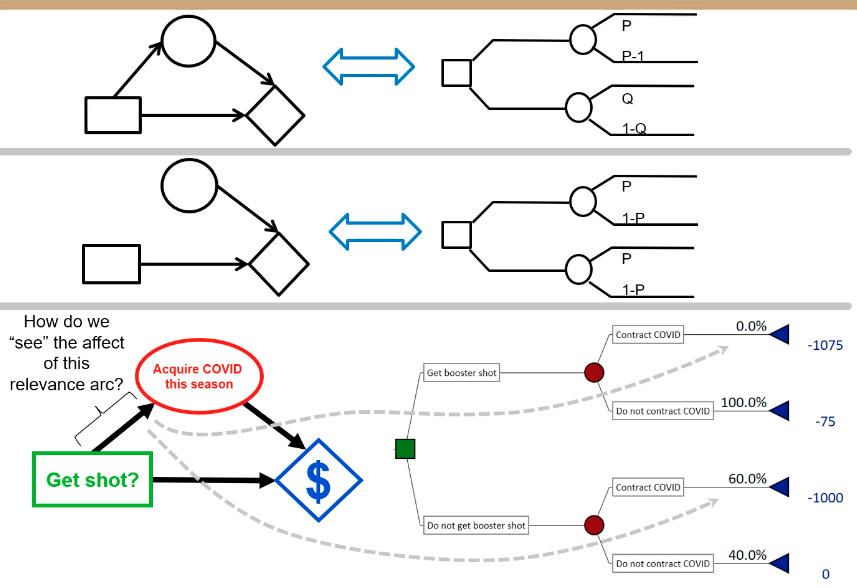
Relevant Arc
Enter uncertainty, calculation, or value nodes. Indicates that the predecessor is relevant for assessing chances or the calculation depends on specific outcome of predecessor node.
Predecessor and Successor arcs
Common Mistakes of Influence Diagrams
Always have uncertainty nodes
Decision Tree Basics
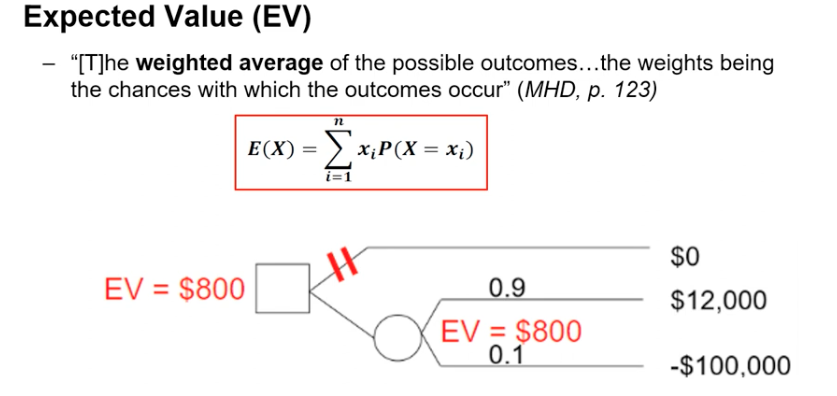
Definition of Expected Value
The weighted average of the possible outcomes the weights being the chances with which the outcome occur.
Similarities and differences of influence diagrams and decision trees
Influence diagrams visually show relationships between nodes, aiding in understanding complex decision-making scenarios. They depict connections between decision, uncertainty, and consequence nodes, helping decision-makers grasp interdependencies.
Decision trees, on the other hand, are simpler and more straightforward, presenting a series of decision and chance nodes that lead to different outcomes based on probabilities. Decision trees are easier to navigate and calculate optimal paths, making them useful for quick decision-making. Influence diagrams excel at illustrating relationships and dependencies, making them beneficial for analyzing complex decision cases with multiple objectives.
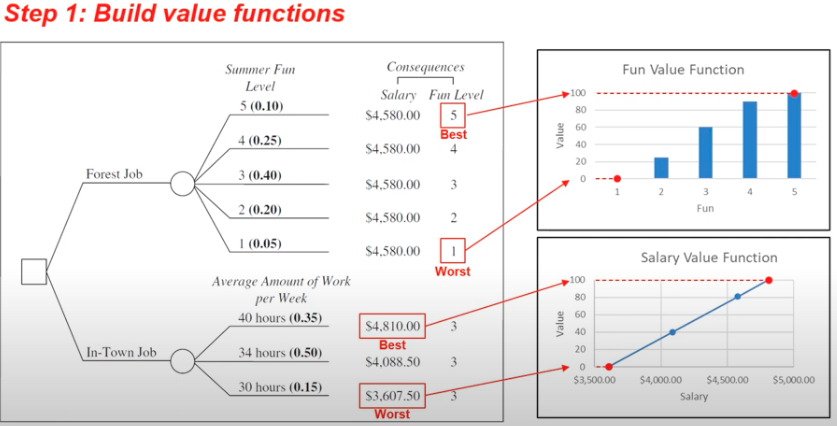
Steps to Solving a Decision tree with multiple objectives
Build value functions
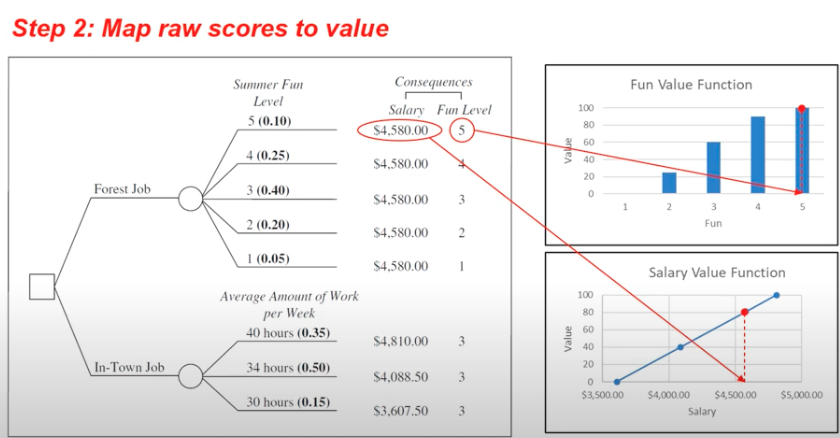
Map Raw scores to value
Assess trade-offs with swing weights
Calculate overall value scores, fold back the tree and select the alternative with the highest expected value
Step 1: Build value functions
Step 2: Map raw scores to value
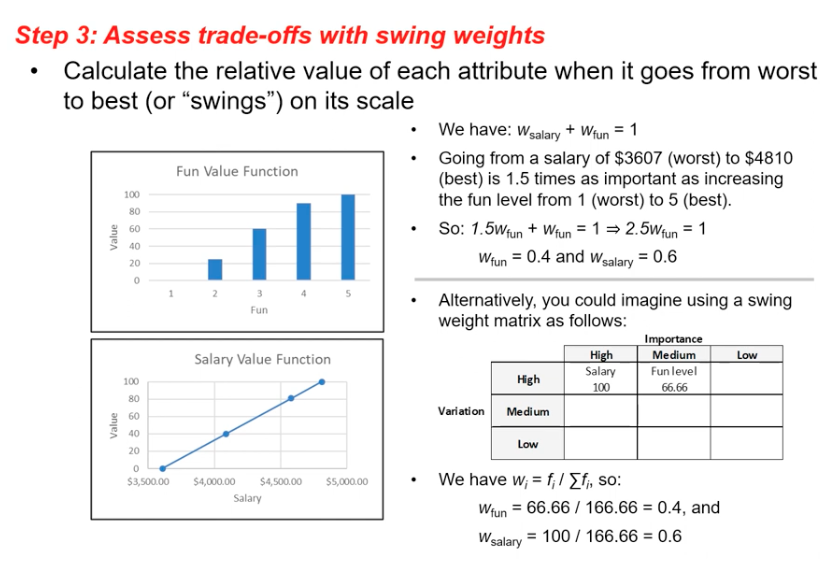
Step 3: Assess trade-offs with swing weights
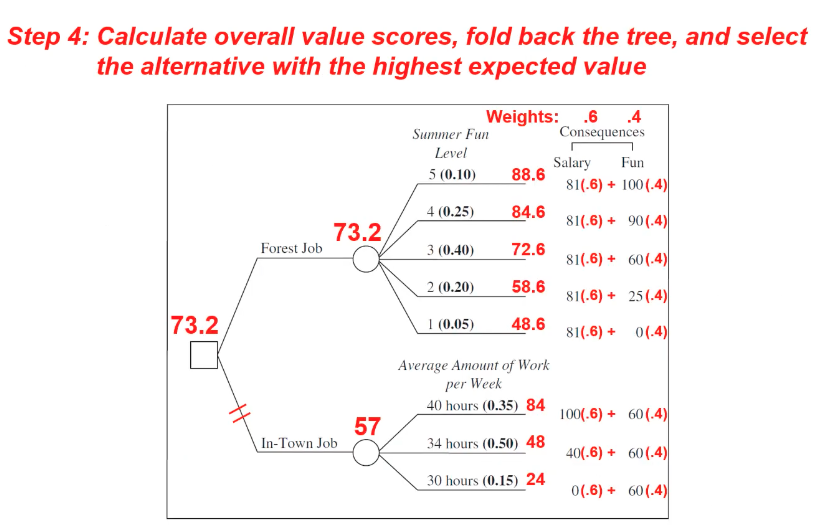
Step 4: Calculate overall value scores, fold back the tree and select the alternative with the highest expected value
Converting a influence diagram into a decision tree
Sensitivity Analysis
A technique used to determine how changes in variables impact the outcomes of a decision model.
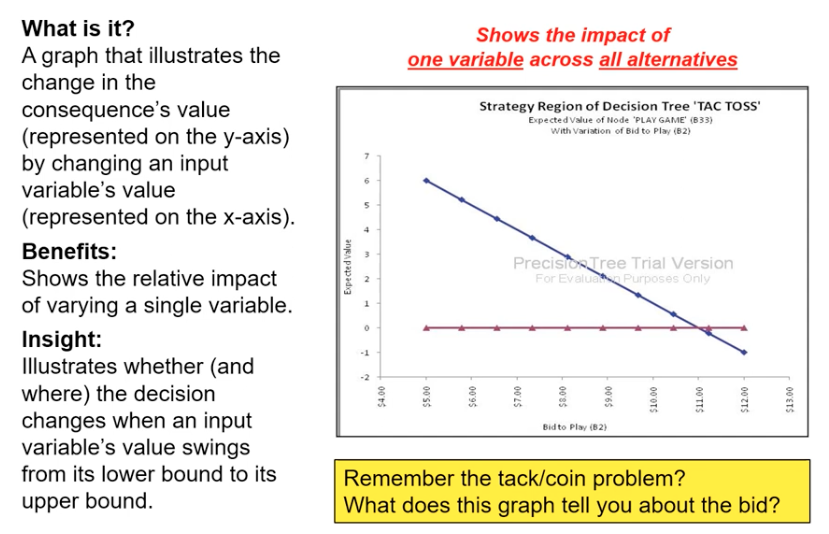
One-Way Sensitivity Analysis
A type of sensitivity analysis that varies one variable while keeping others constant to observe its impact on the overall expected value.
Tornado Diagram
A visual representation that summarizes the impact of different variables on the overall expected value in a decision tree. It displays variables with the highest variation in expected value at the top and those with the least variation at the bottom.
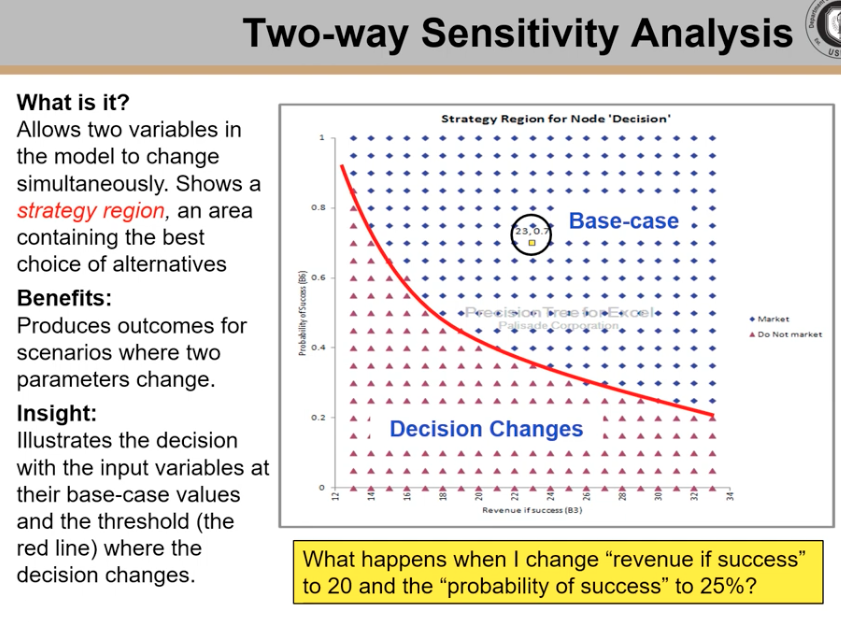
Two-Way Sensitivity Analysis
Involves varying two variables simultaneously to observe cross-correlation effects between them. By changing values on both the x-axis and y-axis, the analysis helps identify the point where a decision yields the best outcome. This method allows for a deeper understanding of how changes in two interconnected variables impact the overall expected value of a decision.