Geog practise qns
 Call Kai
 Learn
Learn Practice Test
 Spaced Repetition
 Match
Match Flashcards
 Knowt Play
1/3

There's no tags or description
Looks like no tags are added yet.
Name | Mastery | Learn | Test | Matching | Spaced | Call with Kai | Chat |
|---|
No analytics yet
Send a link to your students to track their progress
4 Terms
A group of students wanted to investigate if the frequency of visits to nature reserves affect people’s knowledge of endangered animals. The students went to the library and collected information of endangered animals from newspaper articles, published by researchers. State and explain if the students collected primary or secondary data. (3)
State: Secondary data [1]
Explain two of the following:
Newspaper articles are a form of secondary data because the information was collected and published by researchers or journalists, not by the students. [1]
2. Timeline and existence of data: The data already existed before the students started their investigation. The articles were already written, published, and stored in the library prior to the research beginning.
3. Original purpose of data: They were originally collected for another purposebefore being used in this investigation. [1]
4. Nature of the source: Newspaper articles are published, processed, and interpreted sources. The students are reading a "second-hand" account rather than looking at raw, unprocessed data (not first-hand information)
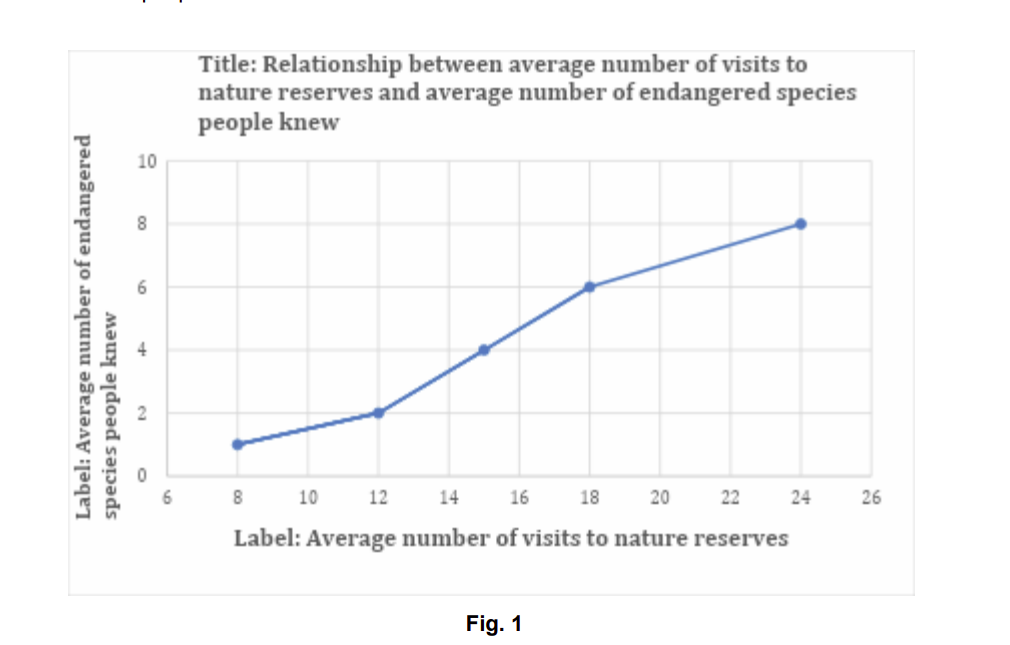
A group of students wanted to investigate if the frequency of visits to nature reserves affect people’s knowledge of endangered animals. The students collected data on the average number of visits people made to nature reserves and the average number of endangered animals they knew about. This was done over five months, as shown in Table 1.
-Avg number of visits to nature reserves- Avg number of endangered animals people knew January 8 1 February 12 2 March 15 4 April 18 6 May 24 8
Using evidence from Table 1 and Fig. 1, state and describe a possible conclusion for the students’ investigation. (2)
As the number of visits to nature reserves increase, the average amount of endangered animals people know about increases. (1)
When the amount of visits to nature reserves is highest, the average amount of endangered animals people know about is also the highest. (1) The number of visits is 24, the average number of endangered animals people know is 8.(additional 1 mark)
When the amount of visits to nature reserves is lowest, the average amount of endangered animals people know about is also lowest. (1 mark)
-The number of visits is 8, the average number of endangered animals people know is 1.(addittional 1 mark)
A group of students wanted to investigate if the frequency of visits to nature reserves affect people’s knowledge of endangered animals. The students spent one hour at Sungei Buloh Nature Reserve on a Monday to conduct their Geographical Investigation. They discussed and felt that their investigation was not reliable. Identify one reason why their investigation was not reliable and suggest one way to improve it. (2)
Duration of one day (Monday) is too short → Results may not be consistent as conditions can vary from day to day, so one day of data is not enough to show a stable pattern. Improvement: Conduct the investigation over a longer period of time, at least one week, from Monday to Sunday.
Time period of one hour is too short → A short sampling period may not capture enough data and results may be affected by chance or short-term fluctuations. Improvement: Increase the time period (e.g. 5 hours) or survey at regular intervals throughout the day.
Only one location was surveyed → Results may not be consistent if repeated at different locations, as one site may not reflect overall patterns. Improvement: Collect data using the same method across multiple locations to improve consistency.
Data collected at only one time period of the day → Results may vary at different times, so one-time data collection may not be consistent. Improvement: Collect data at regular intervals throughout the day (e.g. morning, afternoon, evening).
No repeated sampling was carried out → Without repetition, it is difficult to confirm whether results are stable or due to chance. Improvement: Repeat the investigation over multiple days and compare results to check for consistency.
Award 1 mark for identifying 1 reason why the investigation was not reliable. Award 1 mark for 1 suggestion on how to improve reliability (improvement).
hii
hello