microeconomics practice questions
1/60
Earn XP
Description and Tags
64 practice questions he gave us
Name | Mastery | Learn | Test | Matching | Spaced |
|---|
No study sessions yet.
61 Terms
A person in the community calls and asks you to babysit for four hours on Friday night. You know the job will pay $10 per hour. You are currently planning to hang out with your friends on Friday night. If you accept the offer to babysit, what can your friends determine about how much you would have valued the time spent with them?
if you accept a job for $10 per hour and we assume you are optimising
we assume that you value the time with your friends less than $10 per hour
the opportunity cost of babysitting is the time you are giving up with your friends
you value this at less than $10 per hour, otherwise you would turn down the job
Your friend Charles asks you to drive him to the airport. He says that he will reimburse you for the cost of going to the airport. It is a two hour roundtrip to the airport and you will use $15 of gas. If Charles pays for the cost of gas has he paid your full cost of taking him to the airport? What other costs is Charles forgetting?
The opportunity cost of driving Charles to the airport includes the direct cost of $15 for gas for driving to the airport. However, it also includes the depreciation in the value of the car used to drive to the airport (the car is now worth less with the additional miles) and the value of the best alternative use of the two hours you spent driving. It might have been working a part-time job, studying, or exercising. The opportunity cost of driving Charles to the airport is clearly more than the $15 in gas.
Professors sometimes assign group work so that students develop their ability to work in teams. In a few sentences discuss the free-rider problem in the context of group work. Is the problem likely to be more or less significant in a group of students who are close friends when compared to a group of students who do not know each other?
In group work students have an incentive to let their peers do the work. The free rider problem is often less of a problem when the students know each other. This would be true if the friends were able to punish each other (if they do not do the work) with social pressure or in future interactions. If the students do not know each other and are not likely to interact in the future, then there may be less social pressure and the students could not punish a free-riding peer if they will not be seeing them again after the assignment.
Many professors notice that the students who sit in the first or second row in the classroom frequently earn higher grades in the course than students who sit towards the back of the classroom. Should professors view this relationship as one of causation? As one of correlation? Explain your answer.
While there is a positive correlation between where students sit and their grades in class, it is not clear that sitting in the front causes higher grades. This may be a case of reverse causality where students who take the class more seriously are the students who choose to sit close to the professor. While there may be benefits to sitting in the front such as clearly seeing the board, fewer distractions, and pressure to pay attention as the professor can watch your behavior, most students do not randomly sit in the front rows. Instead, the students often have a particular interest in the course.
The chapter shows that as a general rule people with more education earn higher salaries. Economists have offered two explanations of this relationship. The human capital argument says that high schools and colleges teach people valuable skills and employers are willing to pay higher salaries to attract people with those skills. The signalling argument says that college graduates earn more because a college degree is a signal to employers that a job applicant is diligent, intelligent, and persevering. How might you use data on people with two, three, and four years of college education to shed light on this controversy?
If the human capital explanation is correct, then we might expect to find that people who attend college but do not graduate earn salaries that are close to what college graduates earn. Consider the extreme case of people who drop out of college the week before graduation. It is very unlikely that they would have improved their job skills much in that last week. The human capital school of thought would suggest that they should therefore earn roughly the same salaries as college graduates. On the other hand, the signaling school of thought would argue that these people should earn significantly less than college graduates. Employers would interpret their failure to graduate as a signal they are not as diligent or persevering as people who see their college educations through to the end. There is substantial literature on what is often called the “sheepskin effect” (college diplomas used to be written on sheepskin; Notre Dame continued to use sheepskin until 2012). That literature suggests that human capital and signaling both contribute to the returns to education that we observe in the data.
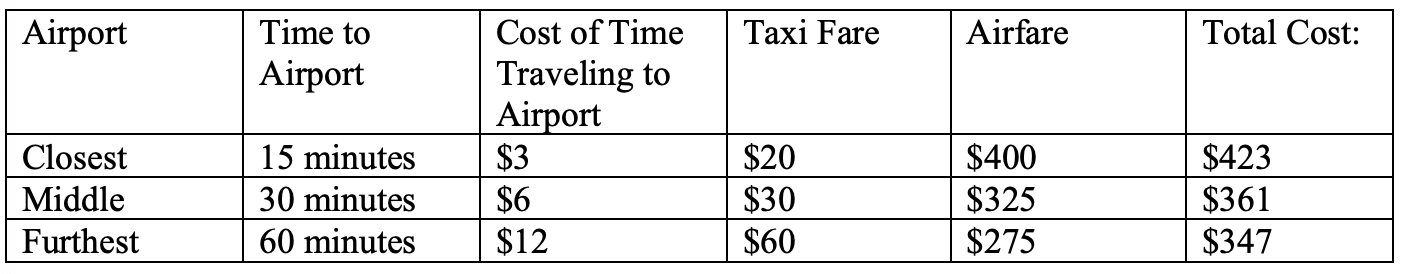
Suppose there are three possible airports near your home that you use for a flight to Boston. At the closest airport you find an airfare of $400, the middle airport (the second closest to your home) has an airfare of $325, and you would pay $275 to fly from the furthest airport. Assume you want to take a taxi to the airport and the roundtrip cost to the close airport is $20 and will take 15 minutes. The taxi fare to the second airport is $30 and will take 30 minutes. The taxi fare to the furthest airport is $60 and will take one hour. You have a part-time job where you earn $12 per hour. Create a table similar to Exhibit 3.2 and determine which airport is the optimum for you to use.
The optimum is the airport furthest from your house.
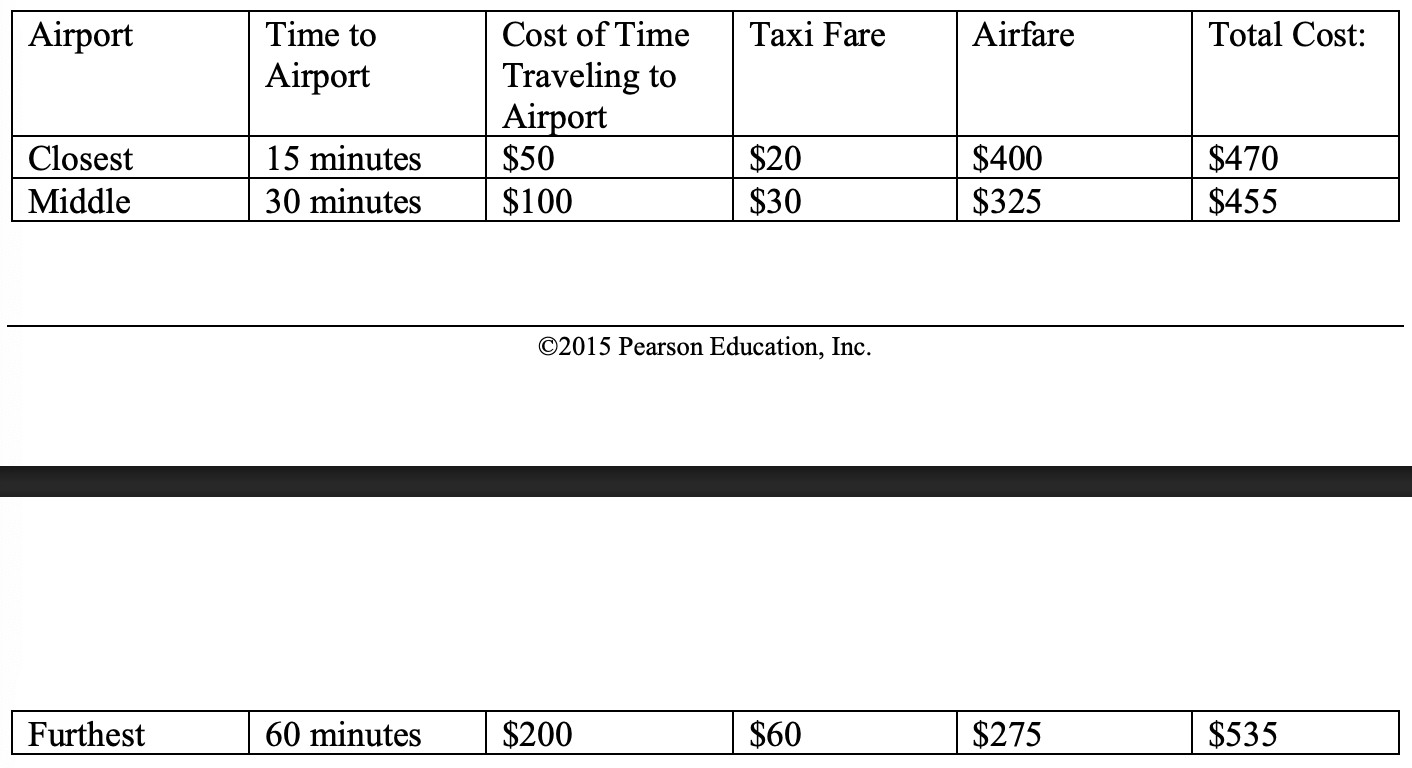
Use all the data from exercise 6 for this problem. Assume you have a next door neighbour who is a lawyer who earns $200 per hour. Create a table similar to Exhibit 3.2 and determine which airport is the optimum for your neighbour to use.
The optimum for your neighbour is the airport that is in the middle (or second closest to your house).
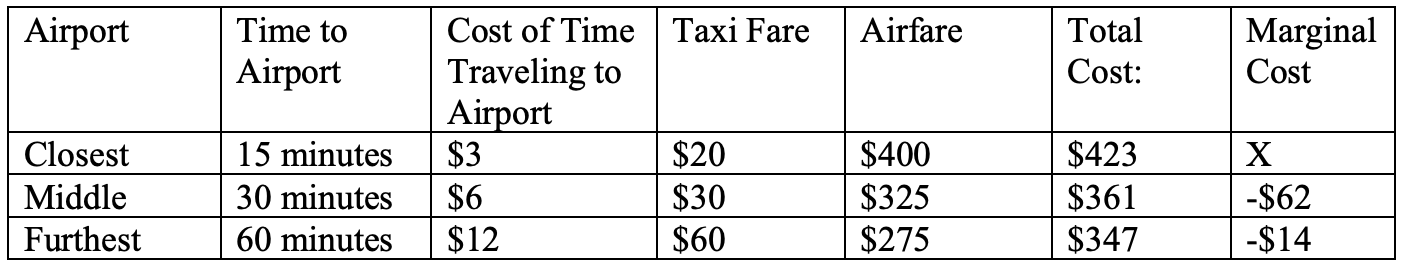
Use the data from exercise 6 for this problem. Create a table using marginal analysis to confirm that the answer for exercise 6 is the same when marginal analysis is used instead of optimisation in levels.
When using marginal analysis you need to add a column to compute the change in the total cost as you move the closest airport to the middle airport. The optimum for you remains the airport that is furthest from your house.
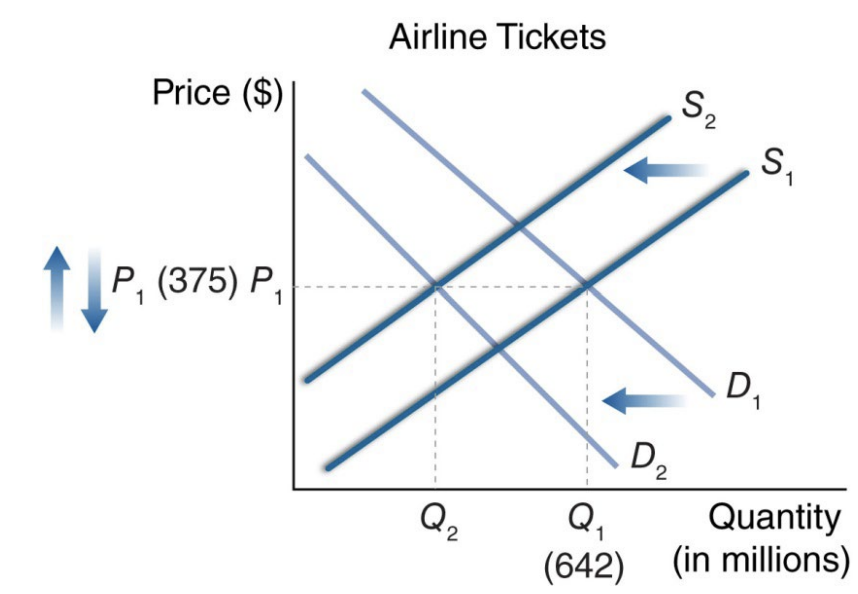
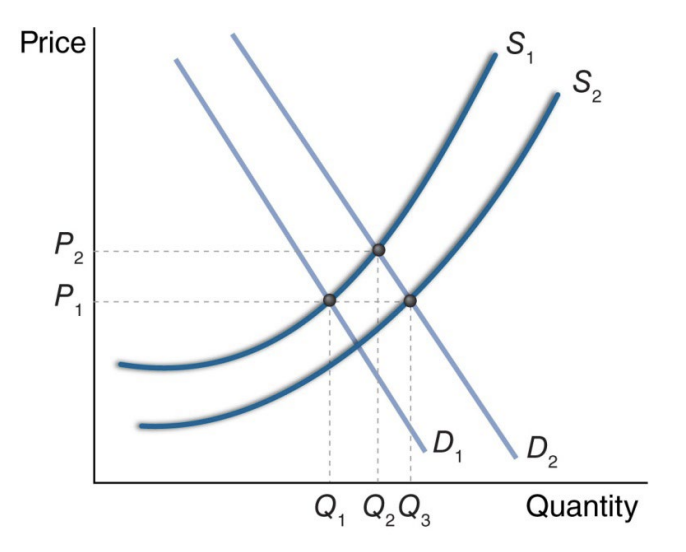
Consider the market for airlines and assume that it is a perfectly competitive market. Assume the U.S. domestic market is currently at equilibrium with a total of 642 million ticketed passengers per year at a price of $375 per ticket. Suppose a study is released that documents large negative health effects of increased exposure to radiation from flying. In addition, suppose there is a sudden increase in the price of jet fuel. If you were asked by a newspaper to comment on these developments, would you predict that the average price per ticket would increase or decrease or that we would be unable to be certain? Would you predict that the number of ticketed passengers would increase or decrease or that we would need additional information?
See graph below. The study on the negative health effects would reduce demand (shown in the graph as the shift from D1 to D2). The increase in jet fuel would reduce supply (shown in the graph as the shift from S1 to S2). The shifts in the demand and the supply curve are both pushing the equilibrium quantity down, and therefore we know the equilibrium quantity will decrease. However, the shift in the demand curve is pushing the equilibrium price down, and the shift in the supply curve is pushing the equilibrium price up. We would need addition information to predict the direction of the change in the equilibrium price.
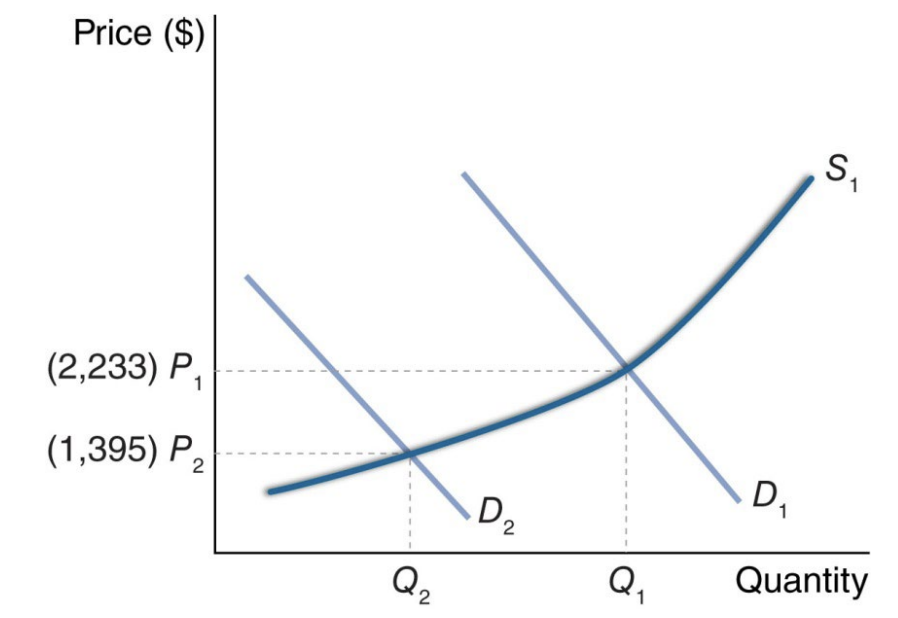
The Super Bowl in 2014 was held outdoors in New Jersey in the winter. Assume the market for tickets to the event was in equilibrium one week prior to the Super Bowl. A weather report forecasted cold weather for the event, and the price for outdoor seats fell. On one website the prices fell from $2,233 to $1,395 per ticket. The price for club seats that included access to a heated area did not change during the week before the event. Show the effect of the weather report in a graph.
See graph below. The weather report likely reduced the attractiveness of sitting outside and watching the game; therefore, the demand curve shifted to the left. The equilibrium price for the tickets fell.
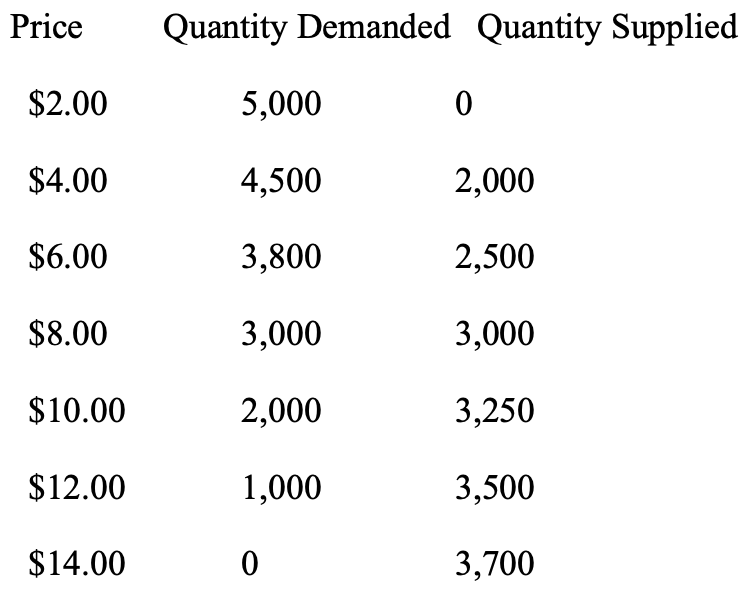
Suppose the following information is gathered for the market for T-shirts in the town where you go to school:
A. What is the current equilibrium price and equilibrium quantity?
B. Suppose college students rallied and convinced the local government to make it a law that the highest legal price for T-shirts should be $4.00. Would the market be in equilibrium?
A. The equilibrium price and equilibrium quantity occur at the price where the quantity demanded is equal to the quantity supplied. The equilibrium price is $8.00 and the equilibrium quantity is 3,000 T-shirts.
B. The market would not be in equilibrium if the price is not allowed to rise above $4.00. Buyers would want to purchase 4,500 T-shirts, but the stores would only be willing to supply 2,000 t-shifts.
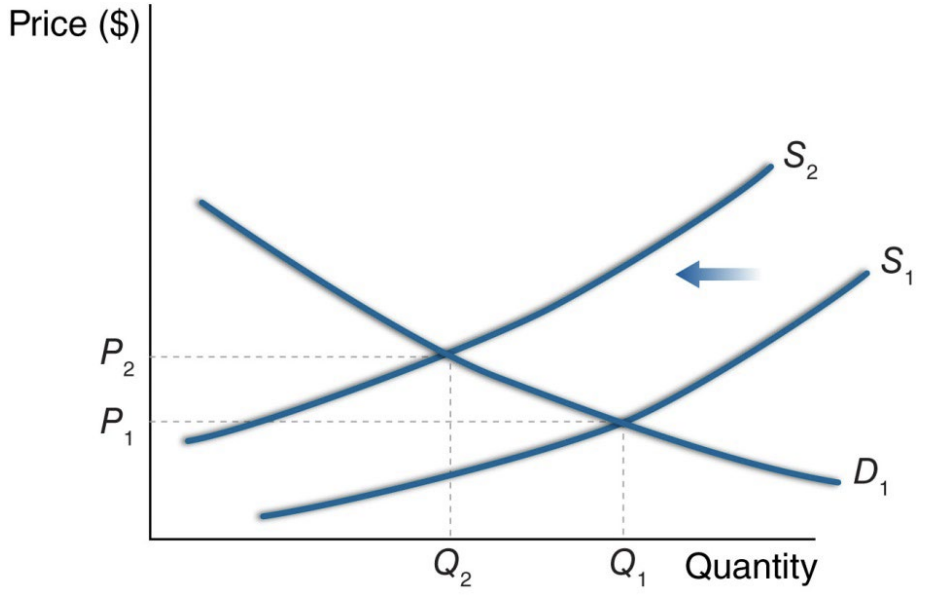
An article in the Financial Times on January 28, 2011 discussed the price of oil. One issue cited was the political tension in Egypt surrounding the protests that eventually led to the removal of President Hosni Mubarak from power. Due to potential problems in the Suez Canal, some oil was shipped around the southern tip of Africa instead, a much longer (and costlier) trip for the oil tankers. Use a demand and supply graph to show the effect of the political tension on the market for oil. What has happened to the equilibrium price? What has happened to the equilibrium quantity?
See graph below. The longer trip for the oil tankers increases the transportation costs of the oil, an input into the production of the product. Therefore, the supply curve shifts to the left. The equilibrium price increases, and the equilibrium quantity decreases.
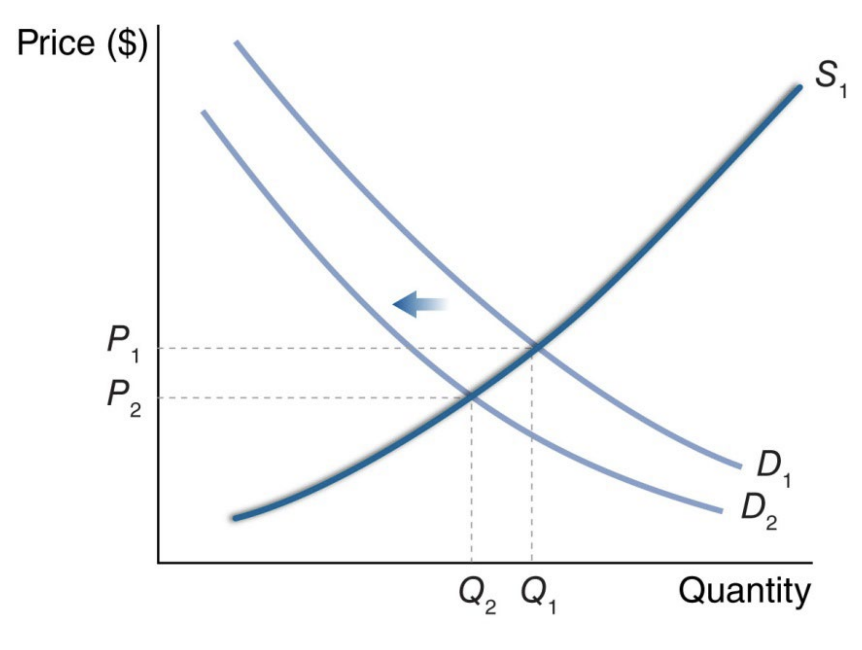
In February of 2014 a large study was published by The British Medical Journal that questioned the value of mammograms for women. The study found that women who only had clinical breast exams had similar death rates from breast cancer as women who had both regular mammograms and clinical breast exams. What is the likely effect of the publicity of this study on the demand for mammograms? Show your answer in a graph.
The study will likely alter the tastes and preferences of some women. As a result, demand for mammograms will decrease and the demand curve will shift to the left. The equilibrium price will decrease, and the equilibrium quantity will decrease
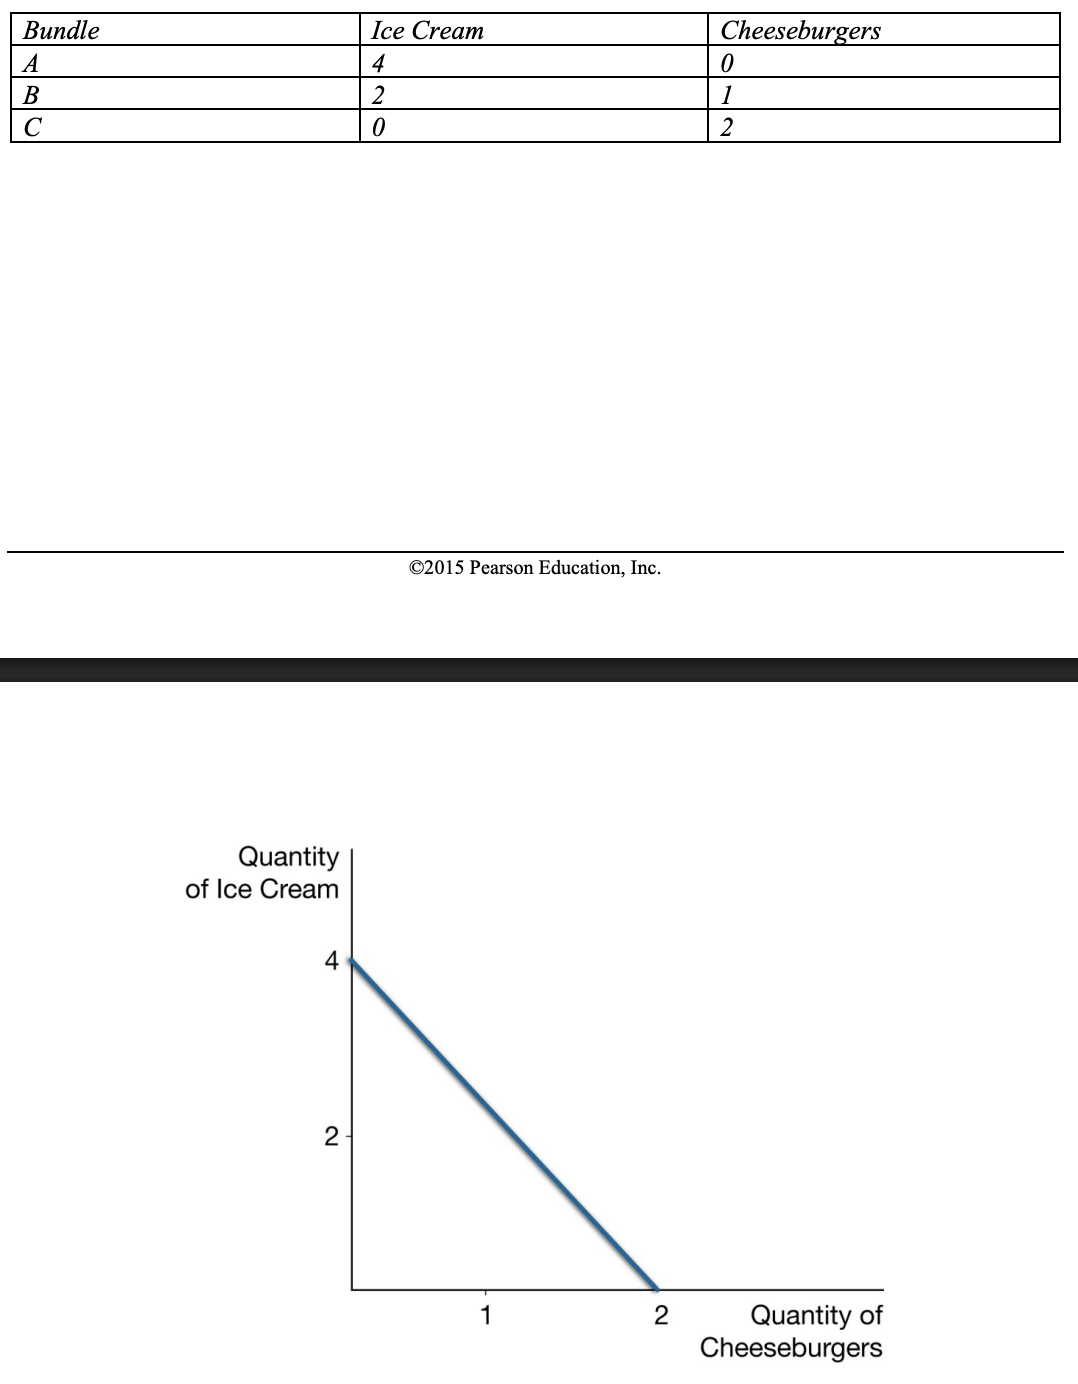
Caroline is a 15 year old girl who goes to a baseball game with her friend’s family. Her parents bought her a ticket and gave her $20 to spend on food. Caroline has two favourite items: ice cream and cheeseburgers. A serving of ice cream has a price of $5 and a cheeseburger has a price of $10. Draw a graph showing Caroline’s budget constraint at the baseball game. What is the opportunity cost of a cheeseburger?
See the graph below. Caroline can afford any combination of ice cream and cheeseburgers with a total budget of $20. The opportunity cost of a cheeseburger is two servings of ice cream
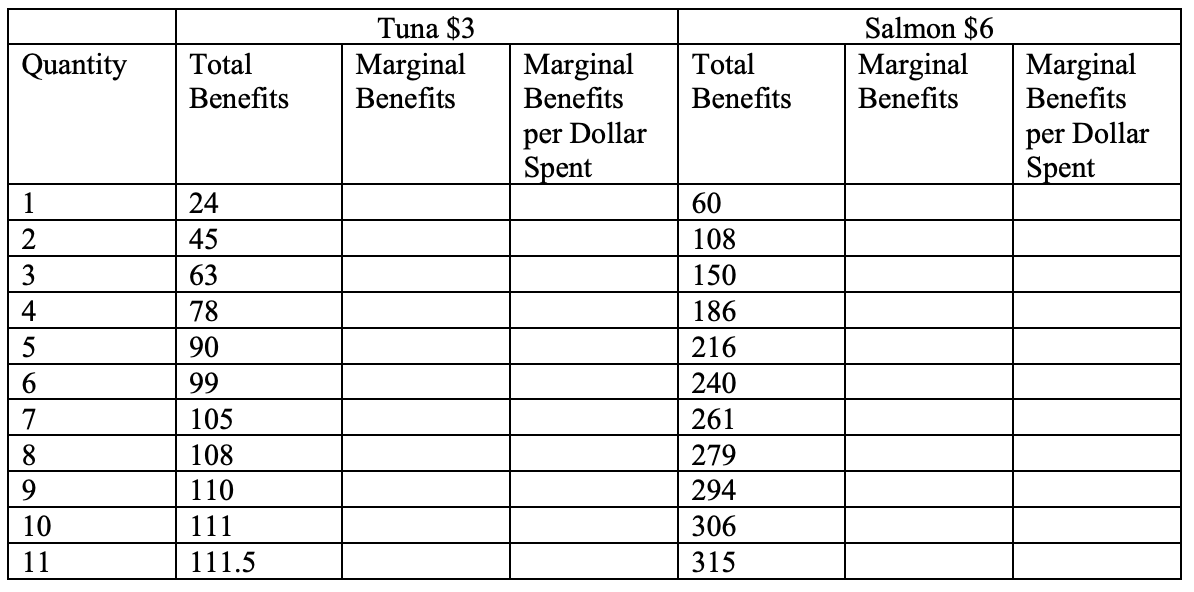
Jackson has a budget of $33 to spend at a sushi restaurant. A piece of yellowtail tuna has a price of $3 and a piece of salmon has a price of $6.
A. Fill in the marginal benefits values in the table below for tuna and salmon.
B. Fill in the marginal benefit per dollar for tuna and salmon for each unit.
C. What is the optimal combination of tuna and salmon for Jackson to purchase?
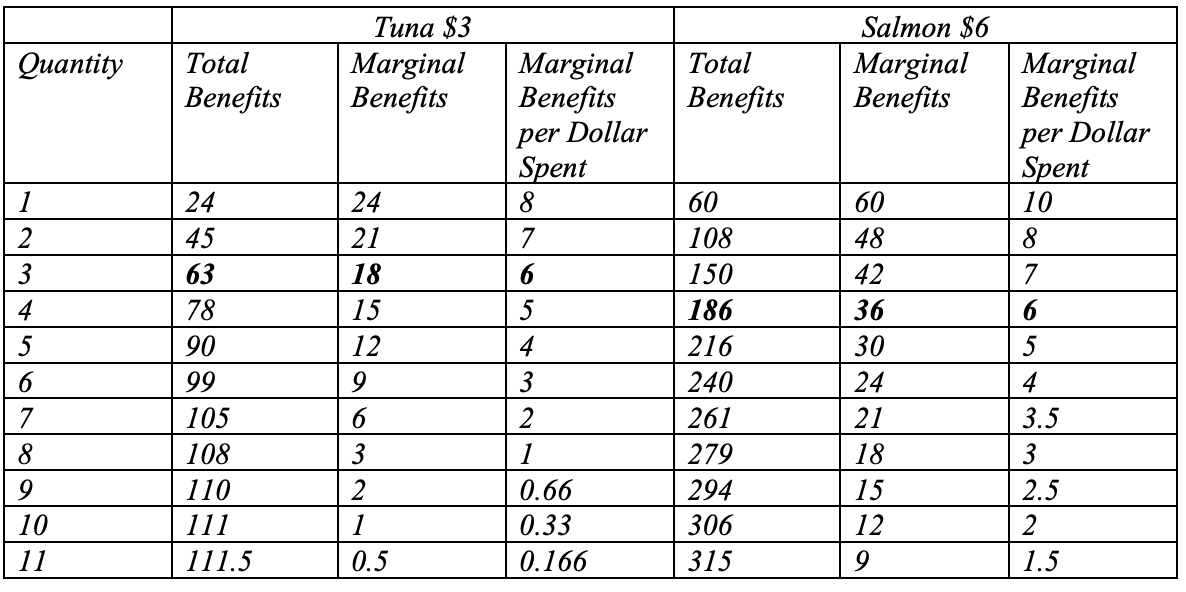
See the table below for Parts A and B. The optimal combination for Jackson is 3 pieces of tuna and 4 pieces of salmon. He is spending all $33 and has a total benefit of 63 units from tuna and 186 units from salmon. The consumption bundle gives him a total benefit of 249(63+186). No other combination of tuna and salmon that stays within the budget of $33 will give him a higher total benefit. At this point the marginal benefit per dollar from tuna is the same as the marginal benefit per dollar from salmon

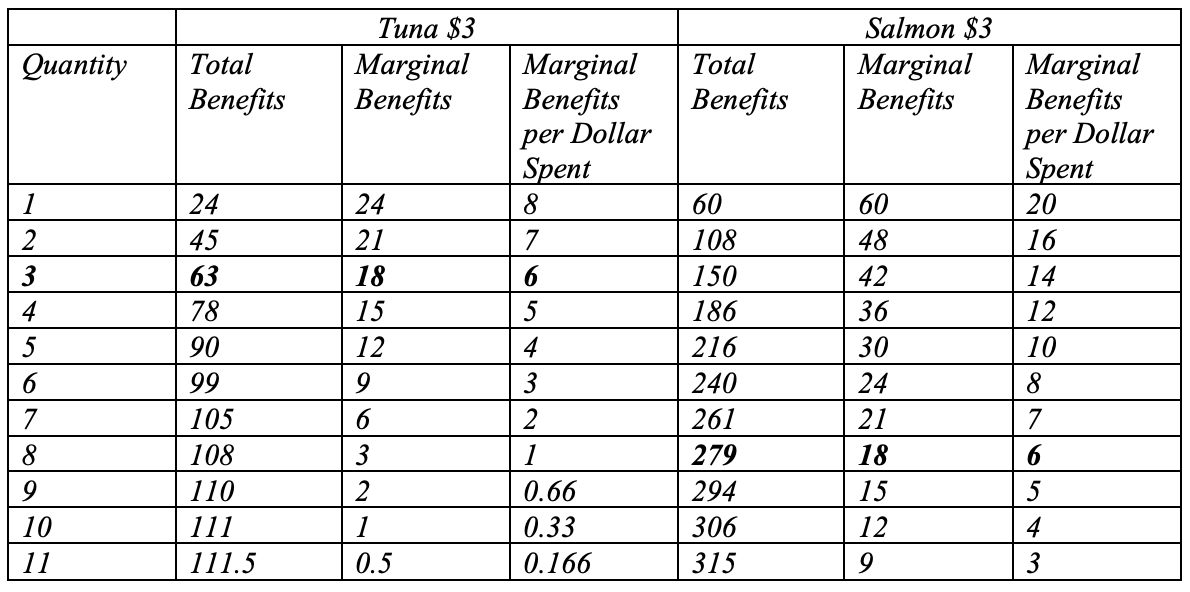
Use the information and table from the Exercise above. Recall that Jackson has a budget of $33 to spend at a sushi restaurant and the original prices are a piece of yellowtail tuna has a price of $3 and a piece of salmon has a price of $6. However, now the price of salmon falls to only $3 per piece.
A. Calculate the new marginal benefit per dollar spent on salmon for each quantity.
B. What is the new optimal combination of tuna and salmon?
See the table below for Part A. The optimal combination for Jackson is 3 pieces of tuna and 8 pieces of salmon.
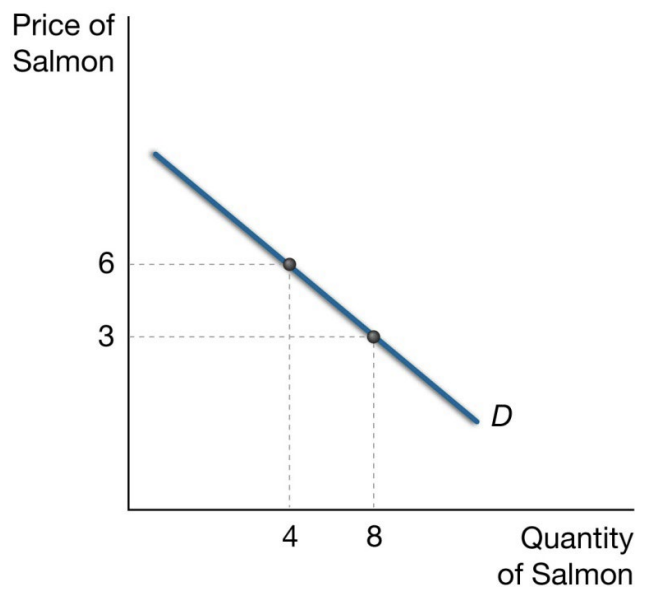
Use the answers from the previous two exercises (questions 15 and 16) to graph two points on Jackson’s demand curve for salmon.
See the graph below. When the price of salmon is $6 per piece, Jackson purchases 4 pieces—this is one point on the demand curve. When the price of salmon falls to $3 per piece we see a second point on his demand curve—8 pieces of salmon.
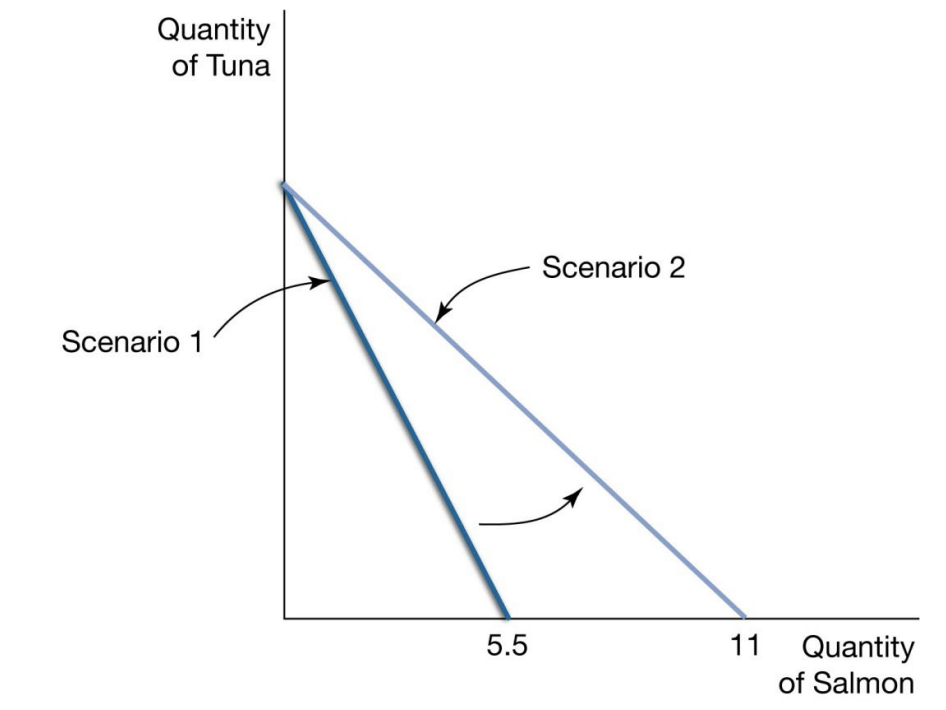
Use the information from exercises 15 and 16 to graph Jackson’s budget constraint. Recall that Jackson has a budget of $33. In the first scenario, the price of tuna is $3 per piece and the price of salmon is $6 per piece. In the second scenario, the price of tuna remains $3 per piece and the price of salmon falls to $3 per piece.
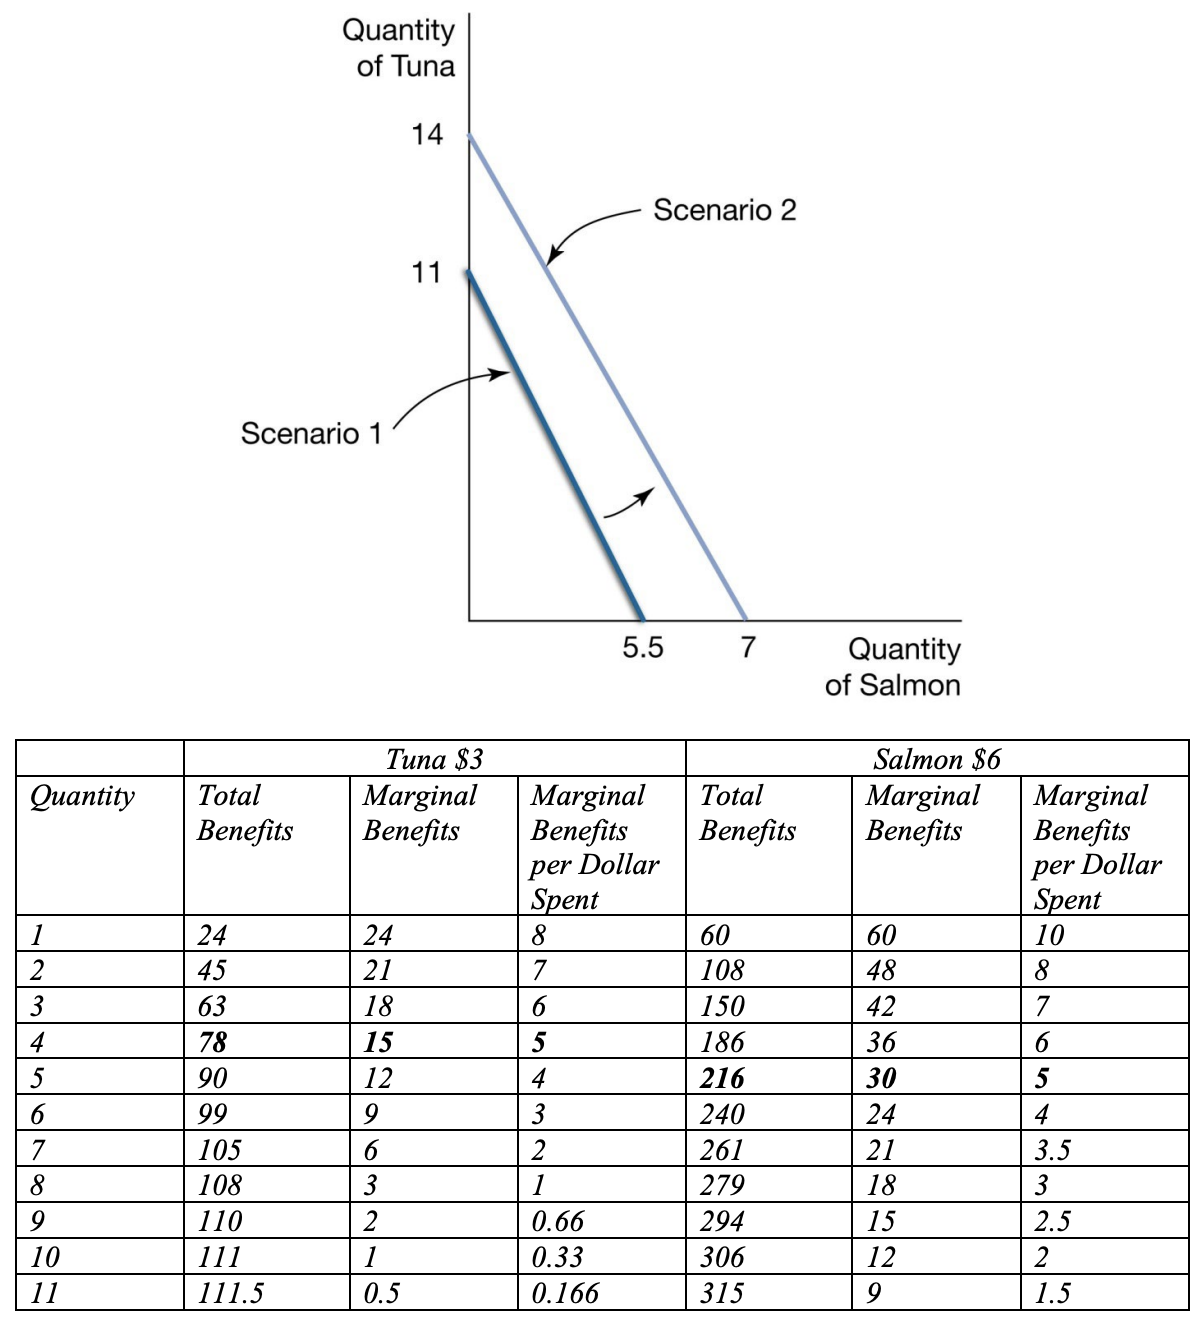
Use the information from Exercise 16. Recall that Jackson has a budget of $33. In the first scenario, the price of tuna is $3 per piece and the price of salmon is $6 per piece. Now, suppose Jackson’s budget increases to $42.
A. Draw Jackson’s original budget constraint associated with a budget of $33 and a new budget constraint with a budget of $42.
B. Using the table in Exercise 2 and your calculations of the marginal benefit per dollar of tuna and salmon, what is Jackson’s optimal consumption bundle when he has a budget of $42?
See the graph below for Part A. His optimal consumption bundle is now 4 pieces of tuna and 5 pieces of salmon.
In 2014, the price of beef increased due to harsh weather. In response to the increased price of beef, a local restaurant raises the price of hamburgers by 20 percent. If the restaurant knows that their price elasticity of demand is approximately 1.1, what is the expected change in the quantity of hamburgers that they will sell?
Using Equation (5-6), the expected change is a 22 percent decrease in the quantity of hamburgers sold.
The restaurant in Exercise 20 observes that their sales of milkshakes fall by 10 percent after the 20 percent increase in the price of hamburgers. Calculate the cross-price elasticity of demand for milkshakes with respect to the price of hamburgers. Based on the sign of your answer (positive or negative) are milkshakes a complement or substitute for hamburgers at this restaurant?
Using the equation for cross-price elasticity in the text (5-8), the cross-price elasticity of demand is -10%/20% or -0.5. The two goods are complements as the cross-price elasticity of demand is negative.
Assume Diana spends all of her income on two goods: fish and chips. At Diana’s current consumption bundle, her marginal benefit of fish is 200 and the price of fish is $10. Her marginal benefit of chips is 50 and the price of chips is $2. Is the current consumption bundle optimal for Diana? How do you know? Do you have any advice on how Diana should change her buying behavior? If she follows your advice, what will happen to her marginal benefit of fish and her marginal benefit of chips?
As show in equation (5-3), Diana will have a an optimal consumption bundle if MB fish/Price fish=MB chips/Price chips. Her MB/$ of fish is 20 and her MB/$ of chips is 25. Therefore, the current consumption bundle is not optimal. Diana is getting “more bang for her buck” from purchasing chips. Diana should purchase more chips and less fish. With the assumption of diminishing marginal benefit, as Diana buys more chips the marginal benefit of fish will decline. By purchasing fewer fish, the marginal benefit of fish will increase.
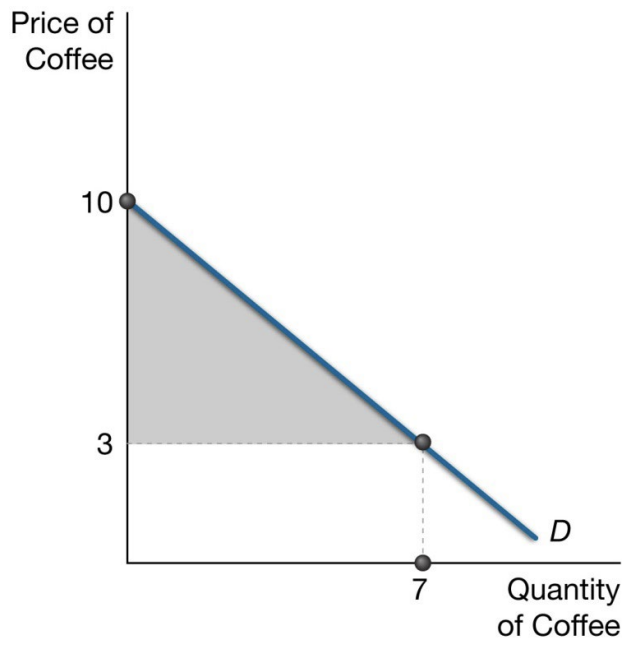
Suppose Alex’s demand curve for cups of coffee in a week is represented by the equation Q = 10 - P where Q is the quantity demand and P is the price of coffee.
A. If the price of coffee is $3, how many cups of coffee will Alex buy in a week?
B. In a graph, show the demand curve and the amount of coffee Alex will buy.
C. In the graph from Part B, shade the area that represents the consumer surplus.
D. Calculate Alex’s consumer surplus using the formula on page 96 of the textbook.
Part A. When P=3, we know that Q = 10 – 3 = 7.
See the graph below for the answer to Parts B and C. The area of the consumer surplus is (7 X 7)/2 = 24.5.
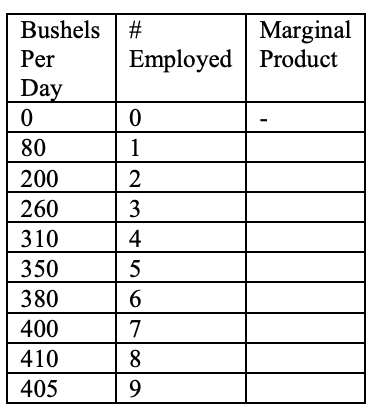
Heather owns a vegetable farm and hires workers to pick tomatoes. Using the table below calculate the marginal product per worker and fill in the Marginal Product column. At which worker does the marginal product begin to diminish?
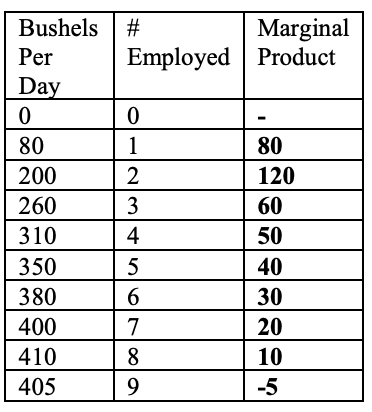
The marginal product per worker is the change in the total output associated with using one more unit of input. In this case, the inputs are workers and the output is the number of bushels picked in a day. The values of the marginal product are shown in the table below. The marginal product declines with the third worker
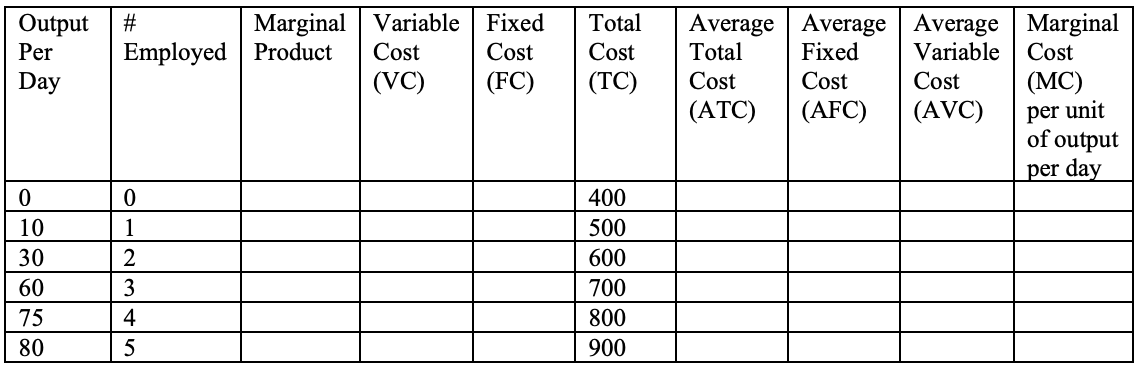
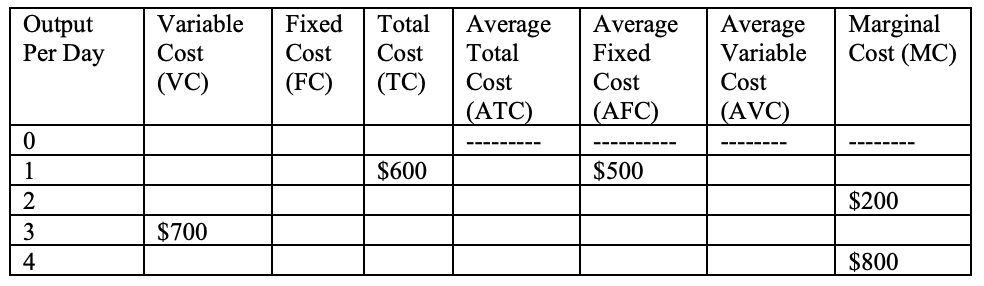
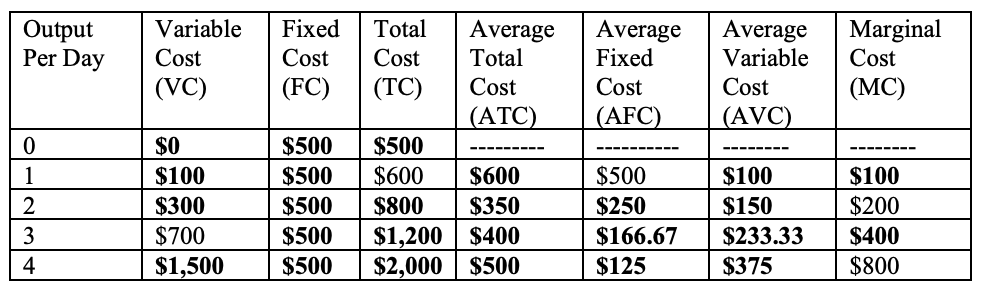
John owns a nail salon and they produce manicures. John has provided you with the following information on the output per day based on the number of employees as well as the total cost. Fill in the remaining columns of the table.
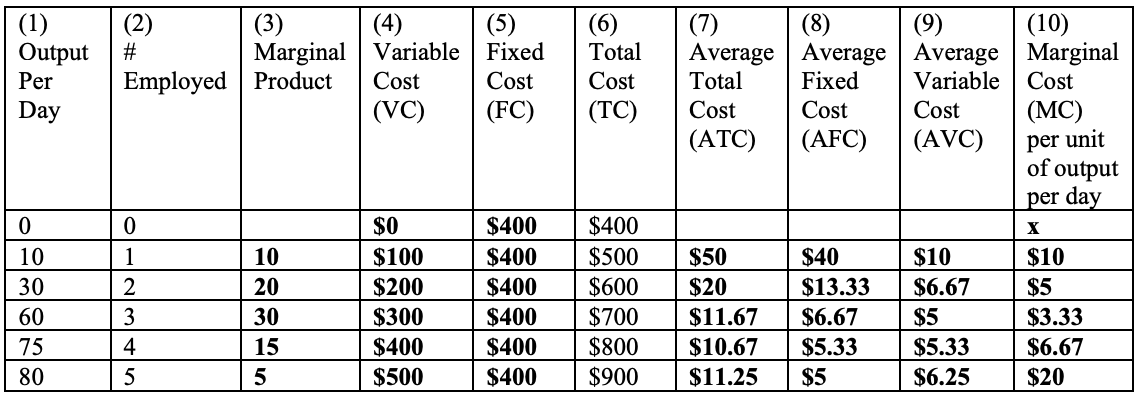
See table below. Marginal product is calculated as the change in (1). FC equals TC (6) when output is 0 or $400. VC equals TC minus FC. Each of the average cost columns are the respective cost divided by (1). And marginal cost is the change in (6) divided by the change in (1).
Deidra is an accountant who completes income tax returns for small businesses. The table below represents her costs of production. Complete the table. Hint: To get started, what is the fixed cost when output per day is one unit?
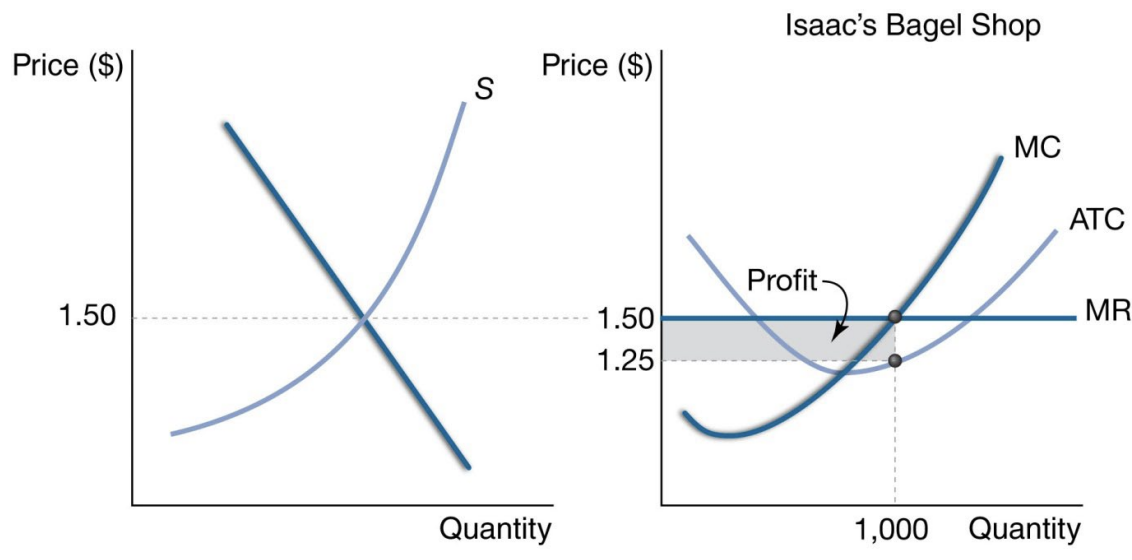
Assume that Isaac’s Bagel Shop operates in a perfectly competitive market. The market price for bagels is $1.50 per bagel. Isaac’s Bagel Shop sells 1,000 bagels per day at this price and their average total cost of 1,000 bagels is $1.25.
A. Is Isaac’s Bagel Shop making a profit or loss?
B. Represent this situation in two graphs. First, draw a graph with the market demand and supply curves. Second, draw a graph for Isaac’s Bagel Shop. Be sure to label the curves and the area that presents the firm’s profit or loss.
C. Calculate the firm’s profit or loss per day.
A. Isaac’s Bagel Shop is making a profit as the average revenue per bagel, $1.50, is higher than the average total cost per bagel, $1.25.
B. See graph below.
C. The firm’s profit is (P – ATC) X Q. ($1.50 - $1.25) X 1,000 = $250 per day.
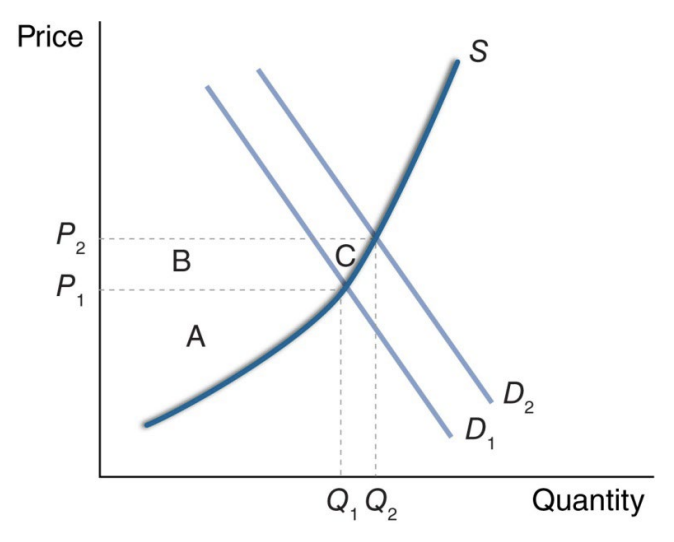
Assume the market for eggs is perfectly competitive. Several reports in 2014 highlighted the health benefits of eating eggs. Assume the reports caused a rightward shift in the market demand curve for eggs. In a graph with the market demand and market supply curve show the impact of the shift in the market demand curve on the market price and label the producer surplus before and after the change in market demand.
The reports suggested health benefits from eating eggs and therefore could cause an increase in demand (market demand curve shifts to the right). The shift in the demand curve would increase the market price as shown in the graph as the movement from P1 to P2. The area representing the producer surplus would increase from area A to area ABC.
The previous question (question 28) discussed a shift in the market demand curve for eggs caused by reports that extoled the health benefits of eating eggs. Assume that before the report was issued the egg market was in long-run equilibrium and assume firms are identical. In a graph of the egg market, again show the shift of the market demand curve and label this D2. How will the market adjust to a new long-run equilibrium? Explain and show the adjustment in your graph.
The report caused the market demand curve to shift to the right. If the market was initially in long-run equilibrium, then we know that P1 is the price where firms make zero profits. At P2, the higher price associated with demand curve D2, we know that firms are making profits. This means that over time firms would be attracted to the egg market. As firms enter the market supply curve will shift rightward, shown as S2, and firms will keep entering until the market price falls back to P1. Note that overall market quantity has increased to Q3. See graph below.
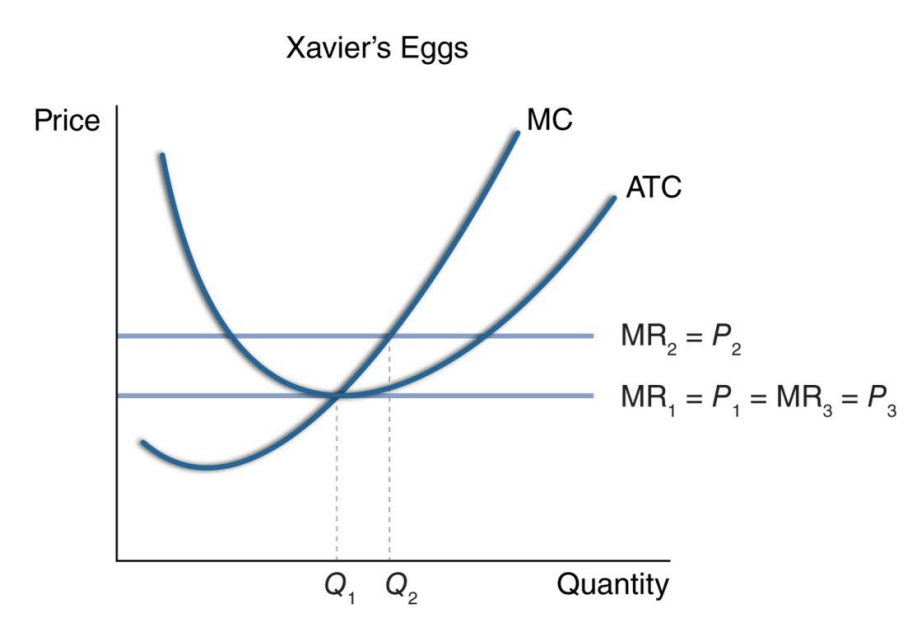
The previous two questions (28 and 29) have examined the effects of an increase in demand caused by reports of health benefits from egg consumption on the market for eggs and assumed that firms are identical. Assume Xavier’s Eggs was in business before the shift in demand. Show the firm graph and label the price and quantity produced by Xavier’s Eggs in: the initial situation, after the shift in demand, and finally after the market adjusts to a new long-run equilibrium. How does Xavier’s Eggs quantity produced in the initial situation compare to the new long-run equilibrium?
In the initial situation, Xavier’s Eggs produce Q1 when price is P1. After the increase in price to P2, caused by the rightward shift in demand, output increases to Q2. Finally, as first enter and drive the price back down to P1, Xavier’s Eggs return to producing Q1. Note that despite Xavier’s Eggs producing the same number of eggs in the new long-run equilibrium as in the initial situation more eggs are produced in the overall market in the new long-run equilibrium because there are more firms in the market. See graph below.
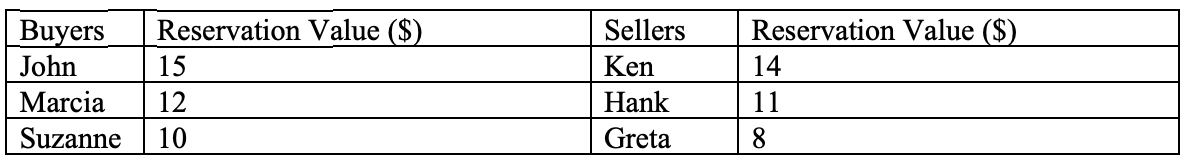
Suppose there is a neighborhood on a Friday night where there are three parents looking for a babysitter for one hour (the buyers) and three teenagers willing to babysit (the sellers). The table below shows the reservation values of the buyers and sellers for the one hour of babysitting.
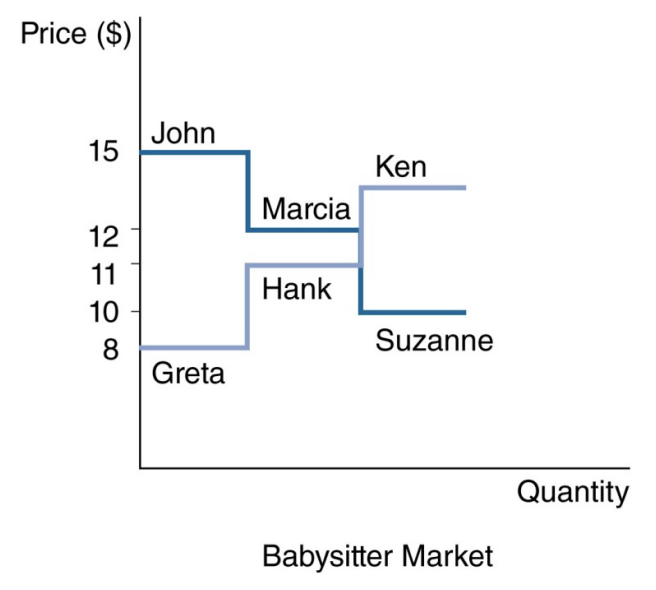
A. Use the data in the table below to plot the demand and supply curve for babysitters.
B. What will be the equilibrium quantity of babysitters hired?
C. What is the social surplus if 2 babysitters are hired? What is the social surplus if 3 babysitters are hired?
See the graph below for Part A. The equilibrium quantity of babysitters hired will be two (we do not know the exact equilibrium price, but we know it will be between $11 and $12). The social surplus if 2 babysitters are hired will be (15-8) + (12-11) or $8. The social surplus if 3 babysitters are hired is (15-8) + (12-11) + (10-14) or $4.
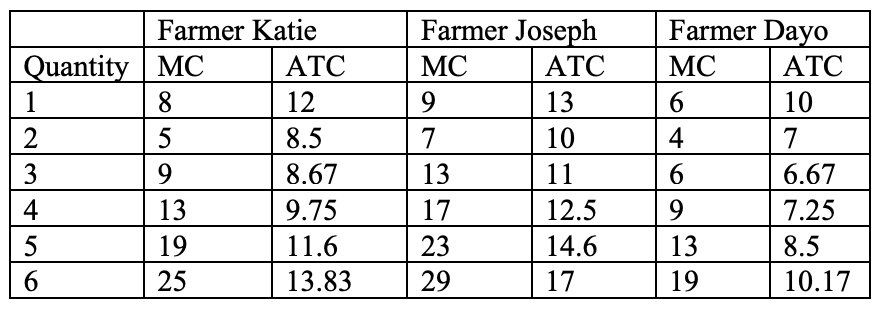
Three tomato farmers have identical agricultural technology, but the land that they farm on differs in quality and therefore in the cost of production. The marginal cost and average total costs for each level of output of tomatoes for each farmer is found in the table below. If the price of a bushel of tomatoes is $13 per bushel:
A. How many tomatoes will each farmer choose to produce?
B. What will be the marginal cost for each farmer?
C. What will be the profit for each farmer?
A. Farmer Katie will produce 4; Farmer Joseph will produce 3; Farmer Dayo will produce 5.
B. The marginal cost for all 3 farmers will be $13 per bushel ©2015 Pearson Education, Inc.
C. The profits for Farmer Katie will be Q*(P - ATC) = 4*(13 - 9.75) = $13.The profits for Farmer Joseph will be 3*(13 - 11) = $6. The profits for Farmer Dayo will be 5*(13 - 8.5) = $22.5
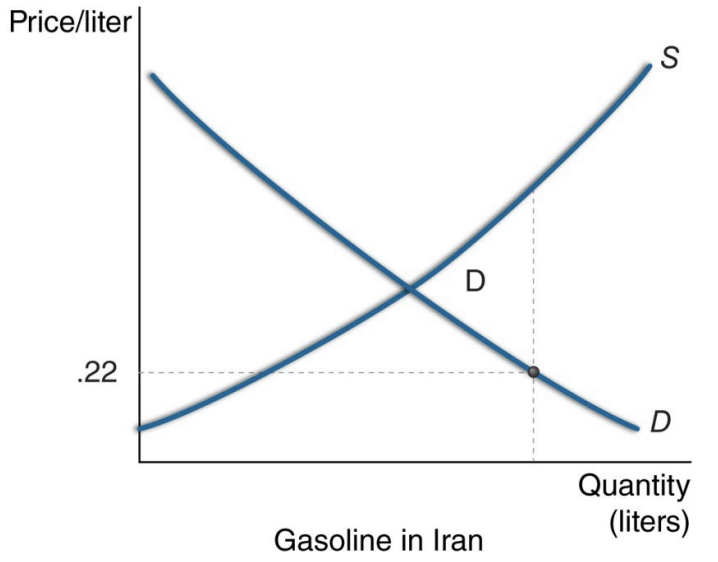
In 2014, the price of gasoline in Iran was artificially low, 22 cents per liter, due to price controls. The government provides subsidies to the oil companies so that the amount traded on the market is equal to the quantity demanded at 22 cents per liter. In a graph of the market for gasoline in Iran, label the area that represents the deadweight loss.
See graph below. The area labeled D represents the deadweight loss.
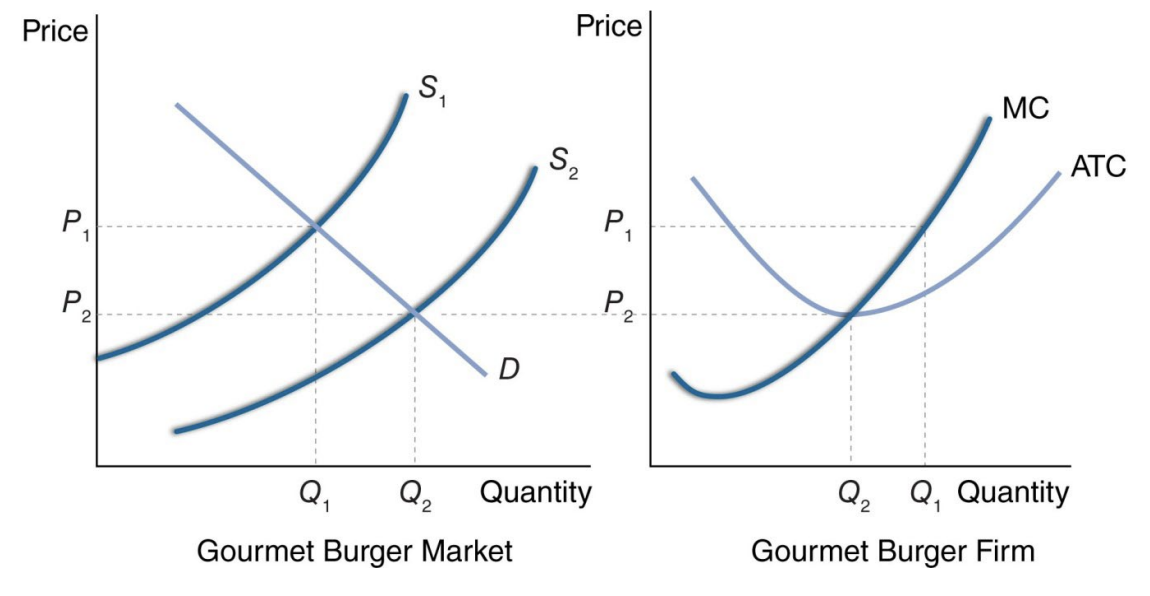
In the late 2000s, consumers embraced restaurants that provided fast food made with higher quality ingredients such as gourmet hamburgers. Individual firms were making significant economic profits. Assume the market is perfectly competitive. Show a graph of a gourmet hamburger firm making a profit and a graph representing the overall market for gourmet hamburgers. Do you expect firms to enter or exit the market? Show the effect of the firms entering or exiting on both the market and firm graphs.
See the graphs below. With firms making profits, other firms will enter the market. This will shift the supply curve rightward and lower the market price. Firms will continue to enter until the firms are making zero economic profits.
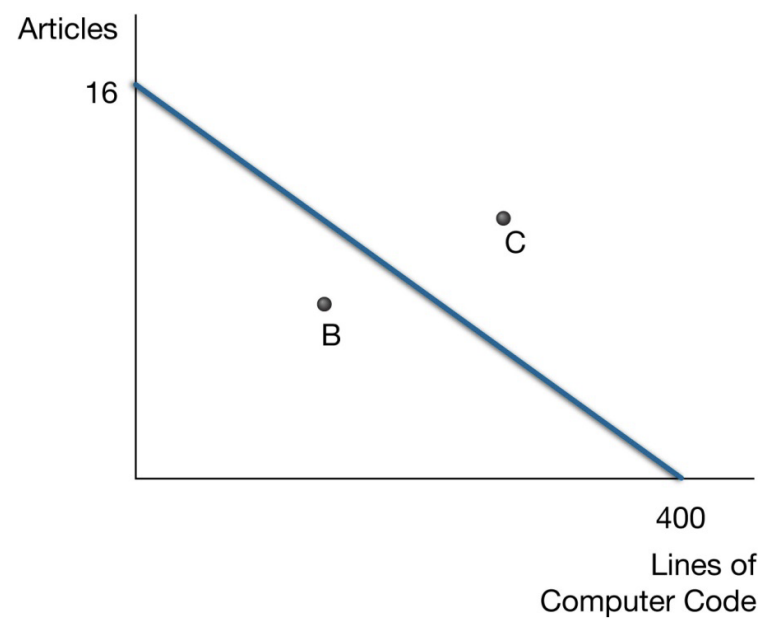
Prof. Anderson conducts research. She can do two different tasks: summarizing articles and computer coding. In one hour, Prof. Anderson can summarize 2 articles or write 50 lines of code. Assume there are 8 hours in a day.
A. Draw the production possibilities curve for Prof. Anderson.
B. Label a point on the graph “B” that could represent her production if a colleague comes into Prof. Anderson’s office and distracts her from her working on articles and computer coding.
C. Label a point on the graph, “C”, that represents an unattainable combination of articles of computer code for one 8 hour day of work.
Prof. Anderson, from the question above, has hired an undergraduate student, Will, to assist with her research. The research still involves completing two tasks: summarizing articles and computer coding. As before, in one hour, Prof. Anderson can summarize 2 articles or write 50 lines of code. In one hour, Will can summarize 1 article or write 10 lines of code. Assume there are 8 hours in a day.
A. What is the opportunity cost of summarizing an article for Prof. Anderson?
B. What is the opportunity cost of summarizing an article for Will? C. Who has an absolute advantage in summarizing articles?
D. Who has a comparative advantage in summarizing articles?
A. 1 article costs 25 lines of code for Prof. Anderson.
B. For Will, 1 article costs 10 lines of code.
C. In one hour, Prof. Anderson is able to summarize more articles than Will; therefore Prof. Anderson has the absolute advantage in summarizing articles. ©2015 Pearson Education, Inc.
D. Will has the comparative advantage in summarizing articles because he has the lower opportunity cost (10 lines of code)
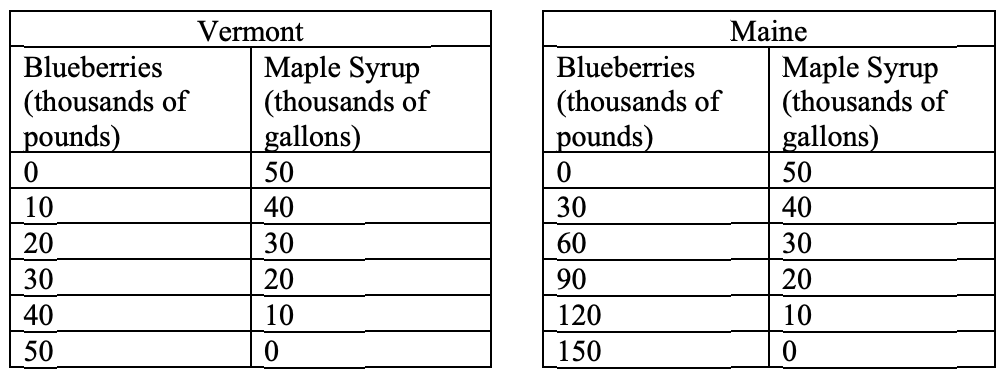
Assume the economies of Vermont and Maine only produce blueberries and maple syrup. They only trade with each other. Assume the production schedule below shows the production possibilities for one year.
A. What is the opportunity cost of maple syrup in Vermont?
B. What is the opportunity cost of maple syrup in Maine?
C. If the two states are open to trade, which state will specialize in maple syrup?
D. What is the Terms of Trade Range (in pounds of blueberries for a gallon of maple syrup)?
A. If Vermont moved from producing 0 to 10 thousand gallons of maple syrup, Vermont would lose 10 thousand pounds of blueberries. Therefore, the opportunity cost of 1 gallon of maple syrup is one pound of blueberries.
B. In Maine, the first 10 thousand gallons of maple syrup would require a loss of 30 thousand pounds of blueberries and so the opportunity cost of 1 gallon of maple syrup is 3 pounds of blueberries.
C. Maple syrup has a lower opportunity cost in Vermont and so Vermont would specialize in maple syrup (and Maine would specialize in blueberries).
D. The Terms of Trade Range is determined by the opportunity costs in each state. The Terms of Trade for one gallon of maple syrup will be between 1 and 3 pounds of blueberries.
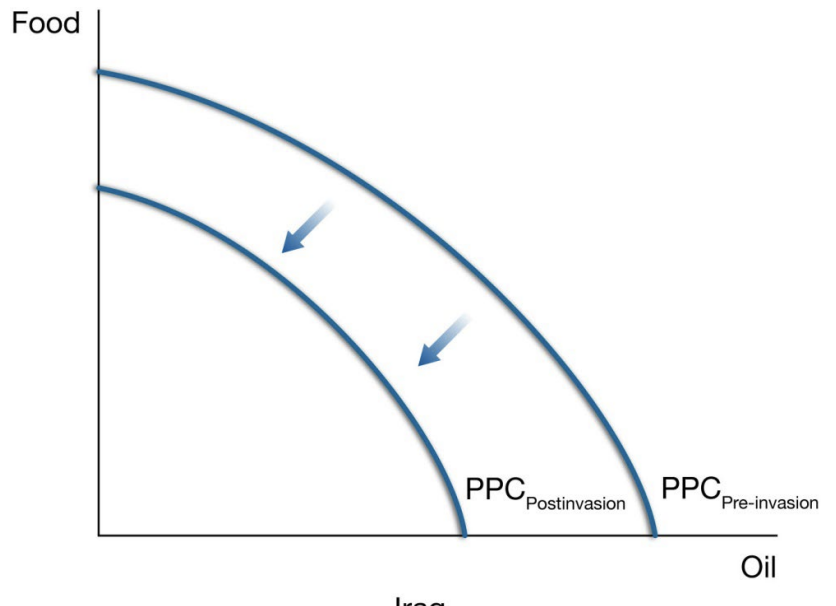
Consider the economy of Iraq before the United States invaded in 2003. In the war that followed, a significant amount of infrastructure (roads, bridges, pipelines, etc.) was destroyed. Assume that Iraq only produces two goods: oil and food. Show a production possibilities curve that represents the Iraqi economy just before the invasion. Show a second production possibilities curve that represents the Iraqi economy immediately after the invasion after the infrastructure was destroyed.
See the graph below. The destruction of the infrastructure shifts the PPC inward. Both agriculture and oil are produced using infrastructure as input.
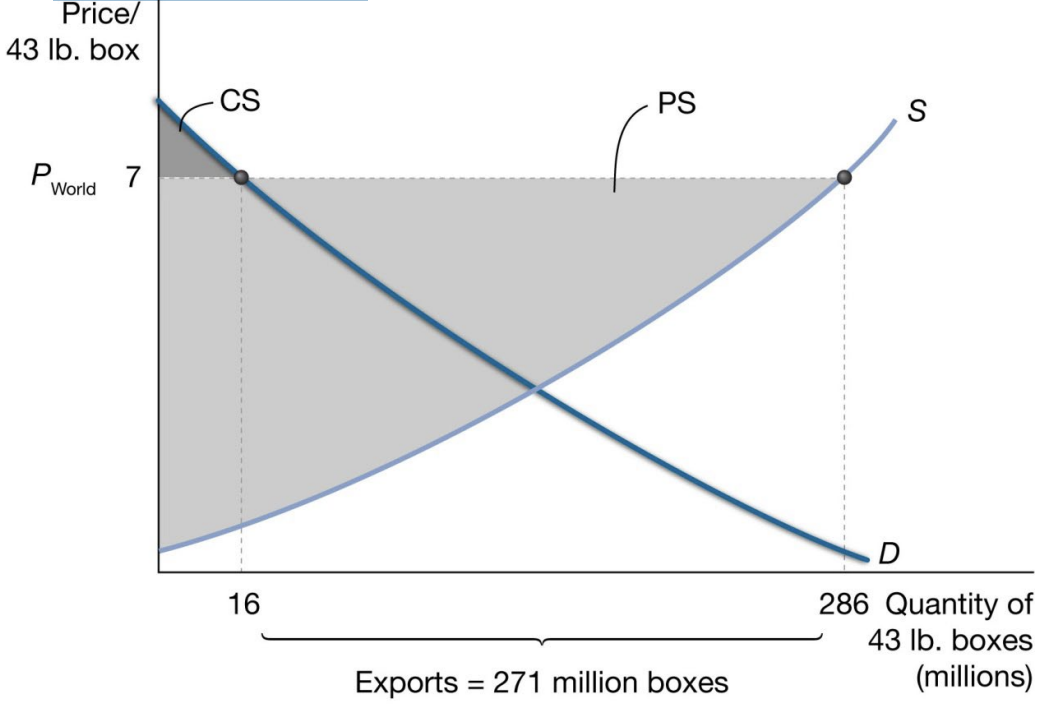
According to a report on Ecuadorian banana production by the USDA, in 2009 Ecuador produced 286 million 43 pound boxes of bananas and exported 271 million of these boxes and generated $1.9 billion in revenue (60 percent of the total value of agriculture in Ecuador) for average price of approximately $7 per box.
A. Represent the domestic banana market for Ecuador in a graph of the demand and supply curves.
B. Shade the area that represents the consumer surplus and the producer surplus.
C. Would the price per box in Ecuador increase or decrease if Ecuador decided to not trade bananas with the rest of the world?
A-B. See the graph below.
C. The price per box of bananas would decrease if Ecuador did not trade with the rest of the world.
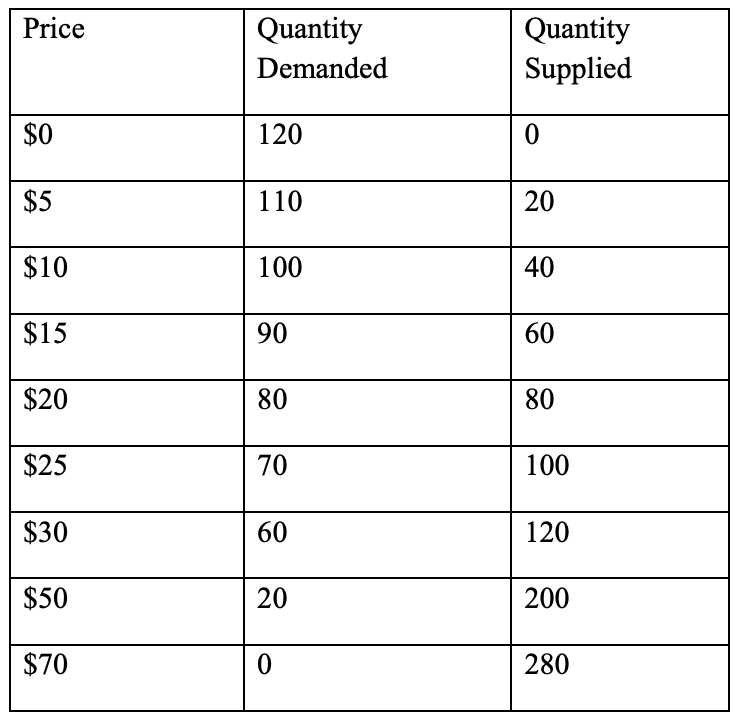
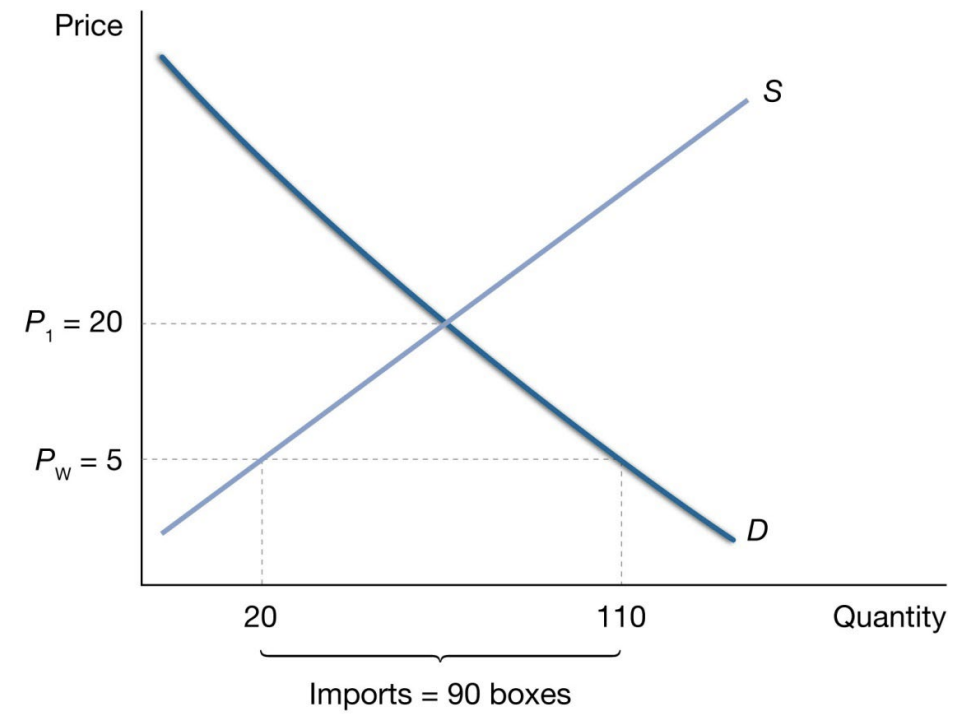
Suppose the demand and supply schedules for boxes of tomatoes for a small town are represented in the table below.
A. Draw a graph of the demand and supply curves.
B. If the town does not trade with the outside world, what would be the price of tomatoes? Label the price on the graph as P1.
C. If the world price of tomatoes is $5 per box, would the town import or export tomatoes? What would be the quantity either imported or exported?
D. Who are the winners from opening to trade with the outside world and who are the losers?
A. See graph below.
B. The price would be $20.
C. The town would import tomatoes. The amount imported is the difference between the quantity demanded and the quantity supplied, or 90 boxes.
D. The winners from opening to trade are the buyers and the losers are the sellers.
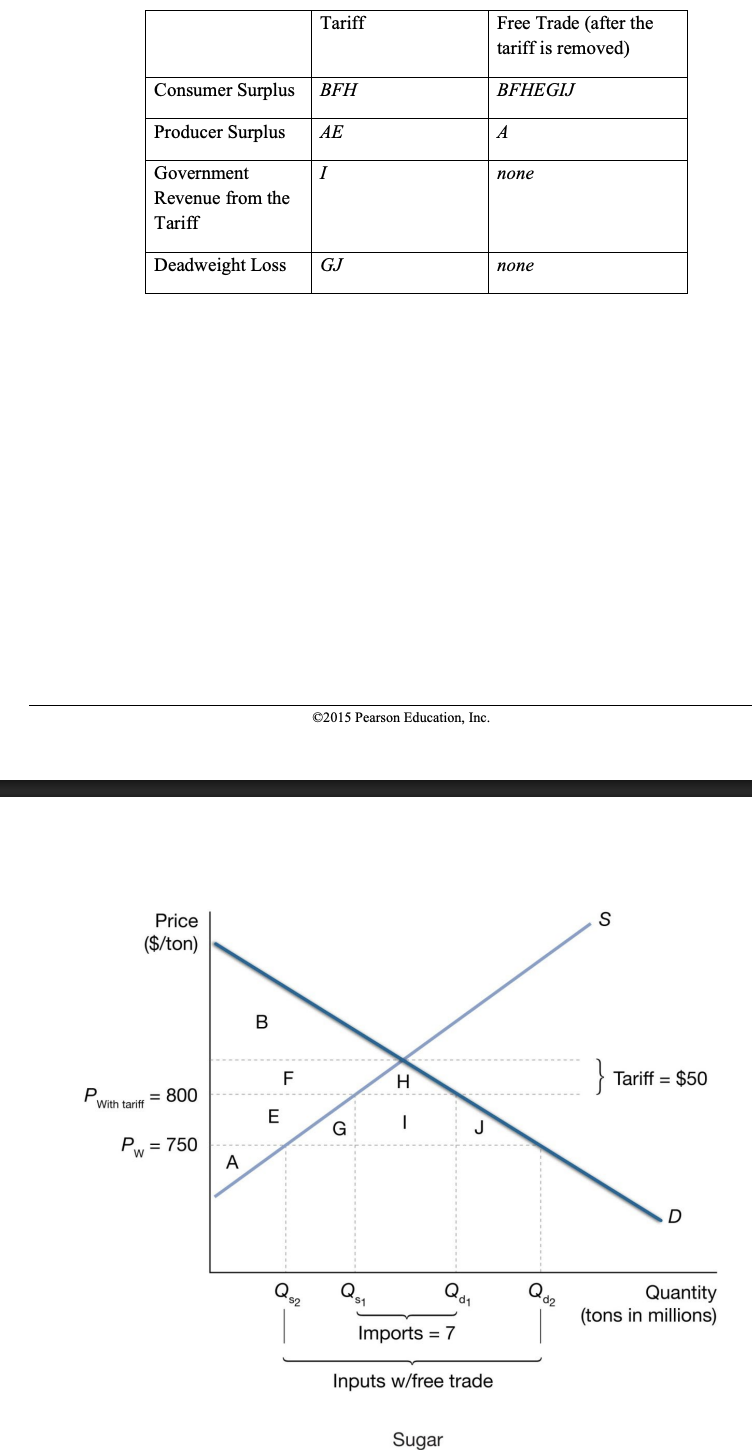
India is the world’s largest consumer of sugar. Assume the world price for sugar is $750 per ton.
A. Assume India currently has a $50 per ton tariff on sugar and imports 7 million tons of sugar. Show the situation below with a graph for India. Label the domestic quantity demanded Qd1 and the domestic quantity supplied Qs1.
B. Now suppose India decides to remove the tariff, show the effect of imports on the graph and label the new domestic quantity demanded Qd2 and the new domestic quantity supplied Qs2.
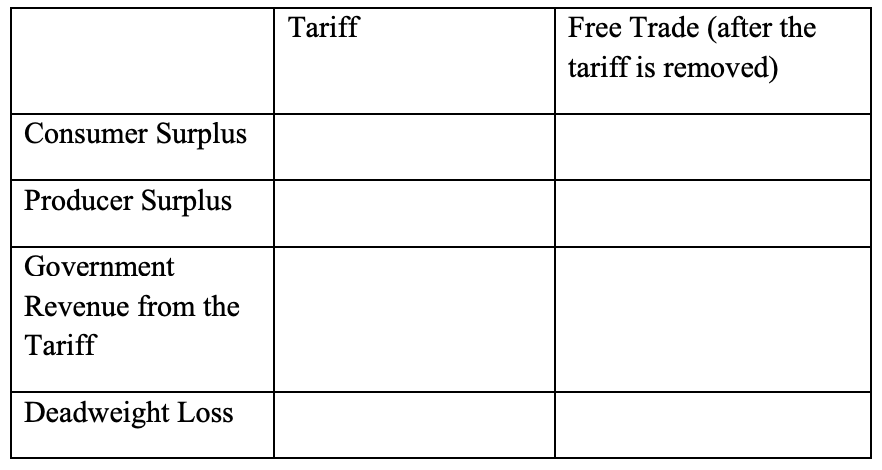
C. Label the areas in your graph following the pattern used in Exhibit 8.15 and fill in the table below.
If there are two producers who each produce the same two products at different costs, which of the following cannot happen?
a. One producer has an absolute advantage on one of the products.
b. One producer has a comparative advantage on one of the products.
c. One producer has the comparative advantage on both products.
d. One producer has the absolute advantage on both products.
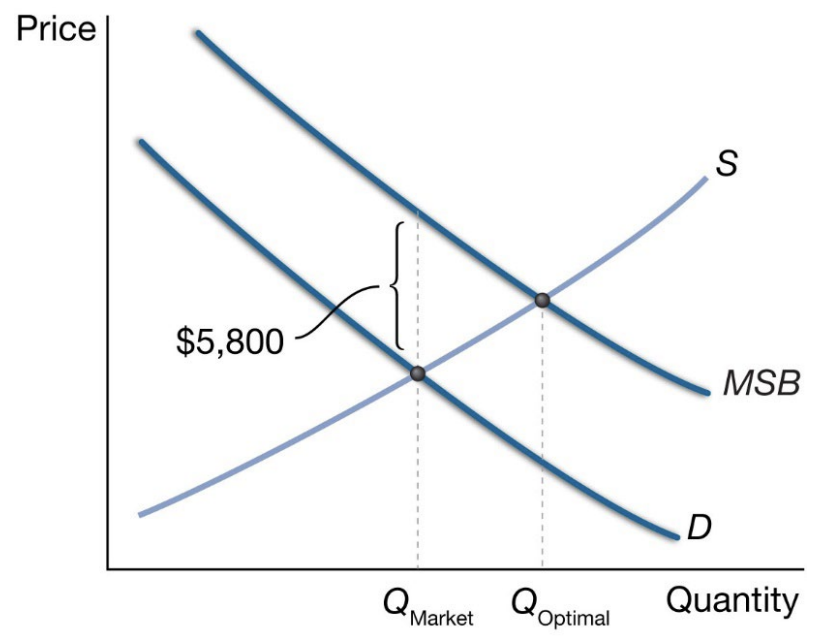
A Rand study in 2006 investigated the potential costs and benefits of providing preschool education to children in California. The study estimated the present value of the lifetime benefits that would accrue to the children and their families as well as the benefits to the rest of society. For children who were deemed high-risk, the study projected that the lifetime benefits to the rest of society would be approximately $5,800 per child. Use a demand-supply graph to illustrate the equilibrium market quantity of preschool education for high-risk children with no government intervention. Use the information provided above to illustrate the socially optimal quantity of preschool education.
See graph below. The $5,800 represents the value of the positive externality to the rest of society of a child enrolling in preschool. Therefore, the MSB (marginal social benefit) curve is exactly $5,800 above the demand curve at each point. The market quantity of preschool education occurs where the marginal private benefit/demand equals the private marginal private cost/supply curve (point Qmarket). The socially optimal quantity of preschool education occurs where the MSB to society is just equal to the cost to society. It may be the case that the MSB curve always lies above the supply curve, so in this case it would be optimal for all children to enrol in preschool. This is an empirical question.
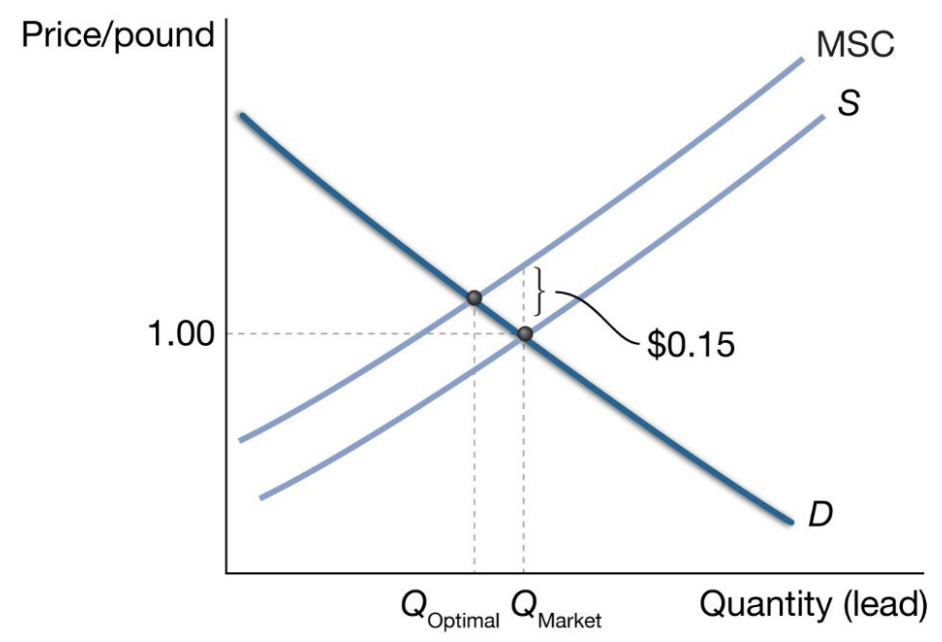
An article in the New York Times on December 30, 2013 documented that the wastewater from factories in the city of Chenjiawan, China is polluting the water used to irrigate fields with industrial waste. Suppose lead factories sell the lead for $1.00 per pound when there are no government regulations. However, also assume that the cost of the water pollution from the production (smelting) of lead is $0.15 per pound. Show the equilibrium market quantity in a graph. Also draw the marginal social cost curve on the graph, and label the optimal quantity of lead.
See graph below. In this case there is a negative externality of $0.15 for each pound of lead that is produced. Therefore, the marginal social benefit curve is exactly $0.15 above the supply curve at each point. The socially optimal quantity (Qoptimal) is less than the quantity that would be observed in an unregulated market (Qmarket).
The Santos children like to play in their house. Suppose that a negative externality of their games is noise that the children’s mother and father endure. In this scenario, would you expect the private solution to reach the socially optimal level of playing? Be sure to justify your answer by applying the assumptions of the Coase Theorem to this scenario.
There are many ways to approach this question. One possible solution could suggest that the property rights are clearly defined by the parents—they have a right to silence. In addition, there are only a few agents on each side of the bargaining table and transaction costs are relatively low. A second approach might suggest that parents and children have trouble communicating and therefore transactions costs are high, or alternatively, that it is difficult to define the acceptable level of noise and for children to understand the definition. In this last case, there may be too much playing (and therefore noise) until the parents are willing to get the children to stop. The goal of this question is to get the students to think creatively about the assumptions required for the Coase Theorem to hold.
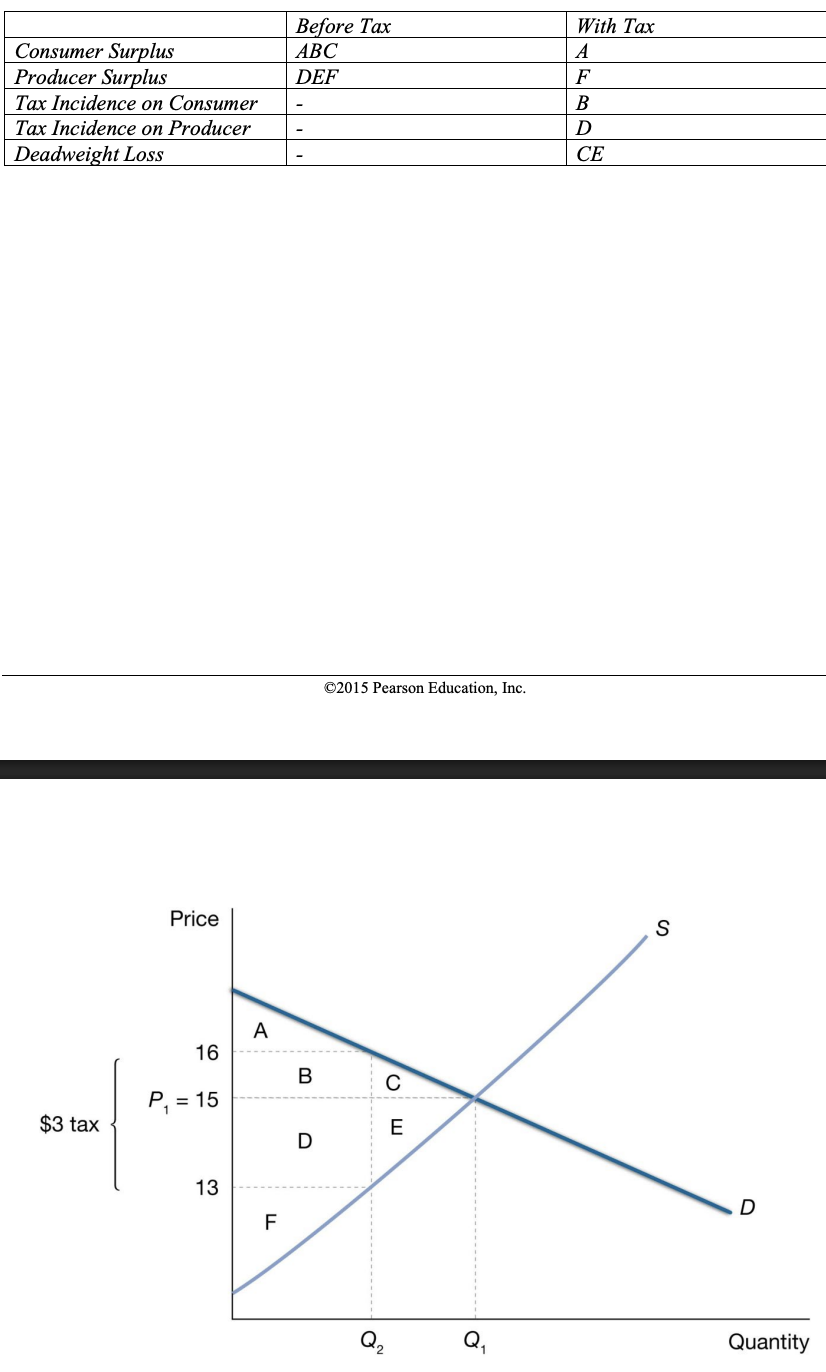
Suppose the market for movies on DVD is perfectly competitive and the market price is $15 per DVD. Now assume the government decides to put a $3 tax on each DVD sold and as a result of this policy change, consumers must pay a total of $16 to buy a DVD.
A. What share of the tax are consumers paying?
B. What share of the tax are producers paying?
C. On a graph clearly label the areas on the graph that represent consumer surplus, producer surplus, tax incidence on consumers, tax incidence on producers, and deadweight loss before and after the tax.
A. The price to consumers has increased by $1. The consumers are paying $1 of the $3 tax or one-third of the tax.
B. The producers were receiving $15; however, if consumers are now paying $16 and then $3 goes to the government then the producers are left with only $13. As a result the producers are paying $2 of the tax or two-thirds.
C. See the graph below
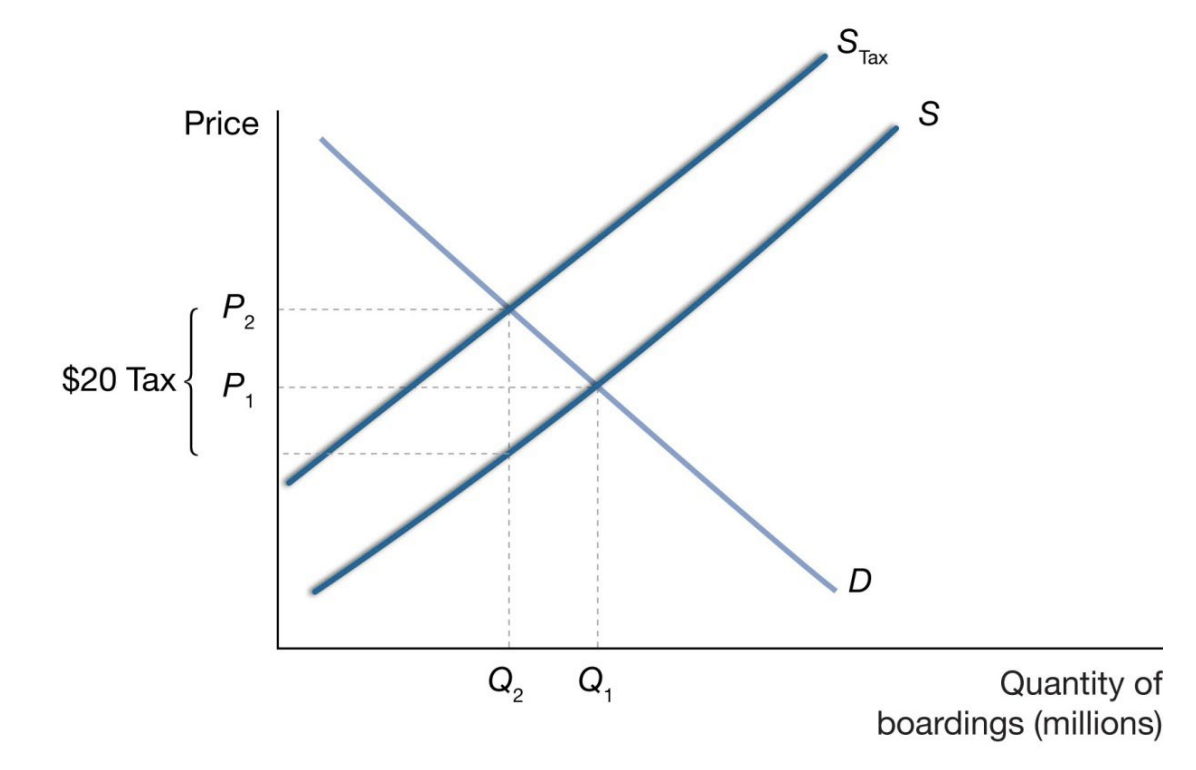
Suppose the state of Virginia is struggling with its budget. Assume that in order to raise revenue the state decides to put a tax on all airline boardings (each time a person gets on a commercial flight). The state makes two claims:
Claim #1: “We will not harm consumers. The tax of $20 for each boarding of a plane in Virginia will be paid by the airlines.”
Claim #2: “Last year, there were 1,000,000 airplane boardings in Virginia so we expect to raise $20 million dollars with this tax.”
Assess each of these two claims using a graph, evaluate the two statements made by the state. Explain in two to three sentences why you think the statements are likely correct or incorrect.
Claim #1 is false. As we learned in the chapter, the incidence of the tax is not influenced by whether the tax is officially imposed on consumers or producers. The consumers would pay a portion of this tax. Claim #2 is also false. In order to raise the full $20 million from the tax, the equilibrium quantity of boarding would need to stay exactly the same. While we have too little information in this question to estimate the change in boardings, we can be confident that there would be something less than the original quantity.
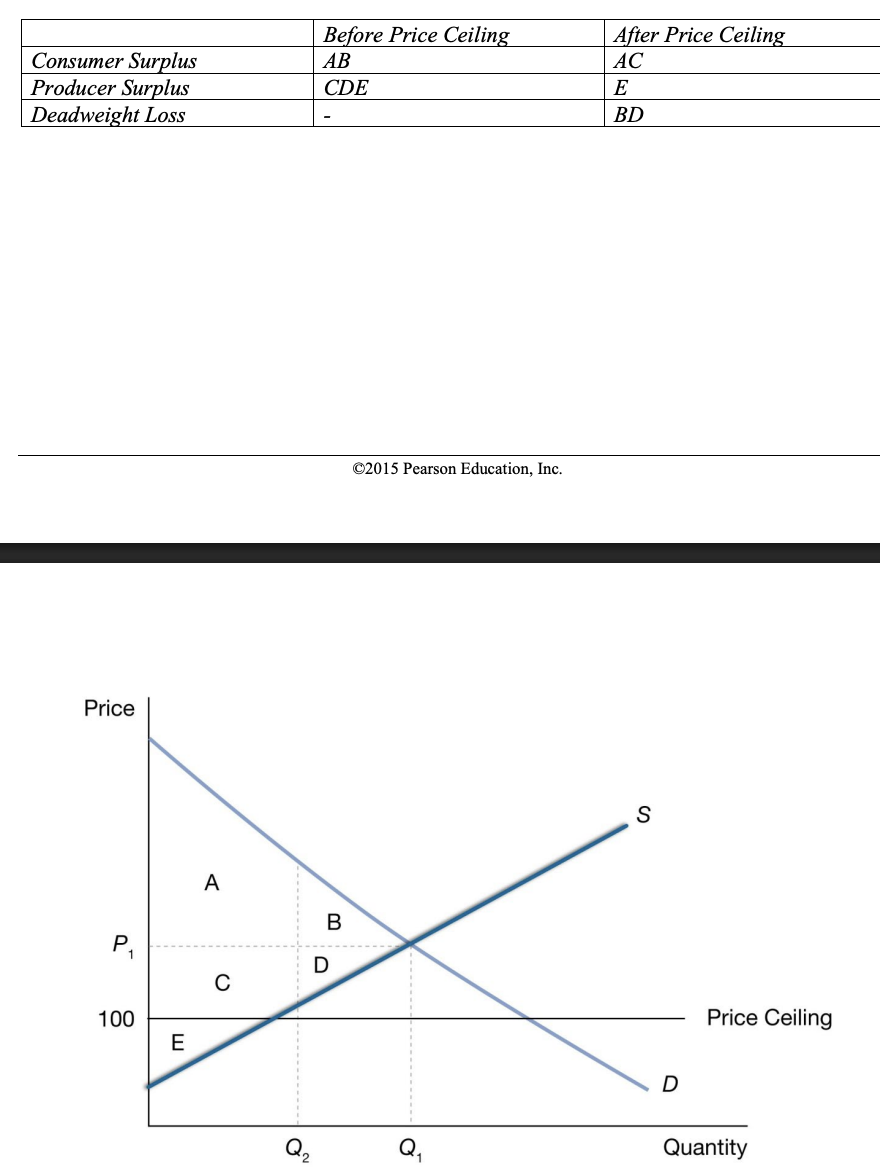
Recently many politicians have raised concerns over increasing average price of textbooks. Suppose the U.S. government passed a law mandating that textbooks have a maximum legal price of $100. Show the impact of this proposal in a graph. Clearly label the equilibrium price and quantity after the price ceiling takes effect. Also label consumer surplus, producer surplus, and deadweight loss before and after the policy is in effect.
Suppose the broadcast of a public radio station in a rural part of Idaho can only reach the homes of 5 individuals. In the past year, two of these individuals donated $10 each to the station, and one person donated $5. The other two people did not donate any money. Alex suggests that we can use this information to estimate that the total benefit from the public radio station is $25. Do you agree with Alex? If you disagree, do you believe the value of the station is higher or lower than $25? Explain your answer.
Public radio can be classified as a public good. It is both non-excludable and nonrival in consumption. The value of the station would be calculated by adding together the maximum willingness to pay for each of the 5 individuals who might enjoy listening to the station. The value of the station is likely higher than $25. We observe that 3 of the individuals decide to donate; however, there is no reason why these individuals would give the amount equal to their willingness to pay. We can be confident that the value of the station is at least $25 as the individuals gave the money without any requirement to do so in order to listen. In addition, the two individuals who do not donate may be free riders and have a positive willingness to pay.
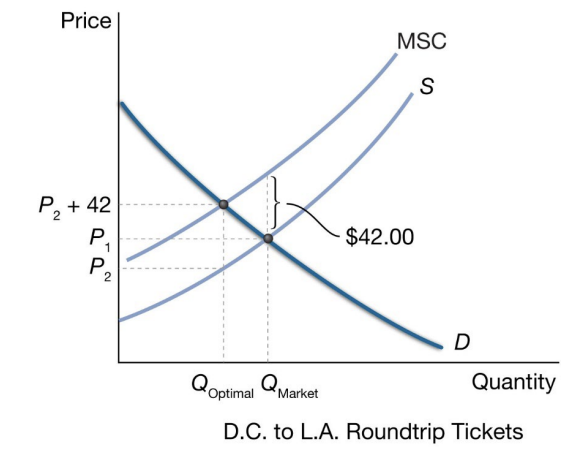
A person flying round-trip from Washington D.C. to Los Angeles is responsible for approximately 0.7 metric tons of carbon dioxide emissions. The Environmental Protection Agency provides estimates of the marginal cost of one ton of carbon dioxide emissions. Under varying assumptions, one set of estimates ranged from $12 to $60 per metric ton. Based on these estimates, what is the range for the Pigouvian tax that would internalize the negative externality? In a demand-supply graph, illustrate the effect of the optimal tax using the $60 per metric ton estimate. Discuss the implications if the estimate of the cost of carbon dioxide emissions is significantly above the true cost. What are the implications if it is significantly below the true cost?
See the graph below. The marginal social cost curve is the value of the negative externality plus the supply curve. In this scenario, the value of the externality is calculated by multiplying the amount of pollution from one person on this round-trip flight (0.7 metric tons) times the cost per metric ton. A Pigouvian tax is set at the amount equal to the negative externality. In this example, we are unsure of the value of the negative externality. We estimate that is it between $8.40 (0.7*$12) and $42 (0.7*$60). The effect of the optimal tax of $42 is shown in the graph.
If the tax is based on an overestimate of the damage (for example $60 per metric ton when the actual damage is $12 per metric ton), then the tax will result in too few flights. However, if the tax is significantly below the true cost then there will be too many flights relative to the optimal number of flights.
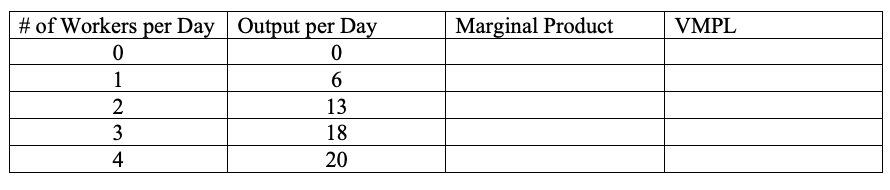
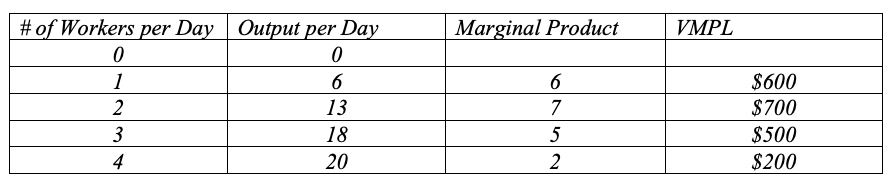
James runs a satellite TV repair service. James has a fixed number of trucks and equipment. The table below shows the relationship between the number of workers per day and the output per day (number of repair jobs that are completed). The price for each repair is $100. Calculate the marginal product and the value of the marginal product in the table below.
See the table below. The marginal product is the change in the output for one additional worker. The value of the marginal product of labor is the marginal product of the worker multiplied by the price of output ($100)
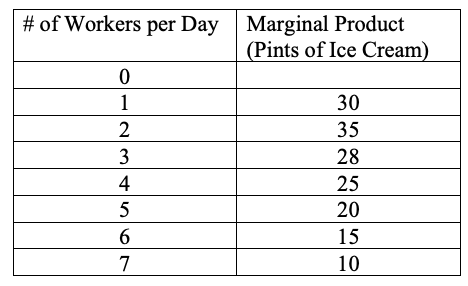
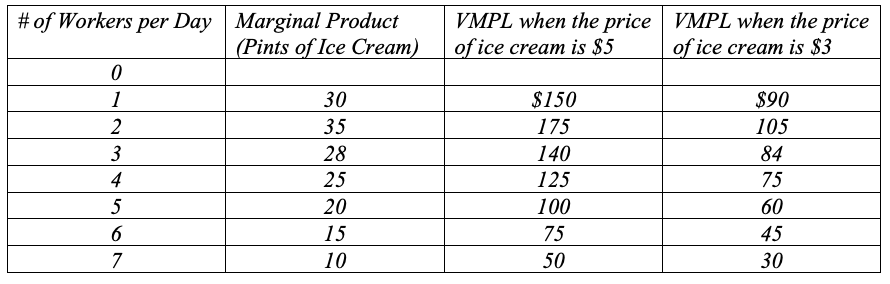
Farmer Annie’s Ice Cream Shop has calculated the marginal product of labor and the results are shown in the table below. The wage for workers is $75 per day and the pints of ice cream sell for $5 per pint.
A. How many workers should Farmer Annie hire?
B. If the wage for workers increases to $100 per day, how many workers will Farmer Annie hire?
C. If the wage for workers is $75 per day and the price of ice cream falls to $3 per pint, how many workers will Farmer Annie hire?
See the table below. Farmer Annie will maximize her profit by hiring workers until the value of the marginal product is equal to the wage.
A. When the wage is $75 per day and the price of ice cream is $5 per pint, Farmer Annie will hire 6 workers.
B. When the wage increases to $100 per day Farmer Annie will only hire 5 workers.
C. When the wage is $75 per day, but the price of ice cream falls to $3 per pint, she will only hire 4 workers.
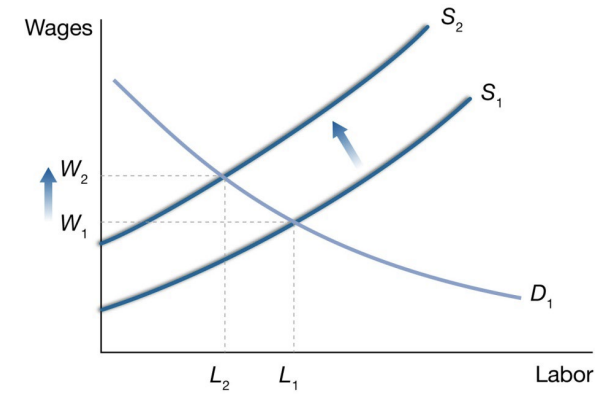
Suppose you run a pizza restaurant in a college town and your primary source of labor is college students working to pay for college. Draw a demand and supply curve for the labor market. Suppose the college receives a large gift and they use it to increase financial aid available to students. Show the effect of this gift on the labor market for local college students.
The increase in financial aid will likely increase the reservation wage for college students and therefore will shift the supply curve of labor leftward. See the graph below.
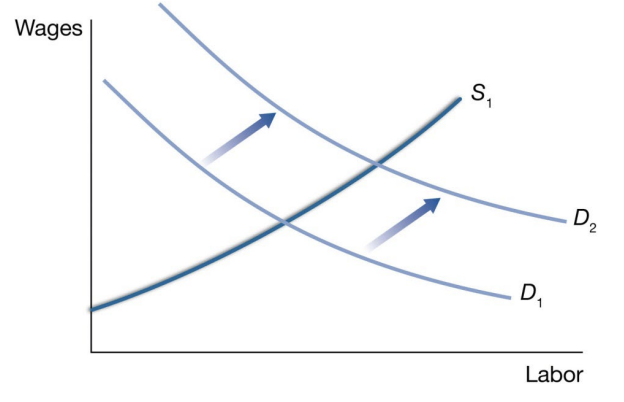
Consider a graph of the demand curve for labor. If the population of workers increases their amount of education and workforce training, how does this influence the demand curve for labor?
The increase in the human capital of workers increases the marginal product of workers. This increase in productivity will shift the demand curve rightward for these workers. See the graph below
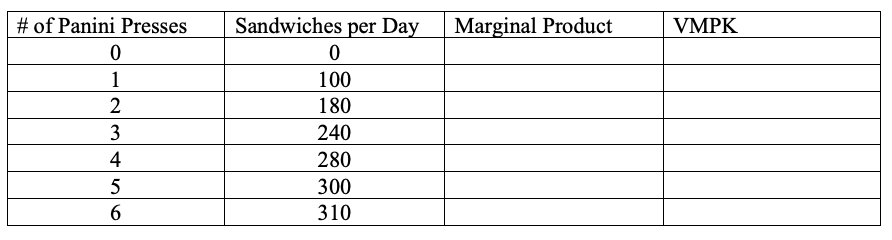
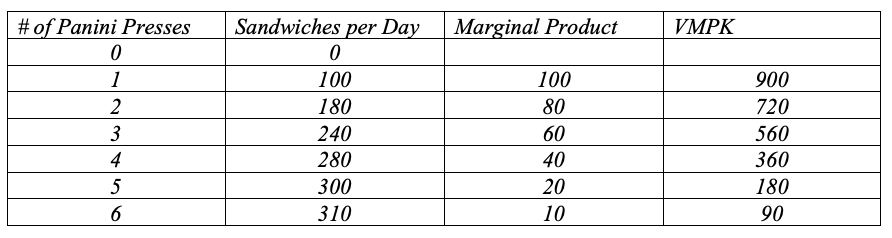
Dave’s Pressed Sandwiches serves sandwiches made from a Panini press. If Dave sells sandwiches for $9 each and Panini presses have a rental rate of $200, calculate the marginal product of additional Panini presses and the value of the marginal product of capital. How many Panini presses should Dave have in his restaurant?
See the table below. The marginal product is additional sandwiches made by adding a Panini press or the change in the total number of sandwiches. The VMPK is the marginal product multiplied by the price of sandwiches, $9. If the price of a machine is $200 per day then Dave should have 4 Panini presses. Adding the 5th Panini press would provide an additional $180 in revenue, but cost an additional $200.
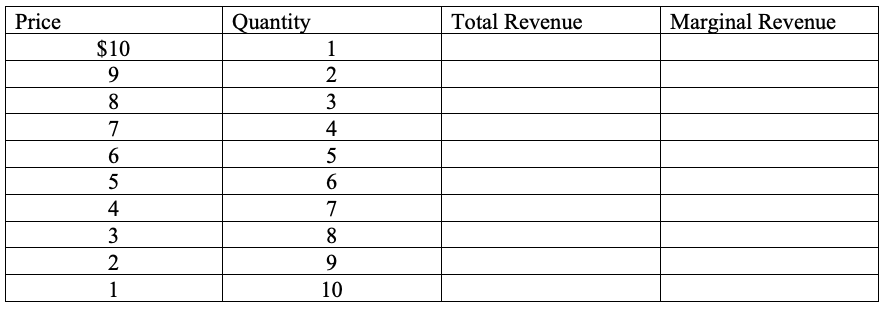
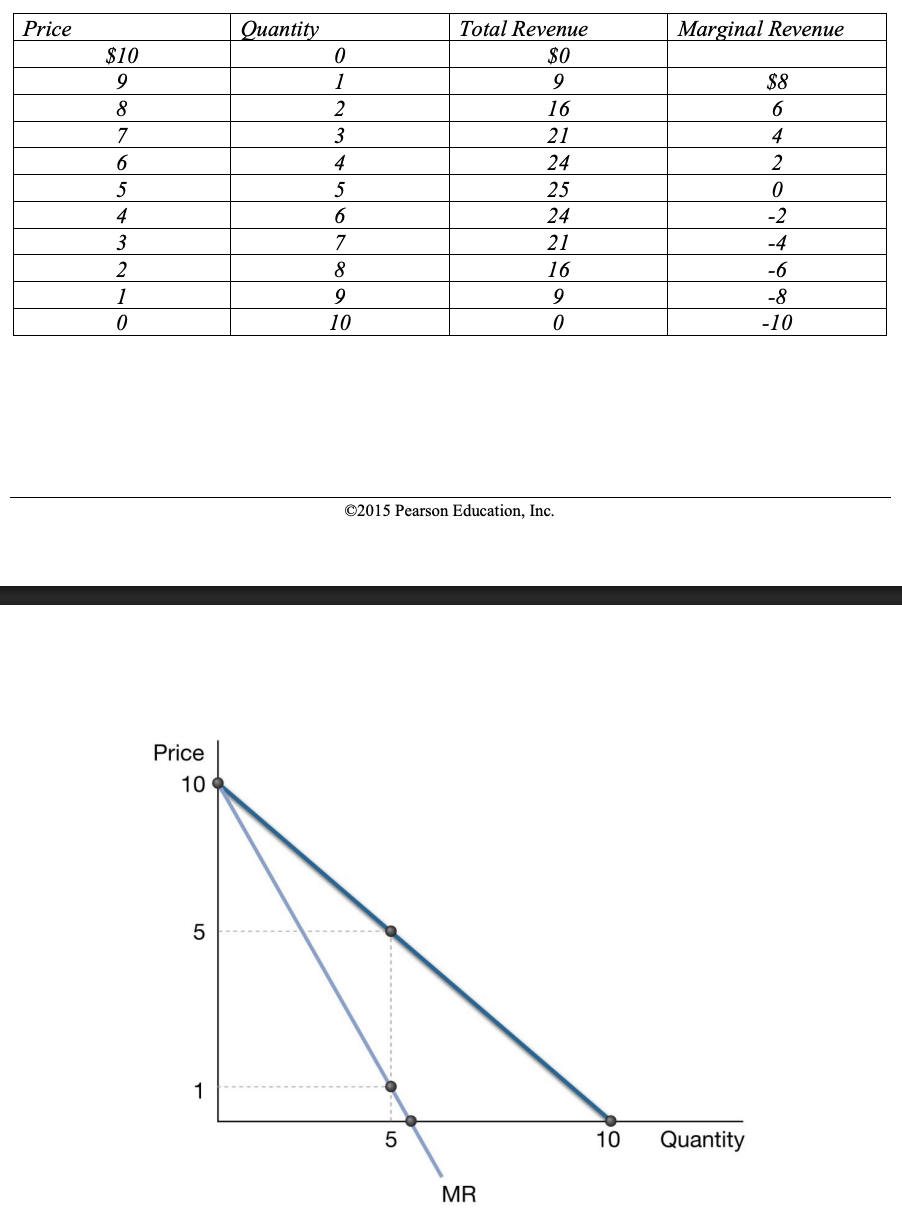
Jimmy is the only child who lives on his street. He opens a lemonade stand in the summer and no other residents are interested in competing with Jimmy. Jimmy’s demand schedule is shown in the table below.
A. Calculate the total revenue and marginal revenue for each change in quantity.
B. Graph the demand curve and the marginal revenue curve.
C. If Jimmy’s mom pays for all of his costs of production and he has nothing else to do with his time in the summer, we assume a marginal cost of zero. If this is the case, what price should Jimmy charge to maximize profits?
See the table below. Jimmy maximizes profit where MC=MR and we know MC = 0. Jimmy does not produce the 6th unit since MR = -1 but will produce the 5th since MR = +1. Remember that MR is the additional revenue between the 4th and 5th units since we are using discrete units here. If marginal cost equals zero, the profit is maximized at the same point that maximized total revenue; the price equal to $5. The graph below shows the demand curve as a smooth function (P = 10 - Q), you could also show the demand curve as steps similar to Exhibit 12.12
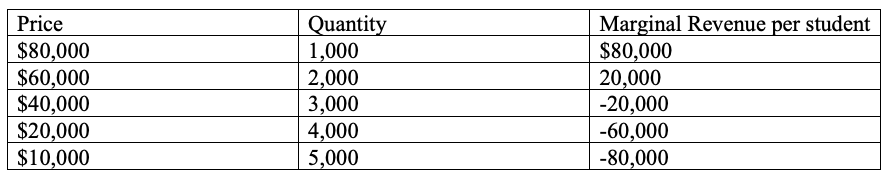
Colleges gather a large amount of data about each applicant before making a decision about financial aid (as well as admission). For simplicity assume that there are only 5 types of students based on willingness-to-pay and that there are 1,000 students of each type. Also assume the college has a marginal cost of $15,000 per student and that the college attempts to maximize profit (though most colleges are non-profit, they still want to be efficient).
A. If the college does not practice any price discrimination and charges all of the students the same price, what price would they choose? How many students would attend the college?
B. If the college is able to charge each group based on their willingness-to-pay, what will the college charge each group of students (the college charges different prices to different students using merit or need-based financial aid)? How many students would attend the college?
A. The college would select where MR = MC. The two are never equal, therefore they select the last point where MR > MC or a price of $60,000. At this price, 2,000 students will attend.
B. If the college can practice price discrimination by group, they will charge the tuition that each group is willing to pay: the first 1,000 students will be charged $80,000 each; the second thousand students will pay $60,000 each; the next group will be charged $40,000; and the fourth group will pay $20,000 each. A total of 4,000 students will attend in this scenario. The college will not enroll the last group of students because the students are only willing to pay $10,000 while the marginal cost is $15,000 (in the real world, colleges may still enroll some of these students due to objectives outside of profit maximization such as merit-based aid or a desire to have the student body be more representative of the general population).
If the college in Exercise 2 has a fixed cost of $100 million, what is the profit for the college for each of the two scenarios above (Part A and Part B)? (
The profit is calculated by determining the total revenue and subtracting total cost. Total cost is the sum of the variable cost plus the fixed cost. Variable cost will be $15,000 multiplied by the number of students and fixed costs are $100 million. For part A the college is operating at a loss of $10 million (TR = $120million; VC = $30million; FC = $100million). For part B the college has a profit of $40 million (TR = $200million; VC = $60million; FC = $100million). The TR is (80,000*1,000) + (60,000*1,000) + (40,000*1,000) + (20,000*1,000).
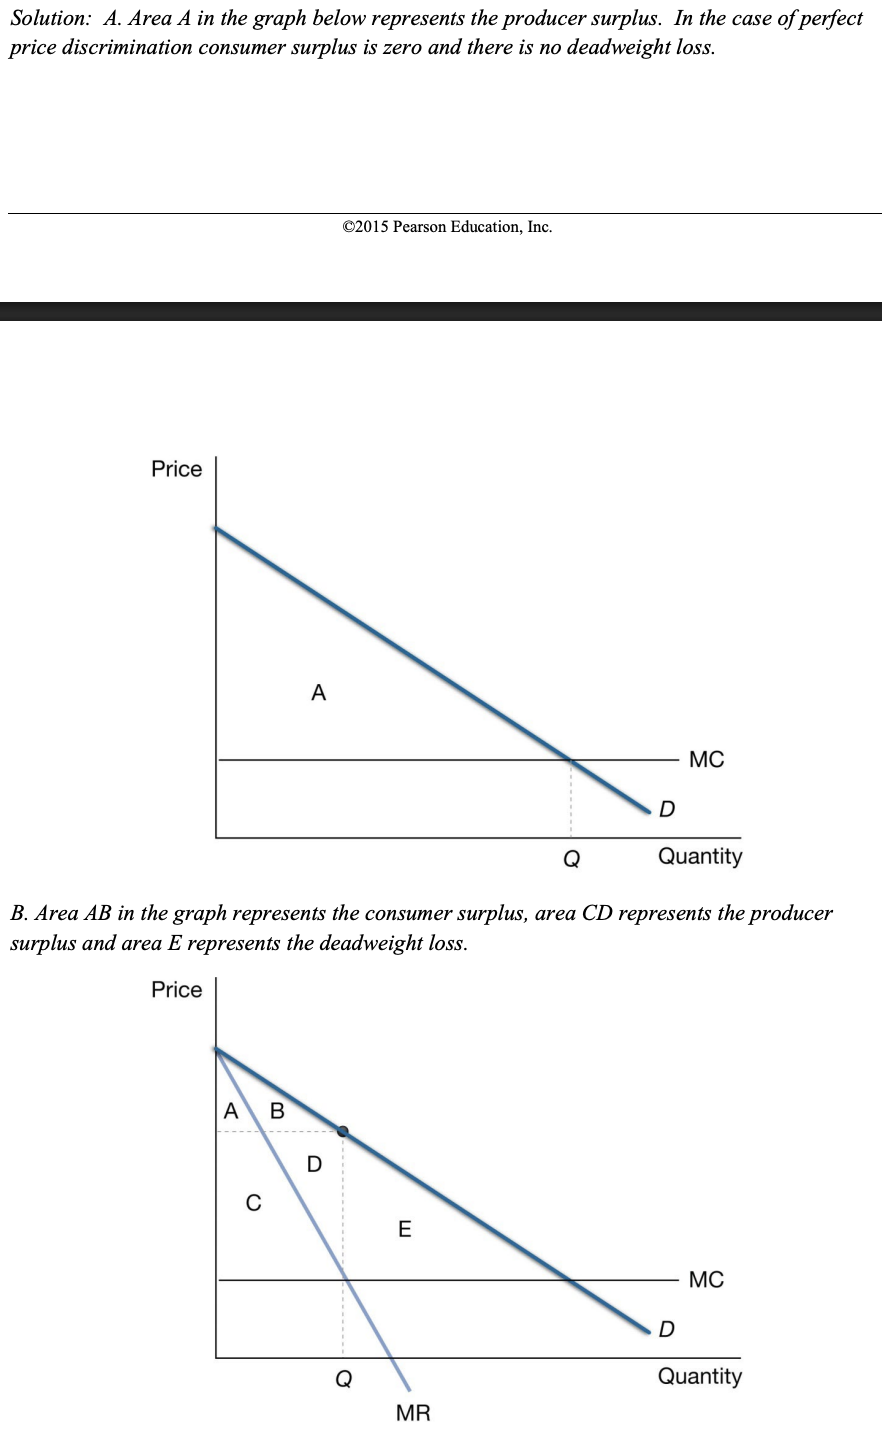
Suppose Ted’s Motors is the only firm selling cars in a small, rural town in South Dakota. Assume that people in the town do not want to leave the town to buy cars. Also assume that there is a constant marginal cost for Ted’s Motors.
A. Draw a graph for Ted’s Motors that shows the firm carrying out perfect price discrimination (first-degree). Label the producer surplus, consumer surplus, and deadweight loss in the graph.
B. Now suppose the city council hears of Ted’s Motors’ practices and outlaws price discrimination (and assume they can successfully enforce it). Draw a NEW GRAPH showing what Ted’s Motors will do to maximize profits. Label the producer surplus, consumer surplus, and deadweight loss in the graph.
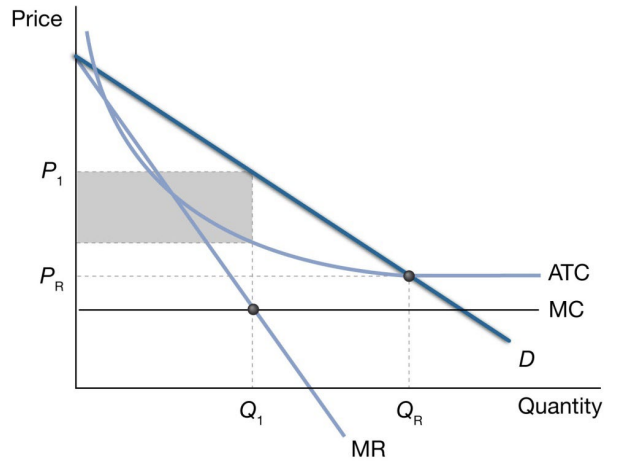
Assume that the Smith’s Power Company is granted a monopoly to provide electricity to a rural area. The company has economies of scale and their ATC and MC cost curves are similar to those in Exhibit 12.2.
A. Label the price and quantity of electricity in the market if Smith’s Power Company behaves as a profit-maximizing monopolist. Shade in the area that represents Smith’s Power Company’s profits in this scenario.
B. On the same graph label Pr and Qr the price and quantity we would observe if the government regulated Smith’s Power Company by allowing them to charge the fair-returns price.
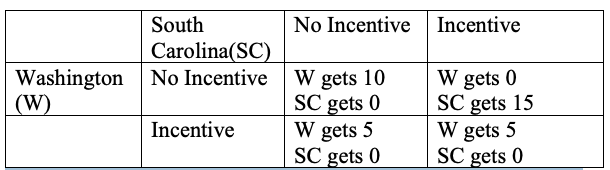
In the late 2000s, Boeing decided to build a new plant to manufacture the Boeing 787 Dreamliner. Many areas were hoping that Boeing would decide to build the plant in their state. To attract Boeing, the states considered offering large tax incentives. Assume that two states were under serious consideration by Boeing: Washington and South Carolina. Also assume that each state had two options: no incentive or offer an incentive. Notice that in the payoffs that follow, Boeing selects Washington if both states offer an incentive.
A. Does Washington have a dominant strategy? If so, what is it?
B. Does South Carolina have a dominant strategy? If so, what is it?
C. Is there a dominant strategy equilibrium? If so, what is it?
D. Are there any Nash equilibria in this game? If so, what are they?
A. No, Washington does not have a dominant strategy.
B. Yes, South Carolina has the dominant strategy of offering an incentive.
C. Yes, because Washington knows that South Carolina has a dominant strategy of offering an incentive, Washington will also offer an incentive.
D. Yes, there is one Nash equilibrium: both offer an incentive.