measures of dispersion
1/34
Earn XP
Description and Tags
stats that tell you hoe clustered or spread out your data is around its mean
Name | Mastery | Learn | Test | Matching | Spaced | Call with Kai |
|---|
No analytics yet
Send a link to your students to track their progress
35 Terms
what are the mean, the median, and the mode not able to do?
doesnt allow us to describe the differences between groups inside the dataset
dont allow us to see the activity of the data points
what do the measures of dispersion include? (4 things)
range
interquartile range
variance
standard deviation
what is range?
take largest value (the maximum)
subratct the smallest value (the minimum)
what does the range tell us?
how distant your smallest and largest values are
especially when the mean, medians, and modes are almost the same
cons of knowing the range
only takes into account the 2 most extreme points of the data
needs other measurese of dispersion to get the bigger picture
what are quartiles?
results of diving yout data into "quarters”
median cuts the data in half, the quartiles cut the data in 4
what is the first quartile (Q1)?
data point half way betwwen your lowest value and the median
first 25% of the data
what is Q2?
the median
what is Q3?
aka upper quartile or third quartile
data point half way between the median and the highest value
25% of the data is above it
what is Q0?
the minimum
what is Q4?
the maximum
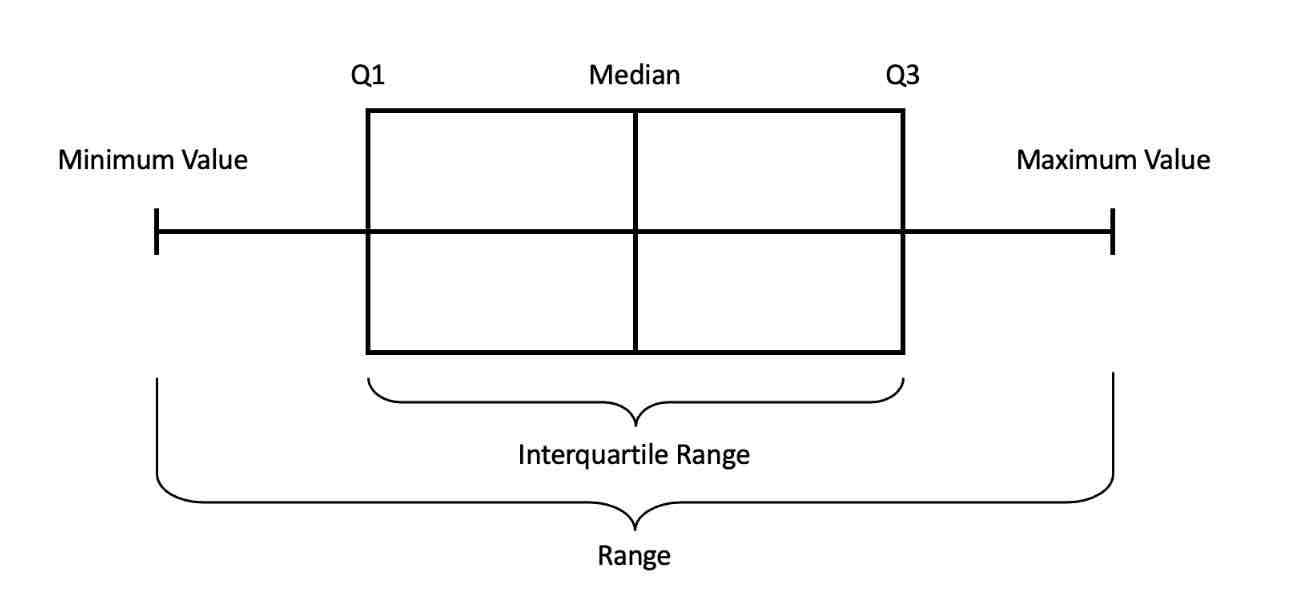
what is the five number summary?
set of descriptive stats
minimum
q1
q2
q3
maximum
what is interquartile range?
difference between Q3 value and Q1 value
what does the interquartile range tell us?
the range within which the middle 50% of your data falls
what is the advantage of knowing the interquartile range?
generally givers a clearer idea of the dispersion of data
it is not sensitive to extreme values
what are Box plots? (aka whisker plots/candlestick chart)
graphical display of the 5 number summary (min, q1, q2, q3, max)
con of box plots
dont give much detail about the data’s distributions
what are box plots useful for?
detecting whether or not your distribution has
outliers
or is skewed
comparing the distribution of different data points or subgroups
center, spread, and range are clearly displayed
Box plot
what are outliers?
datapoints that are an abnormal distance above or below the other data in your sample
how to find outliers?
with the interquartile range (IQR)
multiple the IQR by 1.5
mild outlier: if the value is less than Q1 - 1.5(IQR) or greater than Q3 + 1.5(IQR)
extreme outliers: more than 3IQR above Q3 or 3IQR below Q1
what are the types of outliers?
multiple the IQR by 1.5
mild outlier: if the value is less than Q1 - 1.5(IQR) or greater than Q3 + 1.5(IQR)
extreme outliers: more than 3IQR above Q3 or 3IQR below Q1
what is the lower inner fence?
voundary separating the low mild outliers
what is the upper inner fence?
boundary separating the high mild outliers
what are upper and lower outer fences?
boundaries diving the extreme outliers from the rest of the data
what is variance?
a measure of dispersion that captures how spread out all of the datapoints are in your data set
describes the spread of our data in relation to the mean
how do you calculare variance”
the average of the squared differences between each data point and the sample mean
what is standard deviation?
square root of the variance
most frequently used measures of dispersion?
variance
standard deviation
what are the steps to calculate the variance?
(value 1 - mean)² = “squared difference”
add all squared differences and divide by the number of datapoints
- 1 (if your data is from a random big sample)
how to calculate variance using google sheets?
=VARA for varianve of a sample
=VARP for variance of population
what is standard deviation useful for?
for comparing the dispersion of 2 variables (or categories of a variable) that have similar means
standard deviations are, like the mean, sensitive to _____.
outliers
what is the difference between the variance and the standard deviation?
the standard deviation is the average distance from the mean
the variance is the squared average distance from the mean
why is it better to interpret data using standard deviation (and not the variance)?
because the standard deviation is always in the same unit of analysis as your dataset
centimeters, scores, height, goals, etc.