Research Methods
1/70
There's no tags or description
Looks like no tags are added yet.
Name | Mastery | Learn | Test | Matching | Spaced | Call with Kai |
|---|
No analytics yet
Send a link to your students to track their progress
71 Terms
What are the ethical concepts?
BIRJN- Beneficence, integrity, respect, justice, non-maleficence
Define beneficence
- commitment to maximising benefits and minimizing harm when taking a particular course of action.
Example: Medical drug trial ensuring life-saving treatment benefits outweigh risks.
Define integrity
The commitment to knowledge and understanding and honest reporting of all info. and results, whether favourable or not.
Example: reporting both expected and unexpected findings.
Define respect
-the consideration of all living things and their capacity to make their own decisions
Example: Survey allowing participants to skip questions and withdraw at any time.
Define Justice
Treating all participants fairly and equally, ensuring that no group bears an unfair burden of research and that all groups have fair access to its benefits.
(e.g. Selecting a diverse and representative sample so that no particular group is excluded/overrepresented.)
Define non-maleficence
Avoidance of causing harm
Example: Psychological stress study avoiding extreme stressors and providing support.
What are the 6 Participants’ rights? CVIWDD
CVIWDD (Confidentiality, voluntary participation, informed consent, withdrawal rights, deception, debrieifing)
Define Confidentiality
-All personal details/information/results gathered from participants should be kept private
Define voluntary participation
Participants must not be forced, pressured, or bribed to be involved in the study
Informed consent
-Participants must be told about the nature, risks, and rights of a study prior to the study and sign a permission form (or if under age a parent/guardian signs)
Withdrawal rights
Participants are allowed to stop participating in experiment at any time, can also ask to have their results removed.
Deception
Sometimes providing too much info. about a study can impact accuracy. When necessary, you can withhold some of the information about the study, providing it does not cause distress to participants and they are de-briefed afterwards.
Debriefing
Participants must always be provided with information about the nature, results, and conclusions at the end of the study
-any damage or misconceptions must also be reserved
-psychological support is also offered to participants post study
Define accuracy
-Closeness to true value of quantity being measured, impacted by systematic errors (a scale always reading 5 grams higher)
(SE- affects everyone equally, shifts true value consistently in the same direction for all data point, usually comes from a fault in the procedure, equipment, or measurement method, not from random chance)
Define Precision
Closeness of a set of values to one another, impacted by random errors
(RE- unpredictable variations in results that don’t follow a pattern such as weight measurements fluctuating due to standing on different positions on the scale)
How can an experiment have high repeatability
-The ability to obtain consistent (similar) results when an experiment is conducted again under the same conditions of measurement
-to achieve high repeatability, the experimental procedure, materials, and participants should be as standardised as possible to minimise variability.
-The result of the repeated experiment should be compared with the original one to determine if the experiment produces consistent findings.
What makes a psychological investigation internally valid?
-If it investigates what it claims to investigate (if the IV is the only variable causing a change in the DV, if study not internally valid, external validity is irrelevant
What makes a pysch. investigation have high external validity?
If results of the research can be applied to similar individuals in a different (external) setting, increased by using sampling techniques that are more representative of the population.
What is internal validity
Internal validity is the extent to which data obtained for a study are actually due to the variable(s) that were tested and not any extraneous or confounding variable
Extraneous variable- any variable other than the IV that can cause change in the DV
Confounding variable- any variable other than the IV that has had already had a systematic effect on the DV. (if only one group was tested in morning)
Define extraneous variables
e.g participant differences - any variable other than IV that has unwanted effect on DV, found before data collection to control
Define confounding variable
Any variable other than IV that influenced the DV, also casually affects IV, usually found after experiment completion, means starting over.
Define internal validity
The extent to which the results obtained from the study are due to variables tested- the appropriateness of the investigation design, sampling and allocation, techniques, as well as the impact of extraneous and confounding variables on the investigation results are considered.
What is within subjects design?
Where all participants are exposed to both conditions
Pros: Eliminates participant related differences (extraneous variable impacting validity), required less participants
Cons: Creates variables that have unwanted effects based on the order the experiment was conducted in, more time consuming as both conditions cannot be tested at the same time.
Define between subjects design
There are two different groups- when participants are in either the control or experimental group
Pros: Lowers rate of participant withdrawal, less time consuming as both groups can be tested at the same time
Cons: Participant differences can impact results, more participants are needed
Mixed subjects design
An experimental design that tests the effects of two independent variables by combining within- and between-subjects methods.
Researchers could test the effect of background noise and time of day on short-term memory performance using a mixed design.
The first IV (background noise) would be a between-subjects factor, with one group tested in a quiet room and another in a noisy room.
The second independent variable (time) would be a within-subjects factor, as all participants are tested both morning and afternoon. The quiet room group would serve as the baseline condition for comparison.
Cons: Higher rate of participant withdrawal, due to being more time consuming, impacting internal validity.
Pros: Testing multiple IVs in one investigation can be time and cost effective, differences in participant variables controlled in within subjects element
Describe the data collection method of self report
Participants express their thoughts and feelings by answering open ended or fixed response questions
Pros: Time effective, cost-effective, anonymous so more likely to be honest, caters for participants who cannot read or write
Cons: Individuals may misinterpret the questions, give socially acceptable answers (social desirability bias), may not elaborate on responses
Describe the data collection method of an observational study
-actively watching the overt behaviour of participants in their natural environment.
Pros: More likely to see the “true” behaviour of participants
Con: Observer bias may occur
Describe the data collection method of a case study
-Detailed, in depth report on an individual or group
Pros: Provides detailed information, usually about a rare phenomenon
Cons: Usually a small sample size, so findings cannot be generalised to a larger population
Describe the data collection method of an experiment
Tests the cause and effective relationship between the IV and DV, tests a hypothesis under controlled conditions
Pros: Conducted under controlled conditions so there is more control on extraneous variables
Cons: Conducted under “artificial environment” so cannot see the true behaviour of participants
Describe the data collection method of correlational studies
Investigates the relationship between variables without the researcher manipulating or controlling any of them
Pros: Can see how variables are naturally related to indicate patterns, tests hypothesis where it is not possible to experimentally manipulate the IV
Cons: Cannot draw firm conclusions from cause and effect relationships
Describe the data collection method of fieldwork
Collecting information by directly observing and interacting with a selected environment
Pros: Natural settings are more likely to show behaviour that reflects real life, shows rich qualitative and quantitative data.
Cons: Observed behaviour is subjective and open to bias from researchers
Describe the data collection method of a literature review
Comprehensive and critical reviews that provide an overview on current understanding in a particular area of interest, involves collating and analysing secondary data
Pros: Can determine what is already known and identify gaps in understanding for areas of future research.
Cons: Selection bias can occur which can result in the review to be unrepresentative of current understanding
Define and explain the data collection method of Modelling and Simulation
Modelling: An investigation where a physical/conceptual model is constructed/manipulated to simulate a system
Stimulation: An investigation that uses a model to replicate and study the behaviour of a system.
Pros: Allows unobservable events to be shown, can be used to study new treatments, therapies, or devices
Cons: Expensive for complex models and simulations, involves assumptions about behaviour that lowers external validity due to artificiality
Population
Larger group of research interest from which the sample is drawn
Explain the data collection method of Product, process, and system development
An artefact, process, or system that is designed to meet a human need
Sample
Subset of a population and refers to all participants that are involved in the study
Stratified sampling
Dividing population into groups based on categories: e.g female, male,) and then taking a sample from each group as it appears in the population
Pros: Helps ensure highly representative sample as it considers relevant characteristics in a population
Cons: time consuming to separate entire population into groups
Random sampling
Ensures that all participants have equal chance of being selected as a sample from the populati (Names out of a hat, table of random numbers)
Pros: Likely to generate a representative variable
Cons: Can be time consuming with larger population.
Ethics
Moral principles and standards of behaviour that must be followed when conducting scientific research or treating patients
What are the five ethical concepts (BIRJN)
Beneficence, integrity, respect, justice, non-maleficience
Define representative sample
A representative sample accurately reflects the relevant characteristics in the population- if a sample is representative, it is likely that it can be generalised to the wider population.
What is random allocation?
A procedure that ensures all participants in the sample have an equal chance of being selected for the experimental and control groups, thereby increasing the likelihood of similar spread of characteristics being present in both groups
Define experimental groups
The group of participants exposed to the IV
Define control group
The group of participants who are not exposed to the IV. This group acts as a standard for comparison to determine if the IV was what caused the change in the DV.
What is an experiment?
A study that investigates the cause and effect relationship between two or more variables
Independent variable
The variable changed or manipulated by the experimenter
Dependent variable
The variable measured by the experimenter to determine the effects of the IV.
What is an easy way to remember the difference between independent and dependent variables?
DRY MIX
D= dependent
R= responding
Y= y axis
M=Manipulated
I= Independent
X= X-axis
Define hypothesis
A testable prediction of the relationship between two or more events or characteristics
What must research hypotheses include (IPAD)
I: Independent variable
P: The population being tested
A: Analysis or prediction of the results of the experiment (must include a direction)
D: The dependent variable
It was hypothesised that POPULATION who IV CONDITION 1 would have DIRECTION SIMPLIFIED DV than those who IV CONDITION 2.
It was hypothesised that males between 30 to 40 years who were sleep deprived would have poorer driving ability than those who were not sleep deprived.
Define an extraneous variable and the categories of extraneous variables
An extraneous variable is a variable other than the IV that may cause unwanted changes in the DV- EVs are not a problem if they are controlled in an appropriate way- a conclusion may still be able to drawn if an EV is present
Categories of extraneous variables include participant variables, situational variables, demand characteristics, experimenter effects, and the placebo effect.
Define participant variables and how to control for this EV
Any characteristics that can vary naturally between participants in a study and may have an unwanted effect on the results (e.g. mood, intelligence, sex, age, personality, etc.)
-Becomes a CV only if one group has more of a certain trait that affects the DV
Control for this EV/CV:
-Change the experimental design (e.g. within subjects design)
-Obtain a large number of participants and use random sampling
-Use of random allocation: a procedure that ensures all participants in the sample have an equal chance of being selected for the experimental and control groups, and thereby increase the likelihood of a similar spread of characteristics being present in the experimental and control groups.
Define situational variables as an EV and how to control
A variable that affects the results due to the setting of the environment (e.g. Physical features of a room, instructions and procedures used by the researchers, the order in which the conditions were conducted (only in the within measures design where same participants complete all conditions of the IV)
CV if (for example) one group is tested in the morning and another in the afternoon, and time of day influences performance.
How to control for this EV/CV:
-Hold the situation variables constant throughout the experiment, allowing the participants to be tested in the same way and in the same situation
-Testing participants in random order, rather than testing all participants in one condition first, then all participants in the other condition
Define experimenter effects as an EV and how to control
-Includes any influence the experimenters may have on the results (e.g. interaction with participants, unintentional errors when making observations)
-CV if experimenter unconsciously treats one condition more positively, changing outcomes
Can control this EV/CV by:
-Keeping participants and the experimenter(s) unaware of the allocations of the experimental conditions which stops unintentional bias or different treatment influencing results.
Define demand charcteristics as an EV/CV and how to control
-Cues in an experiment that may influence or bias a participant’s response (e.g. participants may use random noises or changing in lighting) due to belief they have worked out what is being investigated
EV if some participants are influenced by it, CV if one condition encourages guessing more than the other
How to control for EV/CV:
-Deception: Withholding information to lessen likelihood of participants working out how the experimenter may be expecting them to perform
-Keep participants and experimenter unaware of the allocations of the experimental conditions
-Standardised instructions and procedures
Define the placebo effect as an EV/CV and how to control
Occurs when there is a change in participant’s behaviour due to their belief that they are receiving some kind of experimental treatment and they respond in accordance with that belief
-EV if some participants expect outcomes, CV if only one group has that expectation
How to control for this EV/CV
-Keep participants unaware of their own allocations of the experimental conditions
-Use of a placebo: A fake treatment that is like the IV treatment used in the experiment group but actually has no known effect, ensure both groups have similar expectations
What are the different types of data?
Qualitative data: Data that describes the changes in the quality of something (e.g. describing the parenting style your parents used)
Quantitative data: Data collected systematically and presented in numerical form (e.g. number of aggressive acts in the playground)
Primary data: Data collected directly by the researcher to test a hypothesis (e.g. collecting data from an experiment you are running), collected directly from a source (e.g. participant)
Secondary data: Data that has been collected by someone other than the original person (e.g. reading about an experiment that someone else conducted)
State the advantages and disadvantages for the different types of data
Qualitative data: Adv.- participants can elaborate and give meaning to their responses, Lim. - can be open to interpretation and bias
Quantitative data: Adv.- Quick and easy to analyse, tends to be less subject to bias, Lim.- lack of detail because participants can’t elaborate on their responses
Primary data: Adv.- Can ensure that the data is collected in a controlled, objective manner, Lim.- may be limited in terms of replication and ability to generalised to the wider population
Secondary data: Adv.- can compare the data from a number of different experiments, Lim.- Cannot ensure the validity and reliability of the results
What are descriptive statistics
Used to summarise and organise data so that it can be interpreted, includes measures of central tendency, measures of variability, graphs, tables, etc.
Define measures of central tendency as a descriptive tendency
Mean: Add all scores and divide result by total number of scores
Median: Arrange scores from highest to lowest and select the middle score
Mode: The most frequently occurring score
Define measures of variance as a descriptive statistic
Range: Difference between the highest and lowest scores in a distribution
Standard deviation: The spread of scores around the mean- should be noted that data sets may have the same mean, but degree of variation could be different.
-The higher the standard deviation (“wider” graph), the greater the range of values.
Define graphs and tables as a descriptive statistic
Involves frequency distribution tables, bar graphs, histograms, pie charts:
IV (what you manipulate or compare) X axis, DV (What you measure, outcome) Y axis
Frequency table: Indicates how often a score or value occurs in a set of data
Bar graphs: Use a series of separate bars, which can be horizontal or vertical- one axis is used to show the types of categories and the other is used to show the frequency that each category occurs.
Histograms: Similar to a bar graph but in histograms bars are positioned in a way to that they touch each other as histograms involves continuous data
Pie charts: Shows the proportions of scores, values, or cases within a set of data. Differences between the categories in a set of data are represented by different sized segments.
Line graphs: Shows the relationship between two variables in an experiment, IV on x axis, DV plotted on vertical axis.
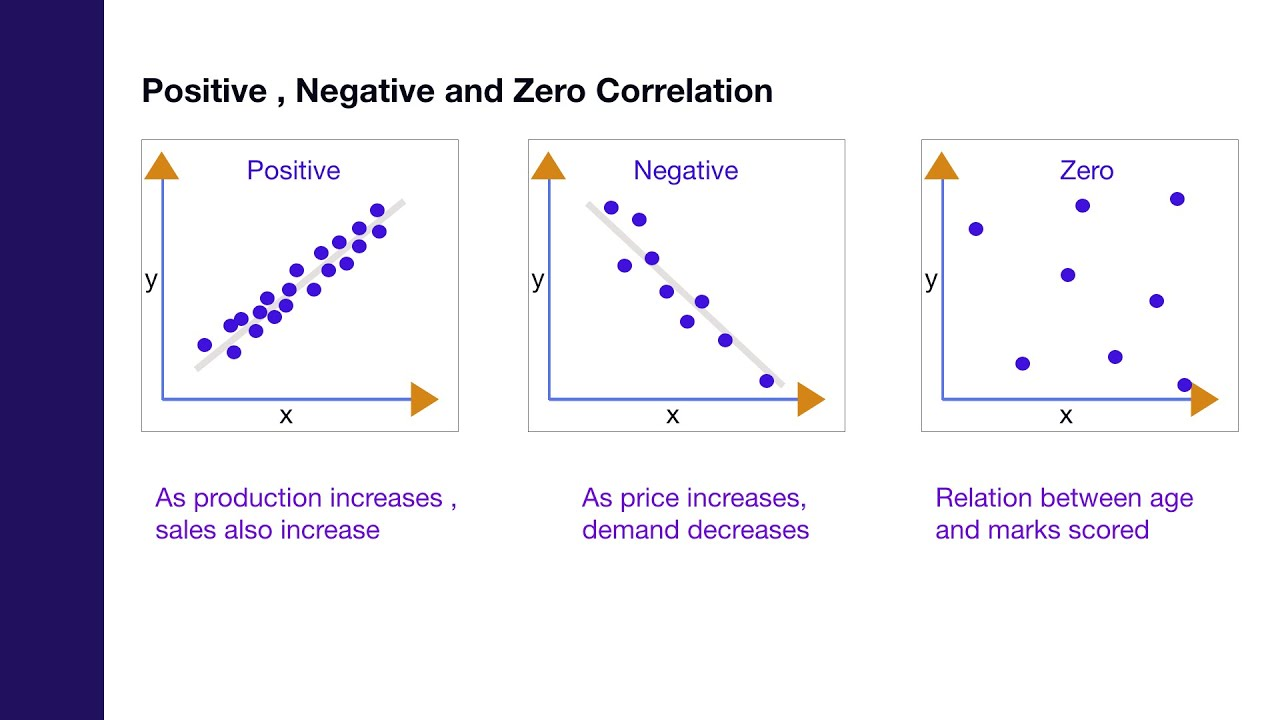
Define different directions of correlation, example, and graphs
LIKE A LINEAR GRAPH
Positive correlation: Two variables change in the same direction (e.g. as job satisfaction increases, word productivity tends to increase)
Zero correlation: There is no relationship between two variables (e.g. there is no relationship between the amount of coffee drunk and VCE grades)
Negative correlation: Two variables change in opposite directions (e.g. as the amount of alcohol increases, reaction time tends to decrease).
Describe reproducibility
The ability to obtain consistent results in an experiment when conducted again under changed conditions of measurement
-Results between changed conditions and original conditions should be compared to verify reproducibility
-Different conditions include different: Method of measurement, observer, measuring instrument, location, conditions of use
-Scientific findings can be considered in terms of whether they are replicable or irreplicable, where irreplicable results lack credibility.
Define truevalue
The value/range of values that would be found if the quantity could be measured perfectly.
Define uncertainty as analysis of quality of data
-The uncertainty of the result of a measurement reflects the lack of exact knowledge of the value being measured
-As human behaviour and mental processes cannot be directly measured (psychological construct), it increases the degree of uncertainty
Define outliers as an analysis of the quality of data
-Readings that lie a long way from other results
-A skewed distribution of data points may be a cause of outliers- in this case, you may choose to remove the outlier to have a more accurate representation of the data set
Sample size as an analysis of quality of data
-Increase in sample size can reduce extraneous variables (e.g. individual differences)
-Large sample size- increases reproducibility of data as they allow for a greater variation in participants, making the sample size more representative of the population of interest
-Small sample size- leads to a biased sample which can affect the results and may not represent the population of research interest
Define contradictory or incomplete data within an analysis of the quality of data
-Incomplete sets cannot be used in overall analysis, which can reduce the sample size of the experiment, which can result in greater chance of systematic errors
-Contradictory data can lead to an inconclusive hypothesis as there is data to support accepting and rejecting the hypothesis. Hence, .this is why it is important to repeat the experiment to ensure the results are valid.
Define conclusion
-Overall evaluation and interpretation of the results in relation to aim, research hypothesis, and sample, must be based on results generated from the sample tested.
Needs to:
-Write the conclusion statement by linking to the aim
-Restate the hypothesis
-Explain whether the hypothesis is supported or rejected by using the main results
Example: In conclusion, alcoholic drinks can negatively affect driving ability. It was hypothesised that Melbourne University students that consume two alcoholic drinks in one hour would have poorer driving ability than students who consumed two non-alcoholic drinks. The hypothesis was supported, in that the results suggest that participants who consumed alcohol made more errors on the driving simulator than participants who did not consume alcohol.
What factors should be considered when accepting or rejecting a hypothesis
-The results (ie. descriptive statistics)
-The experimental procedures (i.e. suitable data collection methods and experimental design)
-The presence of confounding variables
-The “accuracy” and “precision” are important in your analysis and evaluation of research and ultimately the conclusion that you draw.