Unit 0 Vocab
 Note
 Multiple Choice & FRQ
 Call Kai
1/54

Earn XP
Description and Tags
55 Terms
Psychology
The field devoted to understanding how the brain creates thought, feeling, motives, consciousness, memories, and other mental processes.
Case Study
Research method that involves an in-depth and detailed examination of a particular individual, group, event, or phenomenon.
Confounding Variable
Outside factors that influence an accurate measurement.
Control Group
The group that does not receive the treatment; used as a benchmark.
Correlation
Research method used to examine the relationship between two variables.
Correlation Coefficient
A number that represents the strength and direction of the correlation between 2 variables (-1:Negative Correlation) (+1:Positive Correlation) (0:No correlation).
Critical Thinking
Thinking that does not blindly accept arguments and conclusions.
Debriefing
When an experimenter tells the subject more information once the study is completed about the purpose and procedures.
Dependent Variable
Variable that is observed, measured, or recorded to assess the effect of the independent variable.
Descriptive Statistics
Used to organize or summarize a set of data, including measures of central tendency and measures of dispersion.
Double-Blind Procedure
When both the person holding the study and the participants do not know if they are receiving treatment.
Effect Size
Magnitude of the expected difference between two groups in a study.
Empiricism
The idea that all knowledge comes from experience.
Experiment
Procedures used to test research hypotheses, including experimental and control groups.
Experimental Group
Group receiving the treatment.
Experimenter Bias
When the experimenter affects the results of their own study because of their expectations.
Falsifiability
Principle that states that a research hypothesis must have the ability to be false.
Hindsight Bias
The tendency to see past events as more predictable than they really were.
Histogram
Graph that organizes a group of data points in specified ranges.
Hypothesis
A testable explanation usually constructed in the relationship of 2+ variables.
Illusory Correlation
Two variables that seem like they may correlate but do not.
Independent Variable
Variable that the researcher deliberately manipulates to observe its effect on another variable.
Inferential Statistics
Data from the sample that allows conclusions about the population.
Informed Consent
The subject is given enough information on the study to make an informed decision about their participation.
Mean
The average, calculated by adding all numbers and dividing by the amount of values.
Median
The middle number in a sorted list of values.
Meta Analysis
Statistical integration of results from independent studies for more reliable conclusions.
Mode
The number that occurs most often in a data set.
Naturalistic Observation
Research method used to study behavior in its natural environment without intervention.
Normal Curve
Represents data that clusters around a mean, symmetrical with equal scores above and below the mean.
Operational Definitions
Description of the procedure of a study for replication.
Peer Reviews
Reviewing the study before publication to provide critiques.
Percentile Rank
Percentage of people in a norm group who scored lower than a specific score.
Placebo
A fake substance used in experiments.
Placebo Effect
When participants feel effects from a placebo as if it were a real treatment.
Population
All cases in a group being studied.
Qualitative Research
Method of studying experiences by gathering nonnumerical data.
Quantitative Research
Method of studying subjects by collecting and analyzing numerical data.
Random Assignment
Method ensuring each participant has an equal chance of being assigned to any experimental condition.
Random Sample
Randomly selecting participants to represent a population.
Range
The difference between the highest and lowest numbers in a data set.
Regression Toward The Mean
Outliers tend to be followed by values closer to the mean.
Replicate
Following the operational definition to recreate the experiment.
Sampling Bias
When participants are collected in a biased manner to achieve desired results.
Scatter Plot
Graph that visually represents the relationship between two variables.
Self Report Bias
When individuals inaccurately evaluate themselves in self-reports.
Single Blind Procedure
When subjects do not know all information about the study, especially group assignment.
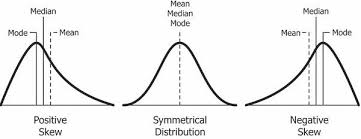
Skewed Distribution
Distribution where most scores fall to one side.
Social Desirability Bias
When participants answer according to societal expectations rather than their beliefs.
Standard Deviation
Measure of dispersion in a data set relative to the mean.
Statistical Significance
Whether an observed relationship is likely due to chance.
Survey
A list of questions filled out by a group to assess attitudes or opinions.
Theory
Organized sets of principles designed to explain
Validity
Whether or not the test actually assesses what it claims
Variable
Any factor or condition that can change or vary, and that is measured, manipulated, or controlled by the researcher