1.2- Price determination in a competitive market
1/66
There's no tags or description
Looks like no tags are added yet.
Name | Mastery | Learn | Test | Matching | Spaced |
|---|
No study sessions yet.
67 Terms
what is demand
the quantity of a good or service that consumers are able and willing to buy at a given price during a given period of time
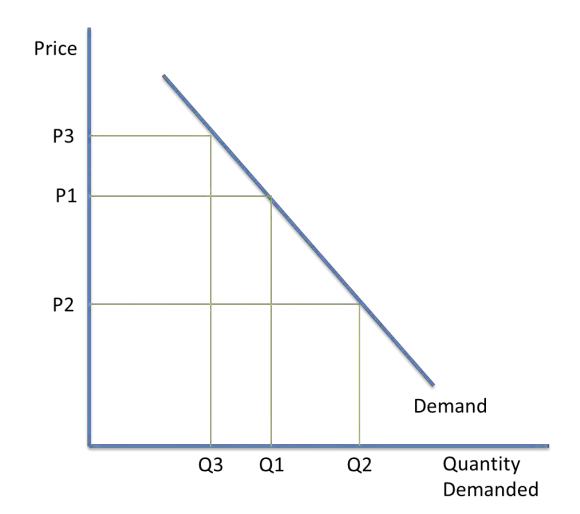
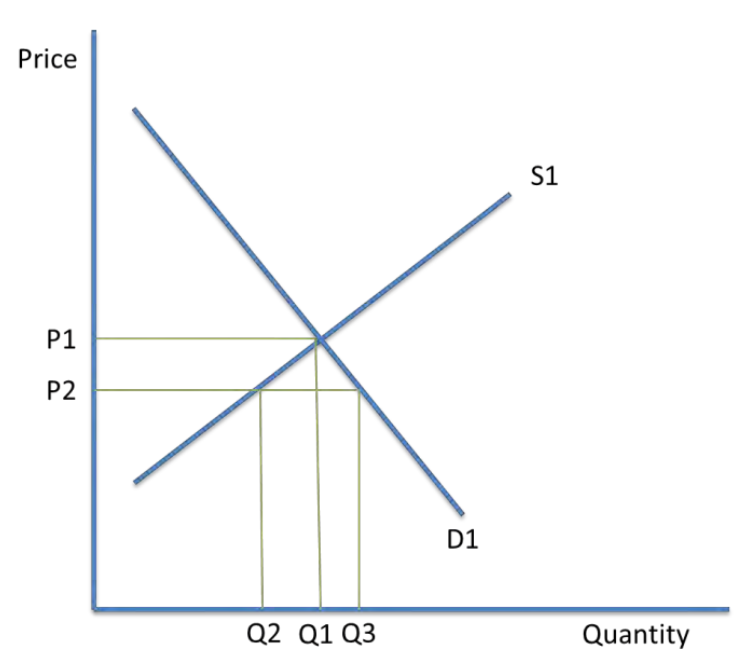
describe movements along the demand curve (explain)
at price p1, a quantity of q1 is demanded. At a lower price of p2, a larger quantity of q2 is demanded. this is an expansion of the demand.
at a higher price of p3, a lower quantity of q3 is demanded. this is a contraction of demand
only changes in price cause movements along the demand curve
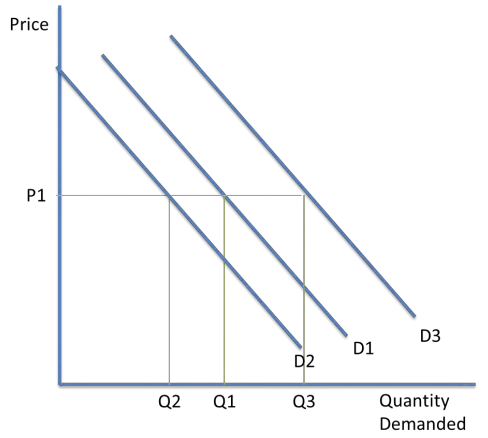
shifting the demand curve (explain)
price changes do not shift the demand curve
a shift from d1 to d2 is an inward shift in demand, so a lower quantity of goods is demanded at the market price of p1
a shift from d1 to d3 is an outward shift in demand where more goods are demanded at the market price of p1
what are the factors that shift the demand curve
P- population (higher pop. = more demand)
I- income
R- related goods (substitutes/complements)
A- advertising
T- tastes/ fashions
E- expectations
S- seasons
how does income shift the demand curve
consumers have more disposable income
able to afford more goods, so demand increases
wealth effect occurs, as consumers spend more they perceive their wealth to increase
how do expectations shift demand curve
if people expect the price of shares in a company to increase in the future, demand is likely to increase in the present
what is the law of diminishing marginal utility
states that as an extra unit of good is consumed, the marginal utility (benefit derived from consuming the good) falls. therefore, consumers are willing to pay less for the good
why is the demand curve downward sloping
the number of units demanded increase with a fall in price
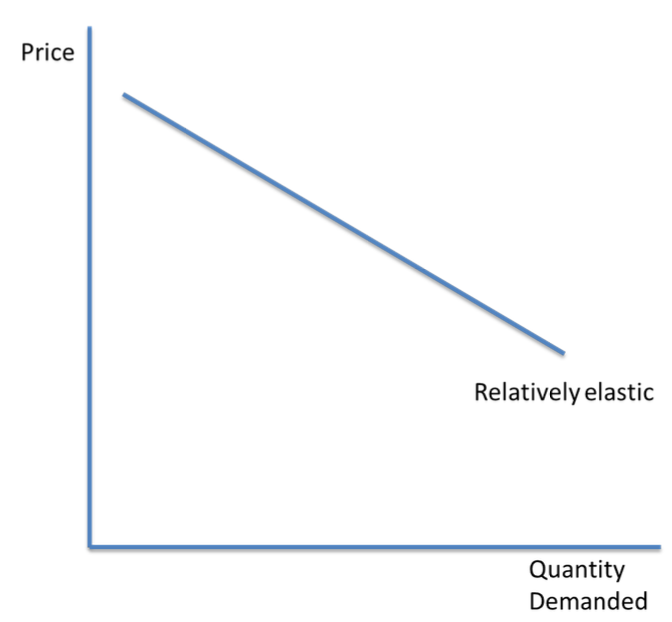
explain what price elastic mean
a price elastic good is very responsive to a change in price
change in price leads to an even bigger change in demand
PED is >1
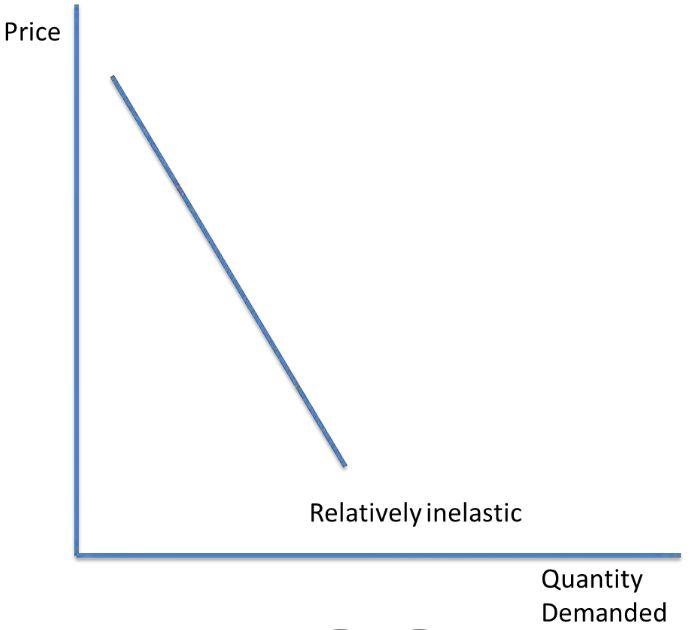
explain what price inelastic mean
a price inelastic good has a demand that is relatively unresponsive to a change in price
PED is <1
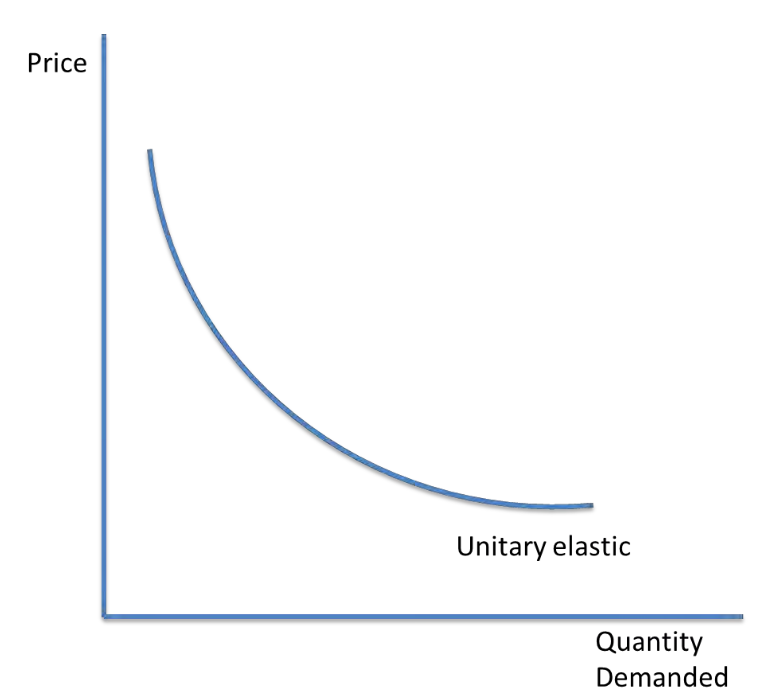
explain unitary elasticity
a unitary elastic good has a change in demand which is equal to the change in price
PED = 1
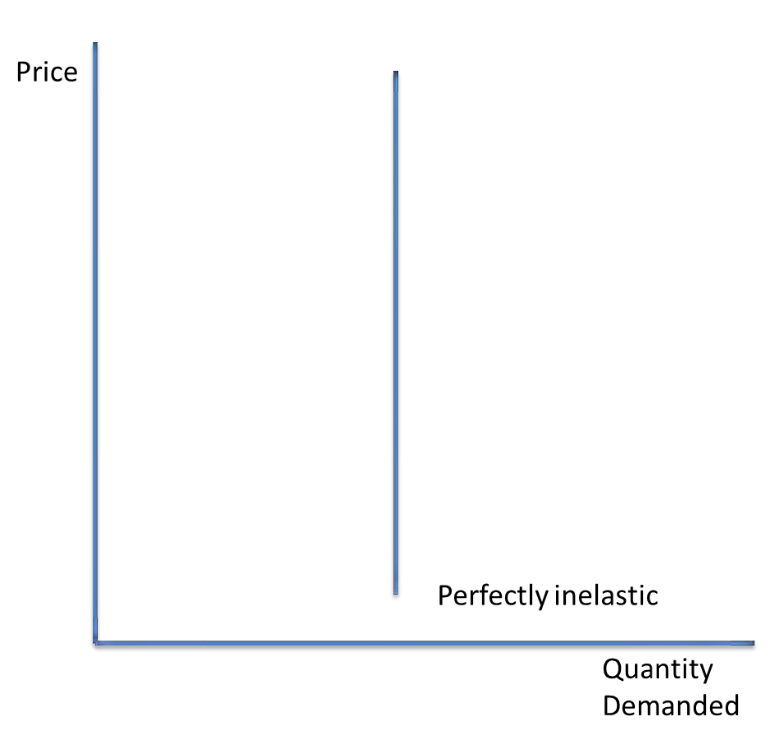
explain perfect inelastic goods
has a demand which does not change when price changes
PED = 0
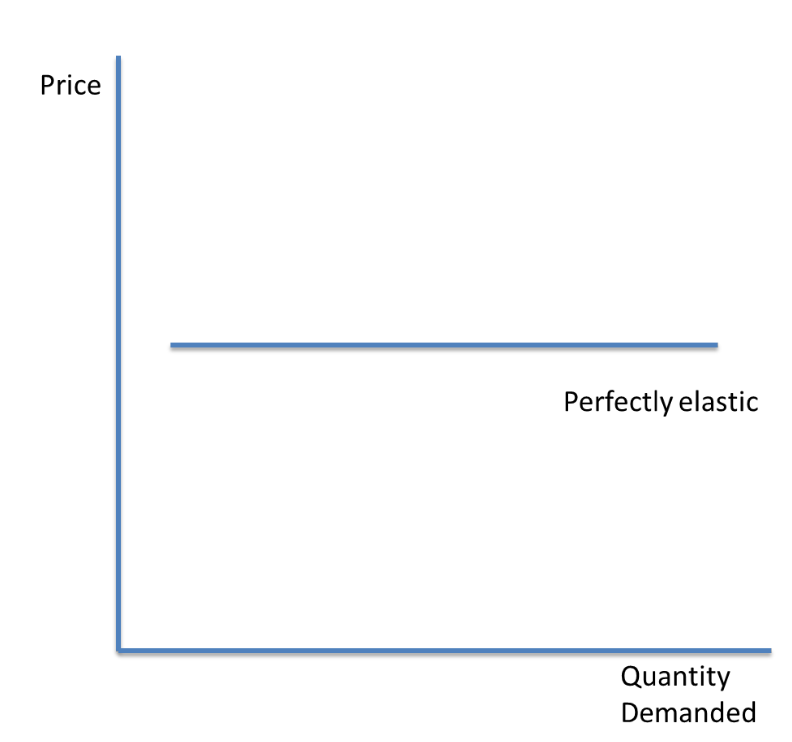
explain perfectly elastic goods
has a demand which falls to zero when price changes
PED = infinity
what are the factors influencing PED
necessity, substitutes, addictiveness, proportion of income spent, durability, peak and off-peak demand
how does necessity influence PED
a necessary good will have a relatively inelastic demand
Even if the price increases significantly, consumers will still demand. it because they need it
Luxury goods are more price elastic, if price rapidly increases, the demand will fall significantly
how does substitutes influence PED
if the good has several substitutes, the demand is more price elastic
The elasticity can change within markets
e.g. market for bread is less elastic than the market for white bread. This is because there are fewer substitutes for bread in general but several for white bread
how does elasticity change in the short run and long run
in the long run, consumers have time to respond and find a substitute, so demand becomes more price elastic
In the short run, consumers do not have time, so demand is more inelastic
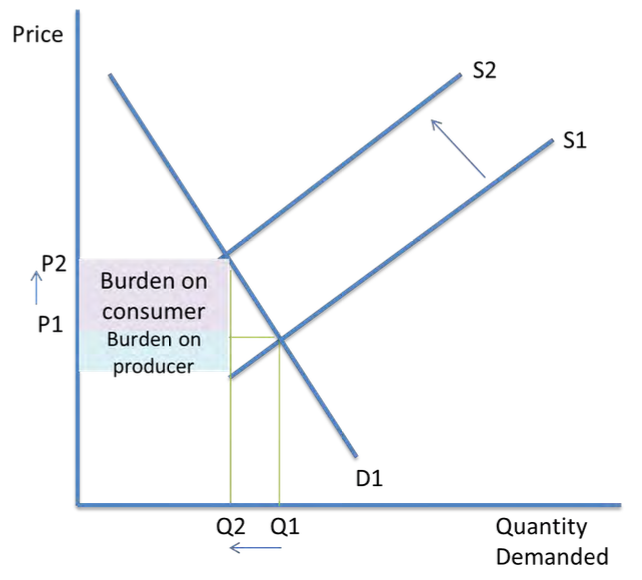
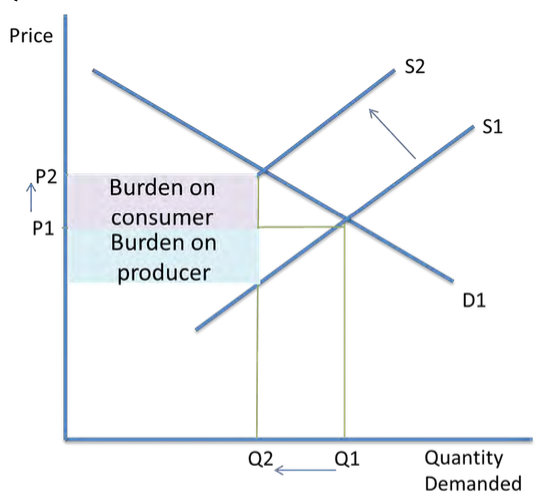
burden of indirect tax on consumers/ firms(explain)
if a firm sells a good with inelastic demand, tax burden mostly on consumers because they know a price increase will not cause demand to fall significantly
if a firm sells a good with an elastic demand, firms take most of the tax burden because they know if the price of a good increases, demand will likely fall, lowering overall revenue
what maximises government revenue
a good with inelastic demand
analysis of elasticity of demand and tax revenue diagram (price inelastic)
an increase in tax will decrease supply from s1 to s2, which increases price from p1 to p2
demand contracts from q1 to q2
effective in raising gov. revenue
analysis of elasticity of demand and tax revenue diagram (price elastic)
not effective in raising gov. revenue, but reduces demand of a particular good
an increase in tax will decrease supply from s1 to s2, which increases price from p1 to p2
demand contracts from q1 to q2
what is a subsidy
a payment from the government to firms tp encourage the production of a good to lower their average costs
advantages of subsidies
benefit can go to both the producer in the form of increased revenue or to the consumer in the form of lower prices
calculation of total revenue
average price x quantity
how does elastic demand affect total revenue
if a good has elastic demand and the firm raises it price, quantity sold will fall, reducing overall revenue
what is income elasticity of demand
income elasticity of demand is the responsiveness of a change in demand to a change in income
how to calculate income elasticity of demand
YED = % change in QD/ % change in income
what is an inferior good
goods which see a fall in demand as income increases. A income increases, consumers switch to branded goods
YED <0
YED of normal goods
YED is >0
how does income elasticity affect luxury goods
an increase in income causes an even bigger increase in demand
YED > 1
Luxury goods are also normal goods, and they have an elastic income
how do firms react to real incomes rising
firms might switch to producing more luxury goods and fewer inferior goods
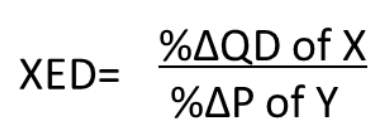
what is cross elasticity of demand
the responsiveness of a change in demand of one good to a change in price of another good
formula for cross elasticity of demand
XED and complementary goods (explain)
complementary goods have a negative XED
If one good becomes more expensive, the quantity demanded for both goods will fall
Close complements- a small fall in price x leads to a large increase in QD of Y
weak complements- a large fall in the price of good x leads to only a small increase in QD of Y
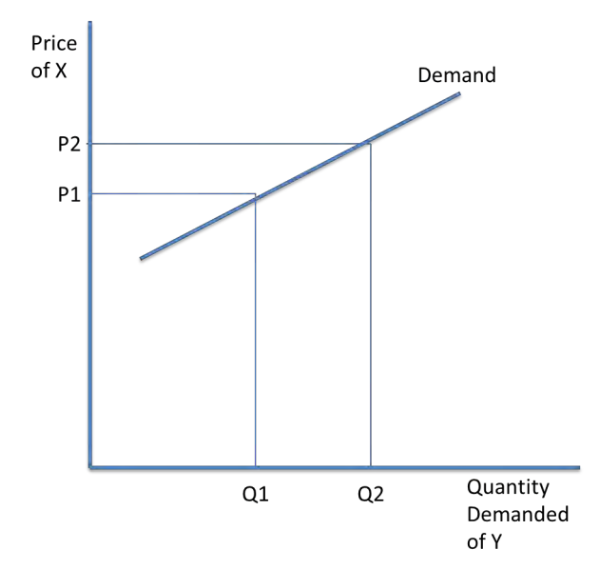
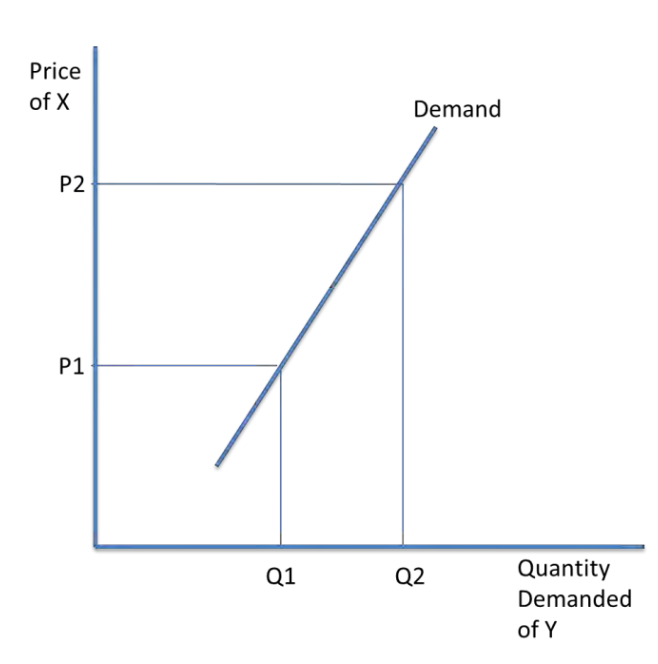
relationship between XED and substitutes
substitutes can replace another good, so the XED is positive and demand curve is upward sloping
close substitutes- a small increase in price of good X leads to a large increase in QD of Y
weak substitutes- a large increase in the price of good c ;eads to a smaller increase in QD of Y
relationship between unrelated goods and XED
has a XED of 0
why are firms interested in XED
allows them to see how many competitors they have. therefore, they are less likely to be affected by price changes by other firms, if they are selling complementary goods or substitutes
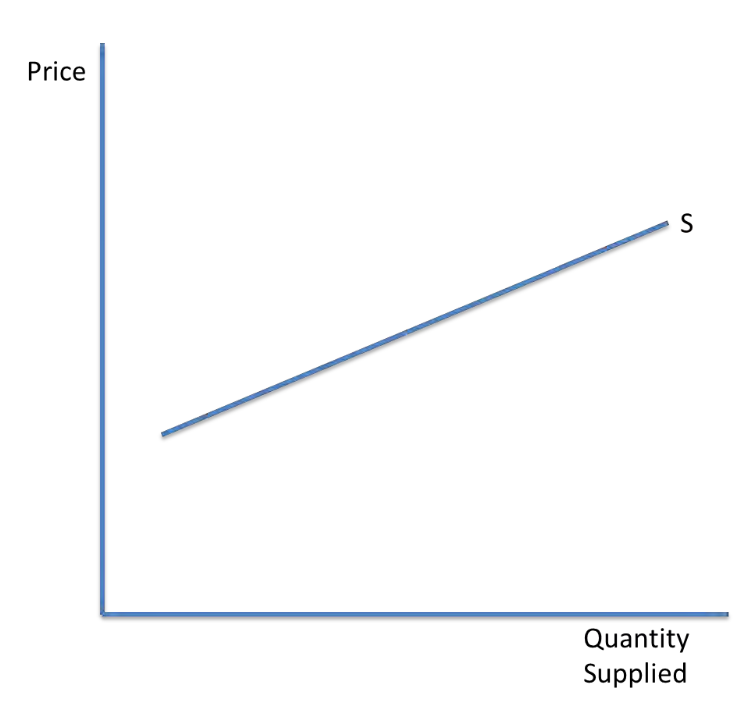
define supply
the quantity of a good or service that a producer is willing and able to supply at a given price during a given period of time
why are supply curves upward sloping
if price increases, more profitable for firms to supply the good so supply increases
High prices encourage new firms to enter the market, because it seems profitable so supply increases
with larger outputs, firm’s costs increase, so they need to charge a higher price to cover the costs
movements along the supply curve analysis
price p1, quantity of q1 is supplied
at the lower price of p2, q2 is supplied (contraction)
if prices increase from q2 to q1
price mechanism of rising demand (explain)
Price rises
Signals excess demand and need for greater resources
Incentivises firms to increases their output to increase profit
Ration resources discouraging consumption
Allocate resources efficiently at equilibrium
price mechanism of rising supply (explain)
Prices fall
Signals excess supply and need for fewer resources
Incentivises firms to decrease their output to increase profit
Ration resources encouraging consumption
Allocate resources efficiently at equilibrium
factors that shift the supply curve
Productivity
Indirect taxes
Number of firms
Technology
Subsidies
Weather
Costs of production
how does productivity affect supply
Higher productivity causes an outward shift in supply, becuase average costs for the firm fall
how do indirect taxes affect supply
inward shift in supply
how does technology affect supply
more advanced technology causes an outward shift in supply
how do costs of production affect supply
if costs of production fall, the firm can afford to supply more
If costs rise such as with higher wages, there will be an inward shift in supply
shifting along the supply curve analysis
price changes do not shift the supply curve
shift from 21 to s2 is an outward shift, larger quantities of goods are supplied at the market price of p1
a shift from s3 to s1 is an inward shift in supply -more goods are supplied at the market price of p1
define price elasticity of supply
the responsiveness of a change in supply to a change in price
formula for PES
PES = % change in quantity supplied / % change in price
elastic supply
firms increase supply quickly at little cost
PES >1
inelastic supply
expensive for firms to take a long time
PES <1
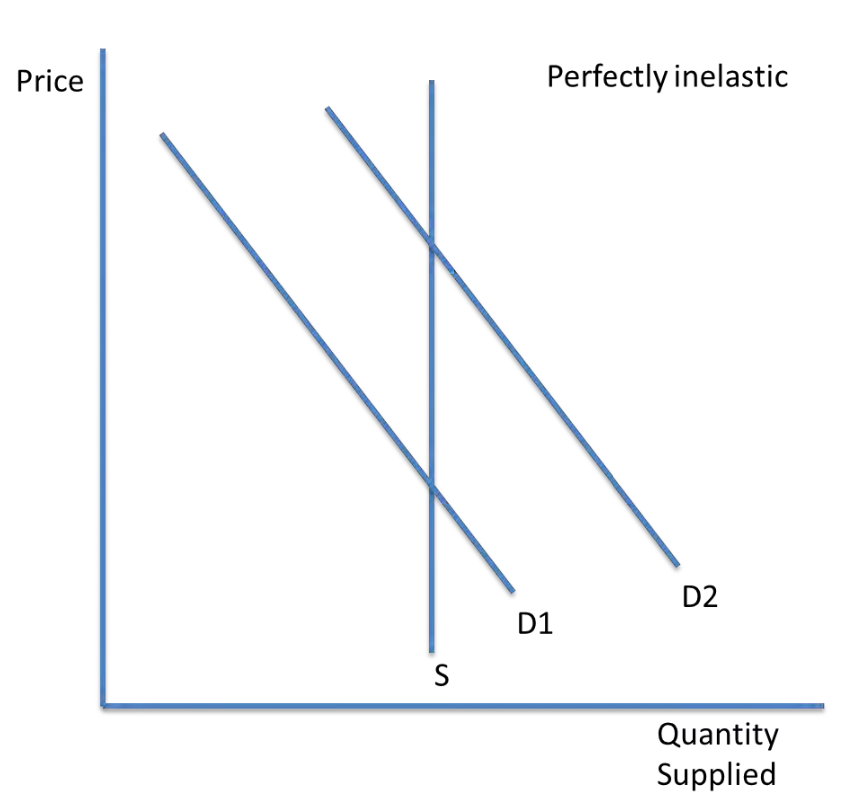
perfectly inelastic
PES = 0
Supply is fixed, so there is a change in demand, it cannot be met easily
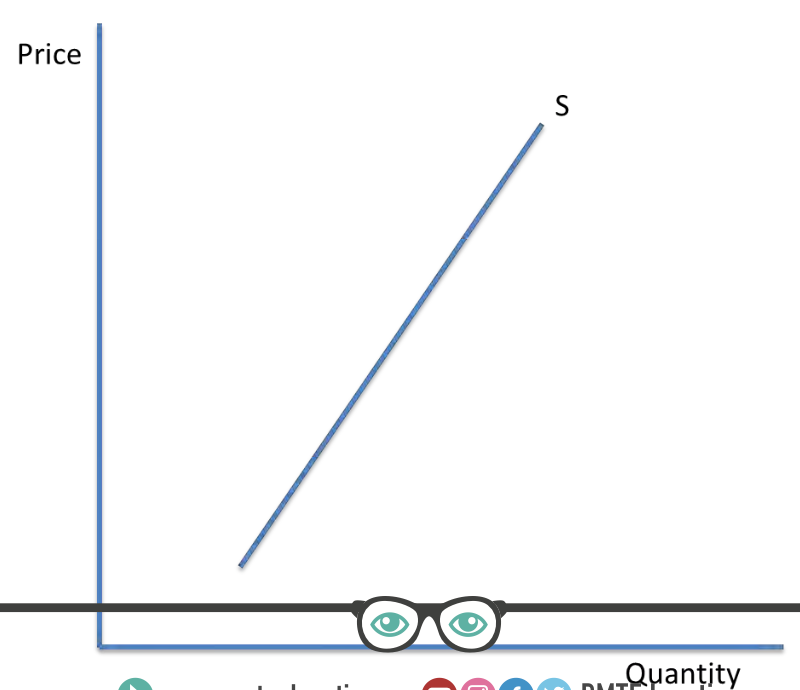
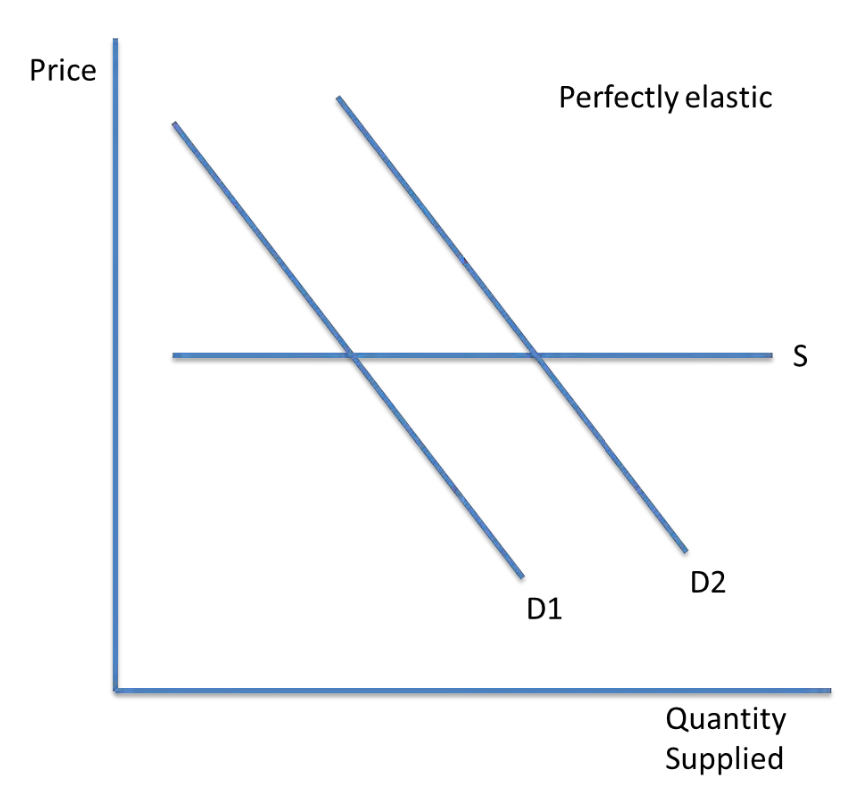
perfectly elastic
PES = Infinity
any quantity demanded can be met without changing price
factors influencing PES
time scale
spare capacity
level of stocks
substitute factors
barriers to entry to market
how does substitute factors affect PES
if labour and capital are more mobile, supply is more price elastic because resources can be allocated to where extra supply is needed
how do barriers affect PES
High barriers to entry means supply is more price inelastic, because it is difficult for new firms to enter and supply the market
where is the equilibrium on a diagram
when supply meets demand
excess demand diagram analysis
at q2, price is at p2 which is below market equilibriumDemand is now greater than supply, which can be calculated by q3-q2. This is a state of disequilibrium
demand price does not equal supply price and quantity demaded does not equal quantity supplied
what is the result of excess demand on markets
there is a shortage in the market
prices increase, so firms supply more
As prices increase, demand will contract
excess demand diagram analysis
supply is now at q2 and demand is at q1
there is a surplus of q2-q1
prices will fall back to p1 as firms lower their prices and try to sell their goods
the market will clear and return to equilibrium
when are new market equilbriums made
when the demand or supply curves shift due to PIRATES or PINTSWC reasons
what are the different types of demand
derived, composite, joint
what is derived demand
this is when demand for one good is linked to the demand of a related good
e.g demand for bricks is derived from demand of building new houses
what is composite demand
when a good demanded has more than one use
e.g milk
what is joint demand
when goods are bought together
e.g a digital camera and sd card
what does joint supply mean
increasing the supply of one good causes an increase or decrease in supply of another good