Required Practical 3 - Osmosis
1/27
Earn XP
Description and Tags
Name | Mastery | Learn | Test | Matching | Spaced |
|---|
No study sessions yet.
28 Terms
What is osmosis?
The net movement of water molecules from an area of higher water concentration to an area of lower water concentration down a concentration gradient through a partially permeable membrane. It is a passive process (it requires no energy)
Describe how you would carry out an investigation into osmosis using potato tissue
Cut identical potato cylinders using a cork borer
Measure and record the length and mass of cylinders using ruler and balance
Add each cylinder to one of three solutions: 1M sugar solution, 0.5M sugar solution and distilled water
Leave cylinders in tubes overnight
Remove cylinders from tubes and blot them using paper towels
Record length and mass of each cylinder
Draw graph of change in mass in grams (y axis) against concentration of solution in mol dm⁻³ (x axis)
Why is it necessary to use a cork borer to cut the cylinders?
Results in equal sized samples so changes in length and mass can be compared easily.
Why is it necessary to blot the cylinders with paper after removing them?
Each cylinder may have a different amount of water on its surface, so masses may vary. Blotting cylinders allows masses to be comparable.
What safety precautions should be taken with this experiment?
Handle cork borer and scalpel with care as they are sharp.

A student investigated the effect of concentration of salt solution on the mass of uncooked potato pieces.
The figure below shows the results.
Plan a method that could be used to obtain the results in the figure above.
Measure and record the mass of the potato cylinders
Place the potato cylinders into different concentrations of salt solution
Use at least 3 different concentrations of salt solution
Leave the potato cylinders in salt solutions
Remove the potato cylinders from the salt solutions
Blot the potato cylinders dry
Measure and record the mass of the potato cylinders and calculate the change in mass
Repeat for each concentration of salt solution
Repeat each salt solution concentration at least 2 more times
Calculate the mean change in mass
Control variables:
Use the same mass of potato cylinders
Use the same potato
Use same blotting technique for each potato cylinder
Ensure that there is no skin on the potato cylinders
Keep the potato cylinders in the solutions for the same amount of time (≥10 minutes)
Keep the potato cylinders in the solutions at the same temperature
A student investigated the effect of concentration of salt solution on the mass of uncooked potato pieces.
The figure below shows the results.
Explain the result for the potato pieces in the 0.6 mol/dm3 salt concentration.
The pieces lost mass because water left the cells in the potato because the solution in the potato is less concentrated than outside. The water left the potato by osmosis.

A student investigated the effect of concentration of salt solution on the mass of uncooked potato pieces.
The figure below shows the results.
Explain why the result for the potato pieces at 1.0 mol/dm3 was different from the result at 0.6 mol/dm3.
The pieces at 1.0 mol/dm3 lost more mass because more water left potato the because there is a steeper concentration gradient at 1.0 mol/dm3.

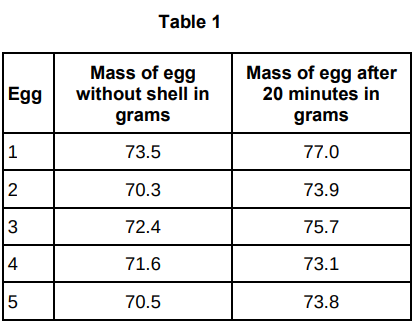
A student carried out an investigation using chicken eggs.
This is the method used:
Place 5 eggs in acid for 24 hours to dissolve the egg shell.
Measure and record the mass of each egg.
Place each egg into a separate beaker containing 200 cm3 of distilled water.
After 20 minutes, remove the eggs from the beakers and dry them gently with a paper towel.
Measure and record the mass of each egg.
Table 1 shows the results.
Another student suggested that the result for egg 4 was anomalous.
Do you agree with the student?
Give a reason for your answer.
Yes, because the mass change of egg 4 is much lower than the others.
A student carried out an investigation using chicken eggs.
This is the method used:
Place 5 eggs in acid for 24 hours to dissolve the egg shell.
Measure and record the mass of each egg.
Place each egg into a separate beaker containing 200 cm3 of distilled water.
After 20 minutes, remove the eggs from the beakers and dry them gently with a paper towel.
Measure and record the mass of each egg.
Table 1 shows the results.
Calculate the percentage change in mass of egg 3 to 1dp.
4.6%

A student carried out an investigation using chicken eggs.
This is the method used:
Place 5 eggs in acid for 24 hours to dissolve the egg shell.
Measure and record the mass of each egg.
Place each egg into a separate beaker containing 200 cm3 of distilled water.
After 20 minutes, remove the eggs from the beakers and dry them gently with a paper towel.
Measure and record the mass of each egg.
Table 1 shows the results.
Explain why the masses of the eggs increased.
The mass increased because water entered by osmosis, from a dilute solution in the beaker to a more concentrated solution in the egg through a partially permeable membrane.

A student carried out an investigation using chicken eggs.
This is the method used:
Place 5 eggs in acid for 24 hours to dissolve the egg shell.
Measure and record the mass of each egg.
Place each egg into a separate beaker containing 200 cm3 of distilled water.
After 20 minutes, remove the eggs from the beakers and dry them gently with a paper towel.
Measure and record the mass of each egg.
Table 1 shows the results.
Explain how the student could modify the investigation to determine the concentration of the solution inside each egg.
By using five or more different concentrations of sugar solution in beakers.
By plotting percentage change (in mass / volume) a graph
By determining the concentration where the curve crosses the zero percentage change (in mass / volume)

A student used cubes of potato to investigate the effect of surface area and volume on the rate of osmosis.
The diagram shows two of the cubes of potato the student used.
The surface area to volume ratio of cube 1 is 6:1.
Calculate the total surface area of cube 2.
24 cm2

A student used cubes of potato to investigate the effect of surface area and volume on the rate of osmosis.
The diagram shows two of the cubes of potato the student used.
The surface area to volume ratio of cube 1 is 6:1.
Calculate the volume of cube 2.
8 cm3
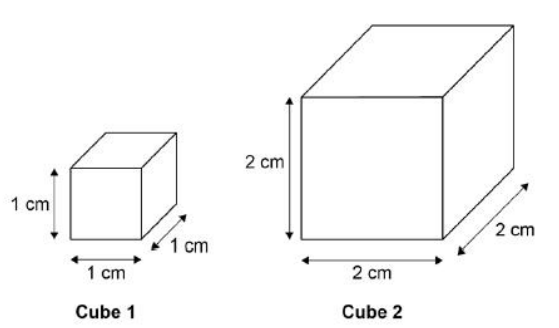
A student used cubes of potato to investigate the effect of surface area and volume on the rate of osmosis.
The diagram shows two of the cubes of potato the student used.
The surface area to volume ratio of cube 1 is 6:1.
Calculate the surface area to volume ratio of cube 2.
3:1

A student used cubes of potato to investigate the effect of surface area and volume on the rate of osmosis.
The diagram shows two of the cubes of potato the student used.
This is the method used:
Cut two cubes of potato of size 2 cm × 2 cm × 2 cm.
• Cut one of these cubes into 8 cubes of potato of size 1 cm × 1 cm × 1 cm (sample A).
• Do not cut the other cube (sample B).Measure the mass of each sample A and the mass of sample B.
Place all the cubes into a beaker of distilled water.
Leave for 30 minutes.
Remove the cubes from the beaker and dry the surfaces with a paper towel.
Measure the mass of each sample of cubes.
Why were 8 cubes of size 1 cm × 1 cm × 1 cm but only one cube of size 2 cm × 2 cm × 2 cm cube used?
To keep the volume of the cubes the same in both sets.

A student used cubes of potato to investigate the effect of surface area and volume on the rate of osmosis.
The diagram shows two of the cubes of potato the student used.
This is the method used:
Cut two cubes of potato of size 2 cm × 2 cm × 2 cm.
• Cut one of these cubes into 8 cubes of potato of size 1 cm × 1 cm × 1 cm (sample A).
• Do not cut the other cube (sample B).Measure the mass of each sample A and the mass of sample B.
Place all the cubes into a beaker of distilled water.
Leave for 30 minutes.
Remove the cubes from the beaker and dry the surfaces with a paper towel.
Measure the mass of each sample of cubes.
Why did the student dry the surface of each potato cube in step 5 of the method?
So that excess water does not contribute to the mass of the cubes.
A student used cubes of potato to investigate the effect of surface area and volume on the rate of osmosis.
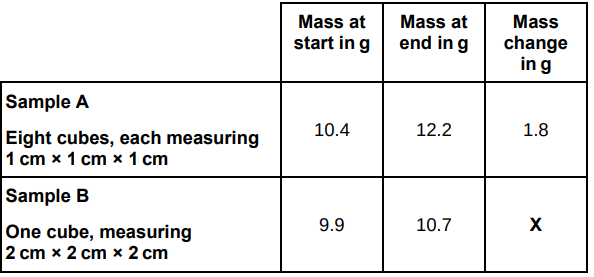
The table below shows the student’s results.
Calculate mass change X in the table above.
0.8

A student used cubes of potato to investigate the effect of surface area and volume on the rate of osmosis.
The table below shows the student’s results.
Explain why the masses of both samples of cubes increased.
Water moved in the potato cubes by osmosis because the solution outside the cubes was more dilute than inside the cells.

A student used cubes of potato to investigate the effect of surface area and volume on the rate of osmosis.
The table below shows the student’s results.
It would be better to calculate percentage change in mass rather than change in mass.
Why is this a more valid method?
Because the samples of cubes were different masses at the start of the investigation.

A student used cubes of potato to investigate the effect of surface area and volume on the rate of osmosis.
The table below shows the student’s results.
Explain why the mass of the cubes in sample A increased more than the mass of the cube in sample B.
More water was taken in, because they had a larger surface area to volume ratio.
A student investigated the effect of different sugar solutions on potato tissue.
This is the method used:
Add 30 cm3 of 0.8 mol dm-3 sugar solution to a boiling tube.
Repeat step 1 with equal volumes of 0.6, 0.4 and 0.2 mol dm-3 sugar solutions.
Use water to give a concentration of 0.0 mol dm-3.
Cut five cylinders of potato of equal size using a cork borer.
Weigh each potato cylinder and place one in each tube.
Remove the potato cylinders from the solutions after 24 hours.
Dry each potato cylinder with a paper towel.
Reweigh the potato cylinders.
The table below shows the results.
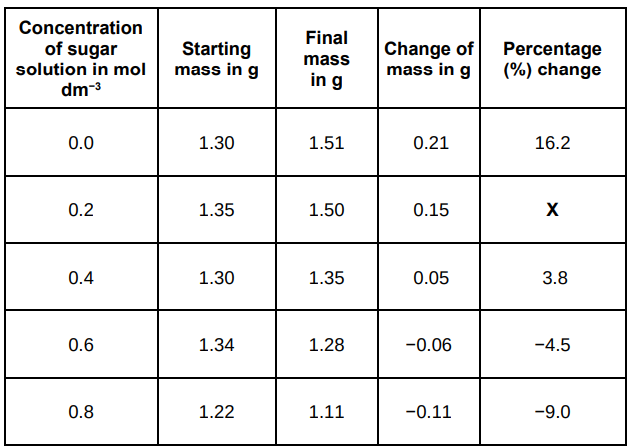
Calculate the value of X in the table above.
11.1%

A student investigated the effect of different sugar solutions on potato tissue.
This is the method used:
Add 30 cm3 of 0.8 mol dm-3 sugar solution to a boiling tube.
Repeat step 1 with equal volumes of 0.6, 0.4 and 0.2 mol dm-3 sugar solutions.
Use water to give a concentration of 0.0 mol dm-3.
Cut five cylinders of potato of equal size using a cork borer.
Weigh each potato cylinder and place one in each tube.
Remove the potato cylinders from the solutions after 24 hours.
Dry each potato cylinder with a paper towel.
Reweigh the potato cylinders.
The table below shows the results.
Why did the student calculate the percentage change in mass as well as the change in grams?
They had different masses at the start.

A student investigated the effect of different sugar solutions on potato tissue.
This is the method used:
Add 30 cm3 of 0.8 mol dm-3 sugar solution to a boiling tube.
Repeat step 1 with equal volumes of 0.6, 0.4 and 0.2 mol dm-3 sugar solutions.
Use water to give a concentration of 0.0 mol dm-3.
Cut five cylinders of potato of equal size using a cork borer.
Weigh each potato cylinder and place one in each tube.
Remove the potato cylinders from the solutions after 24 hours.
Dry each potato cylinder with a paper towel.
Reweigh the potato cylinders.
The table below shows the results.
The results in the table above show the percentage change in mass of the potato cylinders.
Explain why the percentage change results are positive and negative.
With concentrations 0.0 to 0.4 water moves into cells by osmosis which means a positive percentage change. With concentrations 0.6 to 0.8 water leaves cells by osmosis which means a negative percentage change.

A student investigated the effect of different sugar solutions on potato tissue.
This is the method used:
Add 30 cm3 of 0.8 mol dm-3 sugar solution to a boiling tube.
Repeat step 1 with equal volumes of 0.6, 0.4 and 0.2 mol dm-3 sugar solutions.
Use water to give a concentration of 0.0 mol dm-3.
Cut five cylinders of potato of equal size using a cork borer.
Weigh each potato cylinder and place one in each tube.
Remove the potato cylinders from the solutions after 24 hours.
Dry each potato cylinder with a paper towel.
Reweigh the potato cylinders.
The table below shows the results.
Suggest two possible sources of error in the method given above.
The concentration of solutions and the drying of potato cylinders.
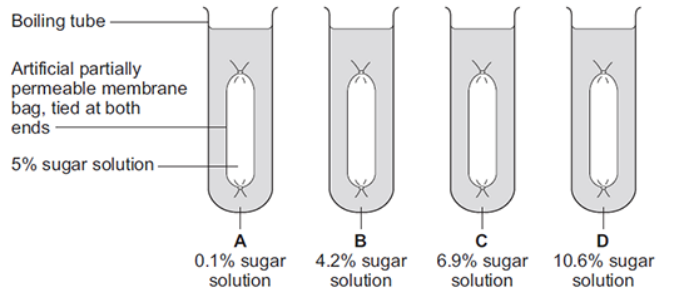
Some students investigated the effect of the different concentrations of sugar in four drinks, A, B, C and D, on the movement of water across a partially permeable membrane.
The students:
made four bags from artificial partially permeable membrane
put equal volumes of 5% sugar solution in each bag
weighed each bag containing the sugar solution
placed one bag in each of the drinks, A, B, C and D
after 20 minutes removed the bags containing the sugar solution and weighed them again.
The diagram below shows how they set up the investigation.
The bag in drink A got heavier after 20 minutes. Explain why.
There is a higher concentration of water outside the bag than inside the bag so water moved into the bag by osmosis.

Some students investigated the effect of the different concentrations of sugar in four drinks, A, B, C and D, on the movement of water across a partially permeable membrane.
The students:
made four bags from artificial partially permeable membrane
put equal volumes of 5% sugar solution in each bag
weighed each bag containing the sugar solution
placed one bag in each of the drinks, A, B, C and D
after 20 minutes removed the bags containing the sugar solution and weighed them again.
The diagram below shows how they set up the investigation.
In which drink, A, B, C or D, would you expect the bag to show the smallest change in mass?
B