QAM Intro to Statistics, Data Collection, Sourcing.
1/52
Earn XP
Description and Tags
LOCK IN 1
Name | Mastery | Learn | Test | Matching | Spaced | Call with Kai |
|---|
No analytics yet
Send a link to your students to track their progress
53 Terms
Statistics
collection & describing data
making interferences from samples
“Data Science”
Statistic
single measure
number used to summarize a sample data set
2 kinds of statistics
descriptive
inferential
descriptive statistics
collection, organization, presentation & summary of data (charts/ graphs)
inferential statistics
uses a sample of data to draw conclusions and make generalizations about a larger population (estimating)
why study statistics?
to develop critical thinking, interpret research, make data-driven decisions in your career and daily life, and understand complex world issues like climate change and public health
statistical challenges
imperfect data & practical constraints
business ethics (upholding them)
using consultants (expensive = paid by hour, decisions faster if org knowns own statistics)
communicating with numbers (managers barely have time to read each numbers meaning & context)
critical thinking 8 pitfalls
conclusion from small sample (not enough data)
conclusion from nonrandom samples (samples don’t represent population)
conclusion from rare events (ex: lottery eventually doesnt = win)
poor survey methods
assuming a casual link (video game have violence = video game cause mass shooting)
generalization to indiv (men taller than women)
unconscious bias
significance vs importance (must be: significance = result is real, importance = result matters in a meaningful way)
Data
collection of facts
diff between data & info
data = raw, unprocessed facts
information = data that has been processed
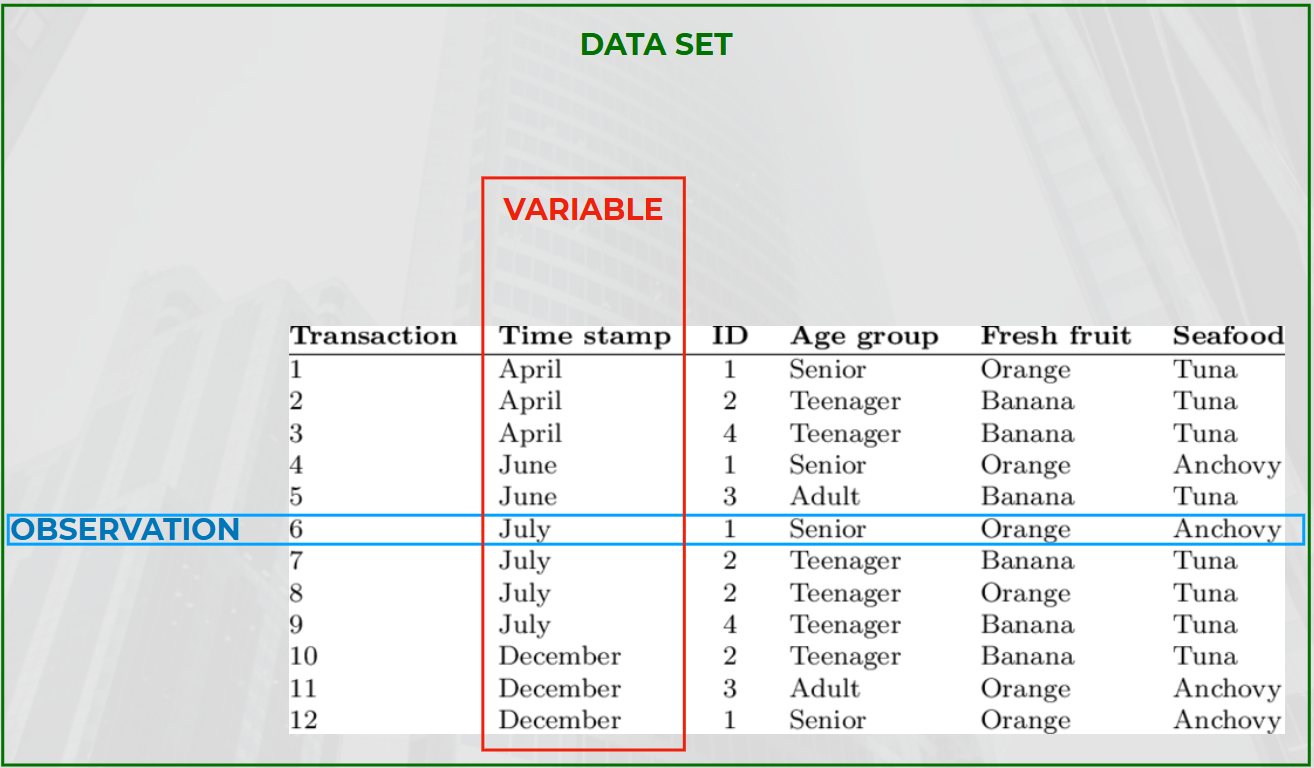
Data set
observation
complete record of a single unit
A single instance of the data being collected, essentially an individual case or entity. \
each row in data set
variables
characteristic of subj
each column in data set
uni, bi, multi variate
data set
all values we observe
m x n or observation x variable
Qualitative vs Quantitative data
Qualitative = descriptions, experiences, and meanings
Quantitative = can be counted, measured, or expressed numerically.
4 types of data?
categorical
numerical
time series
cross-sectional
categorical data
qualitative data
for labeling
nonnumerical values
coding - value of catgeorical variable represented using numbers
binary - coding only has 2 values - arbitrary = choice is random
numerical data
quantitative data
for measurement
discrete - variable w/ countable no of distinct values (integers, whole numbers) “Can I count it one by one?”
continuous - numerical value have any value with interval (any value within range, ex: 1.05) “Can I measure it more precisely?”
time-series data
different equally spaced point in time
came from same unit; diff period in time
(Usually the bar/ line graph)
cross-sectional data
numerical value can have any value within interval
came from diff unit at only 1 period in time
any value within a range
(scatter plot graph (circle thingy))
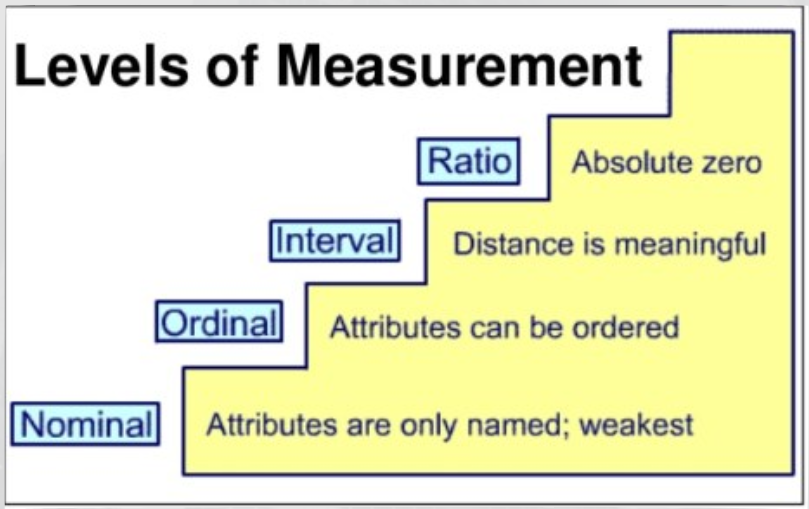
4 lvls of measurement
nominal
ordinal
interval
ratio
Nominal measurement
weakest
codes used as placeholders no numerical meaning only for categories
counting, mode
Ex: m=male , f=female
ordinal measurement
imply ranking of data value
used to rank or order data into categories where the differences between the categories are not necessarily equal.
Ex: educational attainment, income, etc
interval measurement
rank has meaningful interval between scale points
no meaningful zero
Ex: temperature, IQ score, SAT score, likert scale
Ratio Measurement
strongest lvl of measurement
meaningful zero = represents absence
data can have negative no
Ex: weight, Height, Age, Time, kelvin tempt scale
Precision
multiple attempts close to target
accuracy
hitting actual target
sampling concept: Population
all items we are interested in may be finite or infinite
sampling concept: sample
subset of population taken to analyze
selected members of the grp
sampling concept: census
examination of all items in defined population
every member of the grp
situation where sample is preferred?
infinite population
accuracy
timely results
destructive testing
cost
sensitive info
situation where census is preferred?
small population
large sample size
database exist
legal requirements
sampling concepts 1: Parameter
measure or characteristic of population
μ = population mean
π = population proportion
sampling concepts 2: Statistics
numerical value calculated from sample
x̄ = sample mean
p = sample proportion
sampling concepts 1: Target population
contains all indiv in which we are interested
ex: population of those living in metro manila
sampling concepts 2: sampling frame
grp from which we take the sample
ex: names of ppl living in metro manila
Random sampling method 1: simple random sample
every item in the population has same chance of being chosen
sampling w/o replacement = once chosen remove from sample
sampling with replacement = can be called again
Random sampling method 2: systematic sample
chosen every kth item from sequence starting randomly chosen entry among 1st k item
Random sampling method 3: stratified sample
within each stratum, simple random sample of desired size could be taken
Random sampling method 4: cluster sample
taken from strata geographical regions
useful if:
population frame & stratum characteristics not available rn
too expensive for stratified sample
some of loss of reliability is acceptable
None random sampling method: Judgment
relies on expertise of sampler to choose items to represent population
None random sampling method: convenience
sample thats available
None random sampling method: focus grp
panel of indiv chosen to represent wider population, form open-ended discussion & idea gathering
Data Sourcing: primary source
raw info = gathered from 1st source in controlled/ uncontrolled situations
Data Sourcing: secondary source
data acquired from optional sources = magazine, books, docs, etc.
inner source = exist in stored orgs
external source = gathered by other indiv from association’s other environment
Survey types: mail survey
need targeted list
expect low responses
Survey types: web
no bias
works best on targeted in well-defined interest grp on question of self-interest
6 survey guidelines
planning
design
quality
pilot test
buy-in
expertise
designing a questionnaire?
Open Ended Questions
Fill in the blank
Check boxes
Ranked choices
Pictograms
Likert scale
Short and concise instructions
Include an escape options (Others (pls specify))
Allow respondents to bypass sectors that are not relevant to them
designing a questionnaire what to look out for?
multiple responses
random replies for fill-in-the-blank
range ans
inconsistent replies