stats unit 1
1/22
Earn XP
Description and Tags
12th grade ap statistics
Name | Mastery | Learn | Test | Matching | Spaced | Call with Kai |
|---|
No study sessions yet.
23 Terms
quantitative variable
takes numerical values for a measured or counted quality
categorical variable
takes on values that are category names or group labels
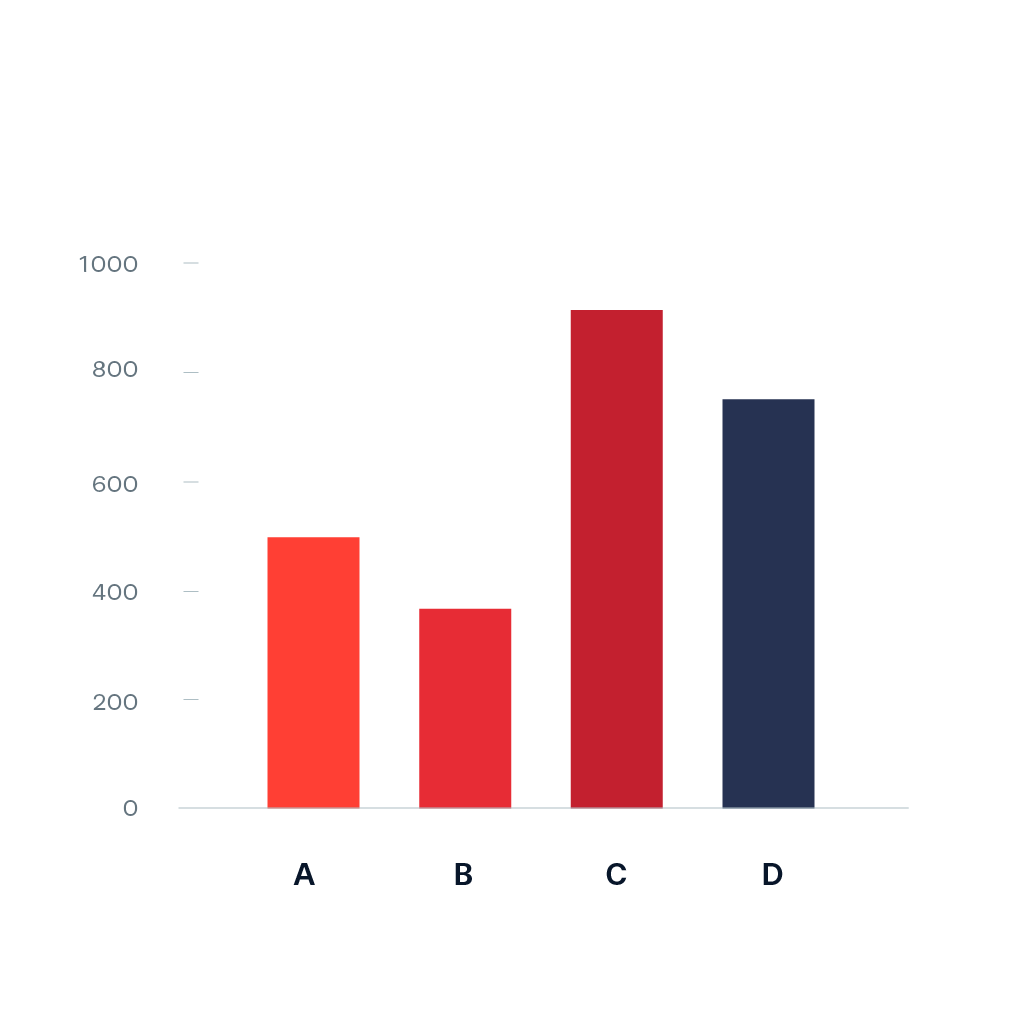
bar graphs
show frequency (how many) or relative frequency (percent)
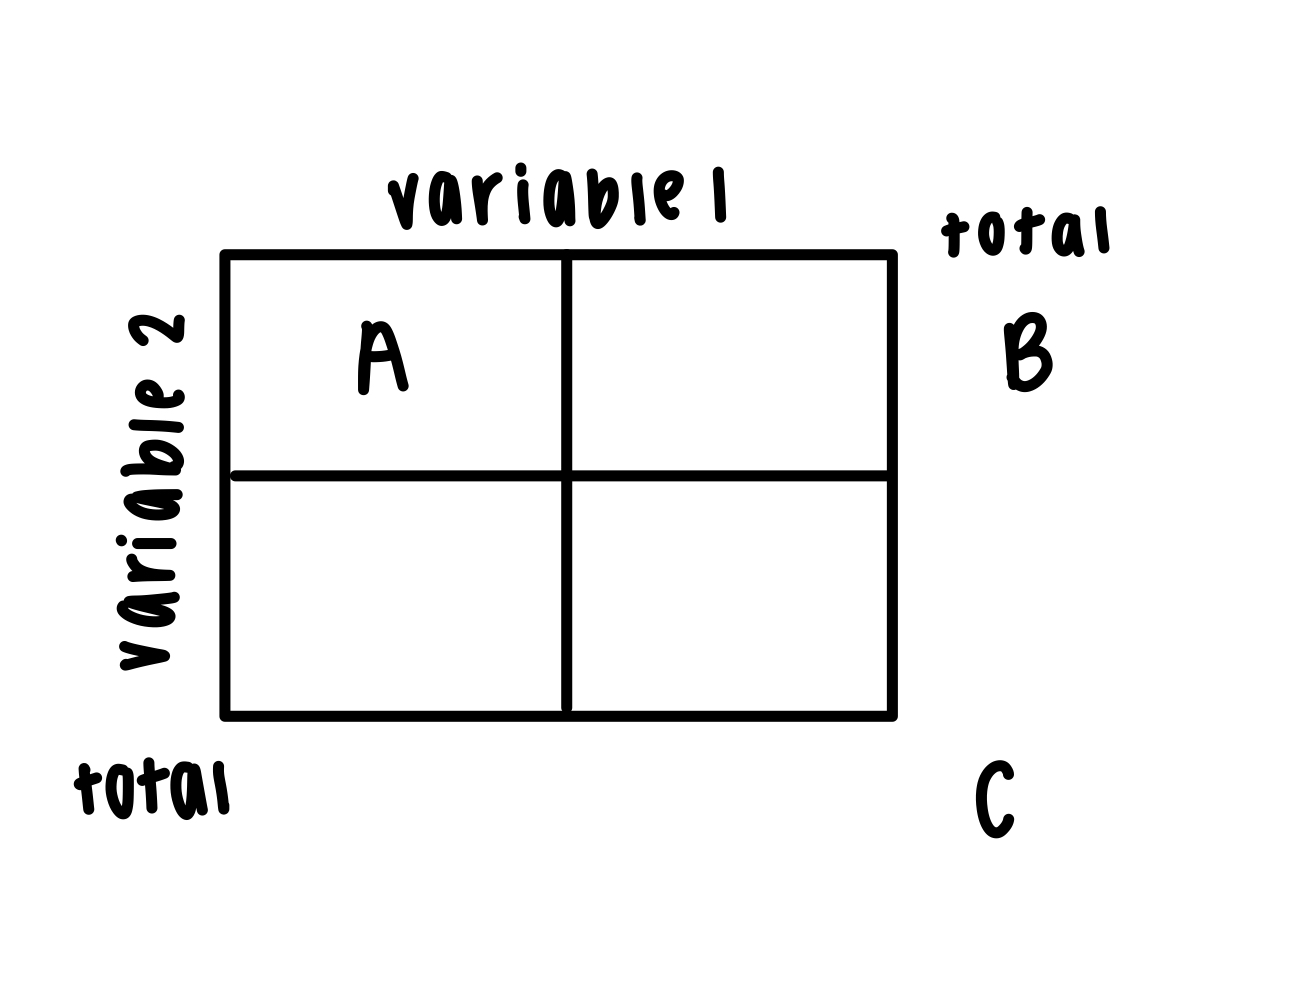
two-way table
marginal %: B/C
joint %: A/C
conditional %: A/B
misleading graphs
vertical axis must start at 0
beware of using images for bar graphs
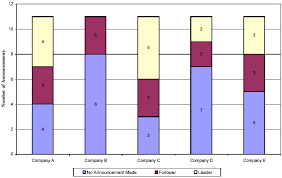
segmented bar graph
stack up bars to make 100%
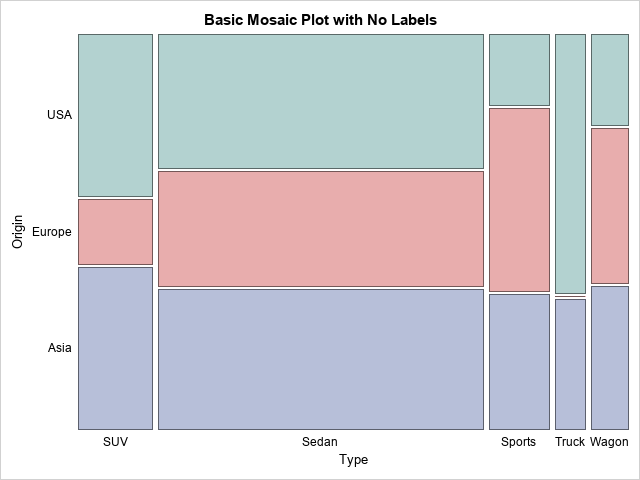
mosaic plot
segmented bar graph where the width of bars is proportional to the group size
association
if knowing the value of one variable helps us predict the other variable
quantitative data
types: discrete, continuous
dotplots and stemplots show every individual value
histogram shows general shape
discrete
countable number of values
continuous
infinite values
describing distribution
shape
outliers
center
variability
context
skewed to the left
tail on left side
skewed to the right
tail on right side
variance
(standard deviation)²
standard deviation
“the context typically varies by SD from the mean of x̅.”
outliers
greatly affects mean and standard deviation (nonresistant)
median is resistant to change
symmetric distributions
use mean, SD
skewed or outliers distributions
use median, IQR
1.5 x IQR method for outliers
low outlier < Q1 -1.5(IQR)
high outlier > Q3 + 1.5(IQR)
standard deviation method for outlilers
low outlier < mean - 2(SD)
high outlier > mean + 2(SD)
boxplots
5 number summary- minimum, Q1, median, Q3, maximum
comparing distributions
shape
outlier (1.5IQR method)
center (mean, median)
variability (range, IQR, SD)
+ context and comparative language