Research final
1/88
There's no tags or description
Looks like no tags are added yet.
Name | Mastery | Learn | Test | Matching | Spaced |
|---|
No study sessions yet.
89 Terms
hierarchy of evidence
Clinical studies in different patient populations
·Systematic Reviews & Meta-Analyses
Clinical studies in one patient population
Randomized Controlled Trials (RCT)
Trials without Randomization (Cohort studies; Case control studies; Repeated measures; Quasi-experimental designs)
Descriptive/Correlational Studies
Case Series
Case Reports
Theory/expert consensus
·Expert Opinion
Laboratory/animal studies
Animal Research ; In Vitro (test tube or bench) Research
•Unsupported practitioner belief
Case report (study): detailed description of ____
Describes:
detailed description of: the management of a patient that may serve as the basis for future research
describes: the overall management of an unusual case or a condition that is infrequently encountered
Case Series
description of the management of several patients or the same purposes as a
case report
• The use of multiple individuals increases the potential importance of the observations as the basis for future research.
(hypothesize)
case report/study/series
descriptive research (non experimental)
Purpose: describe the practice
Lacks compstissons
Limited generalizability
Enhancing case credibility
•Attempt to control, rule out or at least acknowledge alternative explanations for the outcomes explained
•Systematically collect reliable data
•Take several measurements over time
•Replicate
Case Report/Study/Series
Advantages:
Disadvantages:
A: easy to conduct/ only need 1 subject/ guiding development of hypothesis (BASE)
D: generalizability (who/ n=1/ unique characteristics/ external validity) retrospective study design, data already collected, no control group
Single Subject Design
A quasi experimental research design in which one subject receives in an alternating fashion both the experimental and control condition.
Quasi
randomization is missing
Single Subject Designs
• Quasi-experimental approach
• Investigates causal relationship between IV and DV
• Repeated measures of an observable behavior throughout at least one baseline phase and intervention phase
• Participants act as their own control
When to use Single Subject Designs?
• Withholding treatment is considered unethical → SSD
• When random assignment of subjects is not possible
• Not enough subjects for group design
Issues with Group Designs
• Difficult to structure powerful group design
– Large sample size
– Subjects with similar baseline values at the beginning of the study
– Large differences between groups at the
conclusion
• Unable to determine pattern of fluctuation in
DV
• Problems with external validity (too many controls)
Characteristics of Single Subject
Design
• Baseline Assessment
– 3+ baseline data points
• Stability of performance
– Steady trend in pre treatment behavior change
• Continuous Assessment
– Determine what are normally occurring
fluctuations in subject’s performance
• Use of different phases
– Baseline phase and intervention phase
A-B single subject design
Describe:
Limits:
• Closely approximates the sequence of clinical practice.
• Initial patient examination: A
• Intervention : B
• Difference: Extended baseline (3+)
Limits:
• Extraneous factors not controlled
Single subject Withdrawal Design
• A-B-A Design:
Limits:
Design:
–A: Baseline Phase
–B: Treatment Phase
–A: Another Baseline
Limits:
• Ethical implication of withdrawing a treatment
• Expected pattern of change in DV with each new phase will occur only if changes are reversible
Multiple Baseline Design
• Conduct several single subject studies, with baselines at different times/ different durations.
• Each subject serving as their own single system study
• Control for external events that may influence the outcomes of the study
• Each subject assigned to baseline control periods that vary in length and occur at different times, followed by intervention and subsequent widthdrawl periods.
Alternating Treatment
• Simultaneous treatment designs
• Different treatments, each administer independently of the other, within the same phase
Interaction Designs
• Used to evaluate the effect of
different combinations of treatments
• B-C-B-BC-B-BC
– Randomization
– Blinding
Visual Analysis Trend:
Trend refers to the direction of change within a phase. Trends can be described as accelerating or decelerating and may be characterized as stable
Visual Analysis: Level
• The level of data refers to the value of the DV , or magnitude of
performance, @ start/ end of a phase.
• Changes in level are assessed by comparing the value of the target behavior at the last data point of one phase with its value at the first data point of the next adjacent phase
Celeration line:
describes trends as accelerating or decelerating.
Split-middle line:
when it divides the data within a phase equally above and below the
line, with an equal number of data points on or above and on or below the line (a median
line).
C Statistic
• It is a time series analysis
• This statistic first looks at baseline data to establish that there is no trend and, if so, it combines baseline and intervention scores to determine if there is a difference between them
Is SSD suitable?
• Whether left-handed students acquire more
stats skills than right-handed students.
NO: not SSD
=INDEENDENT T TEST
One group before and after
paired t test
Is SSD suitable?
• Are patients with stroke more likely to recover functional mobility faster than patients with
spinal cord injury?
NO: 2 groups (SCI/SRTOKE)
Is SSD suitable?
• Does using a balance board improve a patient’s
static balance compared to no balance board
over a 6-week training period?
YES
C statistic
qualitative research characteristics
Evocative, true to life, and meaningful portraits, stories, and landscapes of human experience
Constructivist, naturalistic, interpretive
Real, richness
Context-bound
“thick” description
Concerned with Depth as opposed to breadth
Process
Meaning
Researcher is the primary instrument
Uses fieldwork
Descriptive/ / inductive
qualitative data collection
-OBSERVATION (as participant)
OBSERVATION (as observer)
-OPEN-ENDED INTERVIEWS
-JOURNAL KEEPING
SUBJECT’S DIARY
ANALYSIS OF DOCUMENTS, LETTERS, VIDEO TAPE, PHOTOGRAPHS, AUTOBIOGRAPHIES, BIOGRAPHIES
Qualitative Data
VALIDITY / PRIMARY CRITERIA (4)
credibility
authenticity
criticality
integrity
VALIDITY / SECONDARY CRITERIA (5)
vividness
creativity
thoroughness
congruence
sensitivity
Qualitative Data DEMONSTRATING VALIDITY
Design
Data generating
Analytic
presentation
Qualitative DESIGN CONSIDERATIONS
Self-conscious design (role of researcher)
Triangulation (multiple data sources")
Voice
Qualitative DATA GENERATING
Prolonged engagement
Persistent observation
Verbatim transcription
saturation
Qualitative ANALYTIC
Member checking
Expert checking
Literature review
Reflexive journaling
Negative cases
Qualitative Presentation
Audit trail
Providing evidence that supports
Thick descriptions
Researcher role
TYPES OF QUALITATIVE RESEARCH
Ethnography
Grounded Theory
Case studied/reports
Phenomenology
Qualitative ETHNOGRAPHY
Participant observer
Interact
Extended period of time
Qualitative CRITICAL ETHNOGRAPHY
Macro vs. micro
Political economy
emancipatory
Qualitative GROUNDED THEORY
Derive theory
Multiple stages of data collection
Constant comparison of data
Emerging categories
Qualitative CASE STUDIES/REPORTS
In depth analysis one case/subject
PHENOMENOLOGY
Understanding meaning of every day experience
“lived experience”
Which of the following is an inferential statistic
A) Mean
B) t test
B
A is descriptive stats
Which of the following is NOT a continuous variable?
A.weight
B.age
C.Types of stroke
D.ROM
C
Which of the following in NOT, the hallmark of experimental research is:
A.prospective data collection
B.description of natural phenomena
C.manipulation and control of variables
D.analysis of differences between groups
B
The following sampling method is most commonly used with qualitative research:
A.Purposive sampling
B.Stratified random sampling
C.Simple random sampling
D.Systematic sampling
A
There is a greater likelihood of finding statistical significance in a study if there is:
A. small between group difference
B. small sample size
C. large within group variability
D. small within group variability
D. small within group variability (P VALUE)
(LG SS/ LG BW (SD)
After a ONE WAY ANOVA what should be checked first?
A) Main effect
B) Interaction effect
A) MAIN → INTERACTION
After a TWO WAY ANOVA what should be checked first?
A) Main effect
B) Interaction effect
B) INTERACTION → SIMPLE
After a TWO WAY ANOVA if the Interaction effect is significant what should be checked next?
A) Main effect
B) Simple effect
B
To determine if there is a difference in knee range of motion among three groups
(Group 1: no exercise; Group 2: weight bearing exercise; Group 3: strength exercise)
1 IV / 3 GROUPS
ONE WAY ANOVA
To determine if there is a difference in knee muscle strength in groups (Group 1: no exercise; Group 2: weight bearing exercise) and position of testing
All patients in the study were tested in two positions (25 degrees knee flexion and 45 degrees knee flexion)
2 way Mixed ANOVA
To evaluate the association between functional status (classified in two categories ambulatory/non ambulatory) and type of stroke (left and right side)
Association = nominal
CHI SQUARED
To determine the relationship between knee ROM and functional status while controlling for age
Partial correlation
To determine if there is a difference in 2 groups (Group 1: no exercise; Group 2: weight bearing exercise) for the following variables:
should abduction ROM, should adduction ROM, shoulder flexion ROM, shoulder extension ROM, shoulder internal rotation ROM, shoulder external rotation ROM
MANOVA
T/F Statistical conclusion validity looks at whether appropriate statistics were used by the researchers
TRUE
T/F
Option A will be most powerful
A) Group 1: 20.4 (1.1), n = 80; Group 2: 26.5 (2.4), n = 80
B) Group 1: 18.4 (10.5), n = 50; Group 2: 27.5 (11.4), n = 50
TRUE
T/F Your study shows that the treatment works but in reality this is not true, this is: Type II error
(FALSE POSITIVE)
FALSE:
TYPE 1 = WRONGFULLY REJECT NULL
T/F ANCOVA is a combination of ANOVA and regression analysis
TRUE
T/F When analyzing data from regression analysis high correlation between the predictor variables is desirable
FALSE (YOU WANT LOW CORRELATION B/W PVS)
What do the numbers mean?
A study determined the effect of two different endurance techniques on patient’s oxygen levels
95% CI = -5 to 20 PaO2 mm Hg
0 = No significant difference
Your patient’s performance on a balance test is 70. If the sample mean for this population is 50 and the standard deviation is 10. Calculate the z score from the above information:
A.- 1
B.-2
C.+1
D.+2
D: z = Raw score - Mean
Std Deviation
What do the numbers mean?
Correlation coefficient results for relationship between anxiety and finals week
r = 0.95
P = 0.002
R2 = 0.82
r= very high correlation
P<A= significant
R2= 82% of variability in one variable can be accounted by other
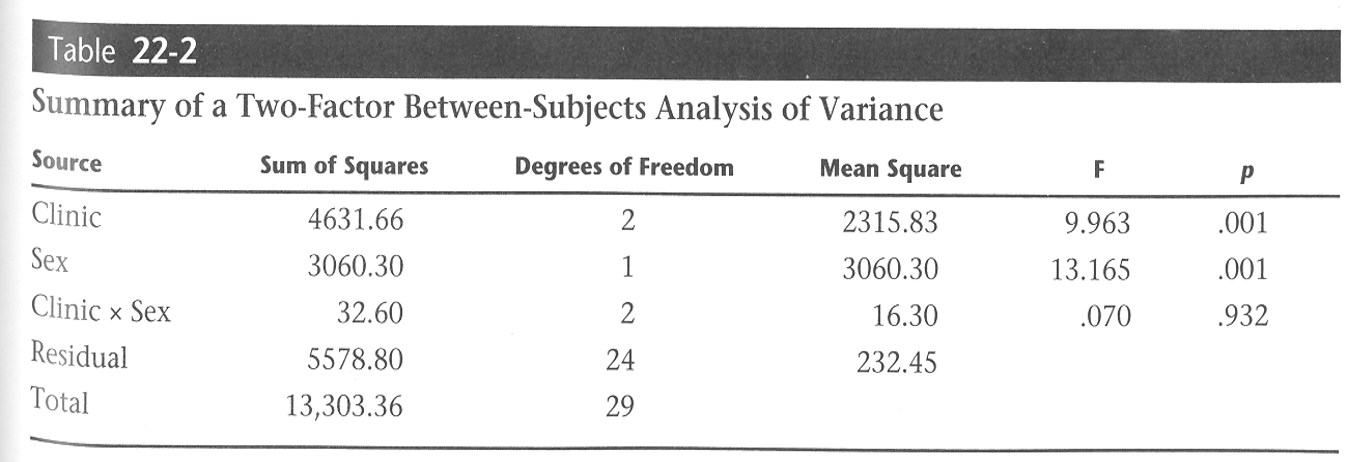
A study evaluated the effect of gender and rehab on ROM. What should be the next step?
(p value > a (no sig diff)) no sig interaction → main effect → one way anova
A physical therapist is evaluating the specificity of the Cozen test in a group of pizza makers. Which of the following results indicates a true positive finding?
A. Patients with a history of elbow pain and Lateral Epicondylitis will test negatively.
B. Patients with a history of elbow pain and Lateral Epicondylitis will test positively.
C. Patients with no history of elbow pain and Lateral Epicondylitis will test negatively.
D. Patients with no history of elbow pain and Lateral Epicondylitis will test positively.
B
A change in behavior when the treatment is introduced and a change in behavior again when the treatment is withdrawn. This describes which of the following single subject designs:
A) A-B
B) A-B-A
C) Multiple Baseline
D) Alternating
B
Ratio
•the relationship between two numbers by diving the numerator by the denominator
•Ratio =a/b
Proportions:
Proportion = a/a+b
Divide (a) by total # , sum of i (a) and s (b)
i.e. what proportion of ankle sprains are inversion sprains?
convert to %
•Rate is a proportion expressed _____
over a particular unit of time.
Change in health variable in the population at risk over a certain period
Prevalence
•the proportion of a population that exhibits a certain condition at a given point in time.
•Prevalence = Existing cases/population examined at a given point in time
Incidence
•The rate of new cases of a condition that develop during a specified period of time
•Incidence= New cases during time period/population at risk during time period
The Relationship Between Prevalence and Incidence
If, incidence is high (many new cases of the disease occur), + the disorder manifests for a short duration (quick recovery/ death), the prevalence may be low.
•Injury/disease of a short duration : rapid resolving/ quickly fatal =Incidence>prevalence
•i.e. common cold: most people get cold (high incidence) but fewer have cold at same time (lower prevalence)
If the incidence of the disorder is low (few new cases occur), + the duration of the disorder is long, the prevalence / proportion of the population that has the disease at a given point in time may be _____
large
Long duration diseases = Incidence is lower than prevalence
•Incidence =____
•PRevalence = _____
•Incidence = New Cases (INCidence)
•PRevalence = Existing cases (PREvalance)
Crude Rate:
calculated using the entire population at risk or of interest.
Specific Rates:
rates for specified subgroups of the population
To determine the relative risk for a disease or injury of two different groups
•Relative risk:
Risk ratio
Odds Ratio
Risk Ratio
•Calculated by creating a ratio of the incidence rate for one subgroup and the incidence rate for another subgroup
odds ratio
The odds ratio is defined as the ratio of the odds of A in the presence of B and the odds of A in the absence of B, or equally the ratio of the odds of B in the presence of A and the odds of B in the absence of A.
•A common function of epidemiological research is to evaluate the usefulness of various
screening and diagnostic tests:
–Sensitivity
–Specificity
–Positive predictive value
–Negative predictive value
•Sensitivity measures the validity based on the probability that someone will test
positive for a condition they have
When a test has a very high sensitivity: a negative result rules out the diagnosis (SnOut).
SnOut= very low likelihood ratio.
Specificity is a measure of validity of a procedure based on the probability that someone will test
negative for a condition they do not have
A positive result with high specificity rules in the diagnosis [Spin].
A high likelihood ratio puts a Spin on diagnostic impact
Likelihood ratios are a measure of power of sensitivity/specificity
A physical therapist is evaluating the specificity of the Cozen test in a group of pizza makers. Which of the following results indicates a true negative finding?
A. Patients with a history of elbow pain and Lateral Epicondylitis
will test negatively.
B. Patients with a history of elbow pain and Lateral Epicondylitis
will test positively.
C. Patients with no history of elbow pain and Lateral Epicondylitis will test negatively.
D. Patients with no history of elbow pain and Lateral Epicondylitis
will test positively
C
•A physical therapist is evaluating the sensitivity of a balance test in a group of older adults. Which of the following results indicates a true positive finding?
•A. Patients with a history of falls test negatively.
•B. Patients with a history of falls test positively.
•C. Patients with no history of falls test negatively.
•D. Patients with no history of falls test positively.
B
Non Experimental Epidemiological Designs
Name all 3
•Cross Sectional
•Case Control
•Cohort Design
•Cross- Sectional Studies
•Used to document the status of a group at a particular point in time.
•Used to document health status at a single point in time for each participant within the study
•Case Control Studies
•Identify individuals with the condition of interest (case)and individuals without the condition of interest (the controls).
•Look into past for the presence or absence of risk factors that might explain the presence/absence of the condition
•Cohort Studies
•Identify individuals with various risk factors and look into future to see if the condition of interest develops.
•The individuals are followed for a period of time to compare their relative risks for developing the disease or injury of interest
The department of public health of a city is interested in knowing the prevalence of congenital heart disease in the city. Which of the following is the correct definition for prevalence of congenital heart disease?
A. Number of new cases of the disease that occur in a population during a period of time/sum for each individual in the population of the length of time at risk of getting the disease
B. Number of individuals who get the disease during a certain period/number of individuals in the population at the beginning of the period X
C. Existing number of individuals having the disease at a specific time/number of individuals in the population at that point in time
D. Number of new cases of the disease that occur in a population during a period of time/number of individuals in the population at the beginning of the period X
C
A pediatric cardiologist is interested in prospectively studying the relationship between length of time of cardiopulmonary bypass during neonatal surgical palliation and correction of congenital heart disease and fine motor development at ages 5 and 10 years. He will be enrolling neonates in this study. This type of study is called as which of the following?
A. Case–control study
B. Cohort study
C. Cross sectional study
D. Retrospective study
B