(T OR F) 2 - Financial Statements Analysis pt. 1
1/59
There's no tags or description
Looks like no tags are added yet.
Name | Mastery | Learn | Test | Matching | Spaced | Call with Kai |
|---|
No analytics yet
Send a link to your students to track their progress
60 Terms
True
True or False
One limitation of vertical analysis is that it cannot be used to compare two companies that are significantly different in size
False
The sale of used equipment at book value for cash will not increase earnings per share (EPS). Since the equipment is sold at book value, there is no gain or loss on the sale, meaning it doesn't affect net income, which is a key factor in calculating EPS
True or False
The sale of used equipment at book value for cash will increase earnings per share.
True or False
An increase in the number of shares of common stock outstanding will decrease the company’s price-earnings ratio if the market price per share remains unchanged
False
An increase in the number of shares of common stock outstanding will not directly affect the price-earnings (P/E) ratio if the market price per share remains unchanged. The P/E ratio is calculated as the market price per share divided by earnings per share (EPS). While issuing more shares may dilute EPS, the market price per share would need to change for the P/E ratio to be affected
True or False
If a company’s acid-test ratio increases, its current capital ratio will also increase
False
Short-term borrowing is indeed a source of working capital. Working capital refers to the funds used to cover a firm's day-to-day operational expenses, and short-term borrowing is one way to obtain these funds to maintain liquidity and manage current liabilities
True or False
Short-term borrowing is not a source of working capital
True
True or False
Attention directing is one of the many basic objectives of financial statement analysis
False
While financial statements are based on historical data, they can still be used to predict future trends and assist in management decision-making. Historical data often provide valuable insights for forecasting and strategic planning
True or False
Since financial statements are summary of historical data, it cannot be used to predict the future for management decision making purposes
True
True or False
The ratio that shows the margin by which the firm’s operating cash flows cover its financial requirements is the cash flow coverage ratio
True
True or False
Companies with relatively high rates of return on equity generally sell at higher multiples of book value than those with low returns.
False
While good liquidity, asset management, debt management, and profitability ratios contribute positively to a firm's financial health, other factors such as market conditions, investor sentiment, and broader economic conditions can still affect a firm's market value ratios and stock price. Therefore, strong financial ratios do not always guarantee the highest possible stock price
True or False
If the firm's liquidity, asset management, debt management and profitability ratios are all good, then, its market value ratios will be high, and its stock price is expected to be as high it can be
False
A high current asset ratio indicates that a company has more current assets relative to its current liabilities, which can suggest strong liquidity. However, it is not always a definitive indicator of a strong liquidity position. Excessive current assets, such as cash or inventory, may also imply inefficiencies or that the company is not using its assets effectively. Thus, while a high current asset ratio generally suggests good liquidity, it is not an absolute measure of financial strength
True or False
A high current asset ratio is always an indication of strong liquidity position
False
In trend analysis, percentage figures are usually computed using the earliest year as a base, not the most recent year. This approach allows for comparisons over time to show how the figures have changed relative to the base year
True or False
In trend analysis, percentage figures are usually computed by using the most recent year as a base
False
Common-size statements are used to compare companies of different sizes by expressing all line items as a percentage of a common figure, such as total revenue for the income statement or total assets for the balance sheet. This makes it easier to analyze and compare financial performance across companies regardless of their size
True or False
Common-size statements are statements of companies of similar size and operations.
True
True or False
An extremely high current ratio may be an indication that receivables and inventories are excessive
False
Trend percentages in financial statements are an example of horizontal analysis, not vertical analysis. Horizontal analysis involves comparing financial data over time to identify trends and changes, while vertical analysis involves expressing each item in a financial statement as a percentage of a base figure within the same period
True or False
Trend percentages in financial statements would be an example of vertical analysis
True
True or False
A common-size statement is one that shows the separate items appearing on it in percentage form, with each item stated as a percentage of some total of which that item is a part.
False
If earnings remain unchanged and the price/earnings (P/E) ratio goes up, the market price of the stock would actually increase. The P/E ratio is calculated as the market price per share divided by earnings per share. Therefore, if the P/E ratio rises while earnings are constant, the market price per share must be increasing
True or False
If earnings remain unchanged and the price/earnings ratio goes up, then, one would expect the market price of a stock to go down
False
Investors seeking capital gains generally prefer a lower dividend payout ratio. A lower dividend payout ratio means more earnings are being reinvested in the company, which can potentially lead to higher capital appreciation and stock price growth over time.
True or False
Investors seeking capital gains would like the dividend pay-out ratio to be high
False
Dividing the market price per share by the dividends per share gives the dividend yield, not the price/earnings ratio. The price/earnings (P/E) ratio is calculated by dividing the market price per share by the earnings per share (EPS)
True or False
Dividing the market price of share of stock by the dividends per share gives the price/earnings ratio
True
True or False
Book value per share is not a good predictor of either earnings potential or debt paying ability
True
True or False
In computing the dividend yield ratio, the investor should use the current market price for the stock, rather than the price that he or she paid for it
True
True or False
If the return on total assets is greater than the after-tax cost of long-term debt, then, leverage is positive, and the common stockholders will benefit
False
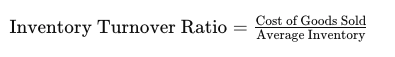
The inventory turnover ratio is computed by dividing the cost of goods sold (COGS) by the average inventory, not sales
True or False
The inventory turnover is computed by dividing sales by average inventory
False
Companies with highly variable earnings, experiencing high earnings on some occasions and losses on others, should generally be cautious with financial leverage. High financial leverage increases the risk of financial distress, as the company must meet fixed interest payments regardless of its earnings performance. For such companies, relying heavily on financial leverage can exacerbate financial difficulties during periods of low earnings or losses
True or False
Companies that experience high earning on some occasions and suffer losses on other occasions should rely heavily on the use of financial leverage
True
True or False
if a company's return no total assets is substantially higher than its cost of borrowing, then, the common stockholders would normally want the company to have a high debt/ equity ratio
True
True or False
Comparisons within a company are often useful to detect changes in financial relationships and significant trends
True
True or False
Comparisons with other companies provide insight into a company's competitive position
True
True or False
Comparisons with industry averages provide information about a company's relative position. within the industry
False
Horizontal analysis is a technique for evaluating financial statement data by comparing financial information over multiple periods to identify trends and changes. The description given refers to vertical analysis, which expresses each item in a financial statement as a percentage of a base amount for a specific period
True or False
Horizontal analysis is a technique for evaluating financial statement data that expresses each. item in a financial statement as a percent of a base amount
True
True or False
Comparisons of company data with industry averages provide information about a company's relative position within the industry
True
True or False
Horizontal, vertical, and ratio analyses are the basic tools of financial statement analysis
False
Horizontal analysis involves comparing financial statement items over multiple periods to assess trends and changes over time, not just within the current year
True or False
Horizontal analysis is a technique for evaluating a financial statement item in the current year with other items in the current year
False
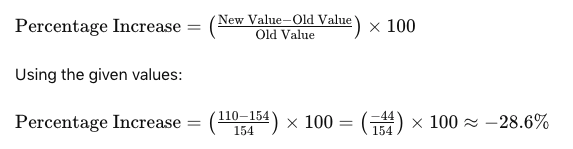
The sales decreased by approximately 28.6% from 2007 - 2008, not increased by 140%; To calculate the percentage increase from 2007 to 2008, you use the given formula
True or False
If a company has sales of P110 in 2008 and P154 in 2007, the percentage increase in sales from 2007 to 2008 is 140%
True
True or False
In horizontal analysis, if an item has a negative amount in the base year, and a positive amount in the following year, no percentage change for that item can be computed
False
The primary purpose of vertical analysis is to express each item in a financial statement as a percentage of a base amount, usually for a single period. It helps to analyze the relative proportion of various components within a single financial statement, rather than observing trends over multiple periods. Observing trends over a period typically falls under horizontal analysis
True or False
A primary purpose of vertical analysis is to observe trends over a three-year period
False
Vertical analysis involves evaluating each item in a financial statement as a percentage of a base amount within a single period. To determine increases or decreases over time, you would use horizontal analysis, which compares financial data across multiple periods
True or False
Vertical analysis is a technique for evaluating a series of financial statement data over a period to determine the increase (decrease) that has taken place
False
While vertical analysis of the income statement does show net income as a percentage of net sales, it doesn't necessarily imply that the cost of goods sold (COGS) as a percentage of sales must be 90%. The COGS percentage plus the net income percentage should equal the percentage of net sales after accounting for other expenses, such as operating expenses, interest, and taxes
True or False
Using vertical analysis of the income statement, a company's net income as a percentage of net sales is 10%; therefore, the cost of goods sold as a percentage of sales must be 90%
False
Liquidity ratios measure the ability of an enterprise to meet its short-term obligations, not its long-term survival. For long-term survival, other ratios such as solvency ratios or leverage ratios are more appropriate
True or False
Liquidity ratios measure the ability of the enterprise to survive over a long period of time
False
A solvency ratio measures an enterprise's ability to meet its long-term obligations and maintain its financial stability. To measure income or operating success, you would use profitability ratios, such as the return on assets or return on equity
True or False
A solvency ratio measures the income or operating success of an enterprise for a given period
False
Receivable turnover measures how efficiently a company collects its receivables, indicating the effectiveness of credit policies and collection practices. It is not directly used to assess the profitability of receivables; instead, profitability is assessed using ratios like return on assets or return on equity
True or False
Receivable turnover is useful in assessing the profitability of receivables
True
True or False
The inventory turnover ratio measures the number of times on average the inventory was sold during the period
True
True or False
Inventory turnover is a measure of liquidity that focuses on efficient use of inventory
True
True or False
Profitability ratios are frequently used as a basis for evaluating management's operating effectiveness
False
The return on assets (ROA) ratio is generally lower than the rate of return on common stockholders' equity (ROE) if the company has been successful in trading on equity at a gain. This is because leveraging (or trading on equity) magnifies the returns to common stockholders, making ROE higher than ROA
True or False
The return on assets ratio will be greater than the rate of return on common stockholders' equity if the company has been successful in trading on the equity at a gain
False
From a creditor's point of view, a higher total debt to total assets ratio indicates greater risk, as it suggests that a larger portion of the company's assets are financed by debt. This increases the risk that the company may be unable to meet its obligations
True or False
From a creditor's point of view, the higher the total debt to total assets ratio, the lower the risk that the company may be unable to pay its obligations
E) common-sized financial statements
Which of the following below generally is the most useful in analyzing companies of different sizes?
A) audit report
B) trend analysis
C) price-level accounting
D) comparative statements
E) common-sized financial statements
E) common-sized balance sheet
A balance sheet that displays only component percentages is called
A) trend analysis
B) trend balance sheet
C) condensed balance sheet
D) comparative balance sheet
E) common-sized balance sheet
A) base year figure
In horizontal analysis, each item expressed as a percentage of the
A) base year figure
B) total assets figure
C) net income figure
D) retained earnings figure
E) all of the above
B) increase
The acceleration in the collection of receivables will tend to cause the accounts receivable turnover to
A) decrease
B) increase
C) remain the same
D) either increase or decrease
C) Current ratio will increase
A company with ₱80,000 in current assets and ₱20,000 in current liabilities pays a ₱10,000 current liabilities. As a result of this transaction, which of the following is correct?
A) Current ratio will decrease
B) Working capital will decrease
C) Current ratio will increase
D) Both A and B
E) Both B and C
D) The company sold merchandise on open account that earned a normal gross margin
Roselyn Corp has a 2 to 1 current ratio. This ratio would increase if
A) The company wrote off an uncollectible receivable
B) The company purchased inventory on open account
C) A previously declared stock dividend were distributed
D) The company sold merchandise on open account that earned a normal gross margin
D) Times interest earned ratio
This measures a company's ability to cover its interest expenses with its earnings before interest and taxes (EBIT). A higher ratio suggests a stronger ability to meet interest obligations and a better long-term debt-paying ability
A measure of the company's long term debt paying ability is
A) Operating cycle
B) Return on assets
C) Dividend out ratio
D) Times interest earned ratio
D) Dividend yield ratio
It measures the income generated from dividends relative to the stock price and is more related to shareholder returns rather than direct profitability.
Financial ratio, which assess the profitability of a company, include all of the following except:
A) Return on sales
B) Gross profit rate
C) Earnings per share
D) Dividend yield ratio
C) Decline and no effect
Kevin Inc. has a current ratio of 0.65 to 1. A cash dividend declared last month is paid this month. What is the effect of this dividend payment on the current ratio and working capital respectively?
A) Rise and decline
B) Rise and no effect
C) Decline and no effect
D) No effect on both ratios
B) Customers are making payments quickly
A high receivable turnover ratio indicates
A) The company’s sales have increased
B) Customers are making payments quickly
C) A large portion of the company’s sales are on credit
D) Many customers are not paying the company’s receivables
B) Horizontal analysis
The percentage change in total assets between two balance sheet dates is an example of
A) Vertical analysis
B) Horizontal analysis
C) Capital analysis
D) Profitability analysis
A) Capital analysis
The tools and techniques used to analyze financial statements are divided into broad categories including all the following except
A) Capital analysis
B) Vertical analysis
C) Horizontal analysis
D) Ratio analysis
D) the base-period amount
The percentage change in any individual item shown on comparative financial statements is calculated by dividing the peso amount of the change from the base-period to the current period by
A) the amount shown for the current period
B) the sum of the current period amount and the base-period
C) the average of the amounts shown for the base period and the current period
D) the base-period amount
A) horizontal analysis
The fact that sales increased by ₱20,000 from 2017-2018 would most likely revealed by
A) horizontal analysis
B) vertical analysis
C) ratio analysis
D) liquidity analysis
A) percentage changes in the balances shown in comparative financial statements
Horizontal analysis involves the study of
A) percentage changes in the balances shown in comparative financial statements
B) the percentage amount of various financial statements amount compared to a total amount on the financial statement
C) the change in key financial statement ratios over a certain time frame or horizon
D) the interrelationship between the income statement and balance sheet