GEL
 Call Kai
 Learn
Learn Practice Test
 Spaced Repetition
 Match
Match Flashcards
 Knowt Play
1/127

There's no tags or description
Looks like no tags are added yet.
Name | Mastery | Learn | Test | Matching | Spaced | Call with Kai | Chat |
|---|
No analytics yet
Send a link to your students to track their progress
128 Terms
What is primary data?
Data collected first-hand:
photographs
sketches
responses from closed-ended questionnaire surveys
etc
What is secondary data?
Data collected by other people:
books
newspaper articles
journals
maps
etc
all produced by other authors
What is quantitative data?
Data that can be quantified and measured:
responses from closed-ended questionnaire surveys
What is qualitative data?
Data that are not easily measured and subjective in nature:
responses from open-ended questions in semi-structured interviews
How to sequence data collection? (1/2)
Quantitative data followed by Qualitative data:
1) quantitative data collected → identify patterns and trends
2) qualitative data collected → examine the patterns and trends observed
How to sequence data collection? (2/2)
Qualitative data followed by Quantitative data:
1) qualitative data collected → make observations
2) quantitative data collected → verify the observations
What are the limitations that need to be considered when designing fieldwork?
Data to be collected
Time available
Access to places
Availability of equipment
Manpower
E.g., it’s impractical to collect all residents’ views on the quality of nearby nature areas (cleanliness, biodiversity)
- It’s more manageable if the study area is restricted to selected housing blocks within a precinct
What are the risks in fieldwork, and how can they be mitigated? (1/2)
Falls, cuts, and minor injuries
Wear proper footwear and clothing
Take note of potential hazards i.e., uneven surfaces, steep steps, or jagged rocks
What are the risks in fieldwork, and how can they be mitigated? (2/2)
Traffic accidents and collisions with cyclists
Take note of local traffic hazards and road crossing procedures
Avoid collecting data on the road or in the path of cyclists
What is fieldwork?
The systematic approach to investigating geographical phenomena and their related issues.
The 5 stages of the fieldwork process are:
1) Crafting of research question or hypothesis
2) Collection of data
3) Analysis of data
4) Presentation of findings
5) Conclusion and evaluation
Why is sampling necessary?
It’s often not possible and practical to obtain information from the entire population, as it’s way too time-consuming
Statistically, a sample size of 30 would be reasonable enough to conduct an analysis of the data
What is probability sampling?
Samples are randomly selected →
via a die or random number generator
removes bias
higher chance of creating a representative sample
Used when:
selecting a more representative sample
E.g.
1) Simple Random Sampling
2) Stratified Random Sampling
What is non-probability sampling?
Samples non-randomly selected →
unlikely to be a representative sample as it is hard to make generalisations about the population;
(a) subjective selection of samples (close friends or family)
(b) biased in nature
Used when:
it’s unnecessary or impractical to select a representative sample for the fieldwork
time constraints
E.g.
1) Convenience Sampling
2) Quota Sampling
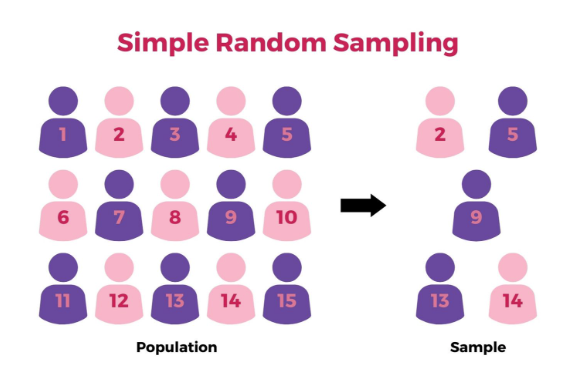
How is simple random sampling performed?
Every member of the population is given a number
A random number generator is used to generate random numbers (4, 5, 8) to select the samples
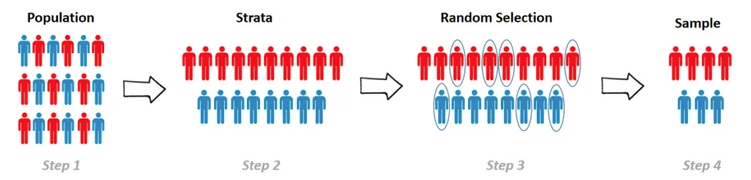
How is stratified random sampling performed?
Select a sample that has a proportionate makeup of the population based on varying categories
age
sex
ethnicities
etc
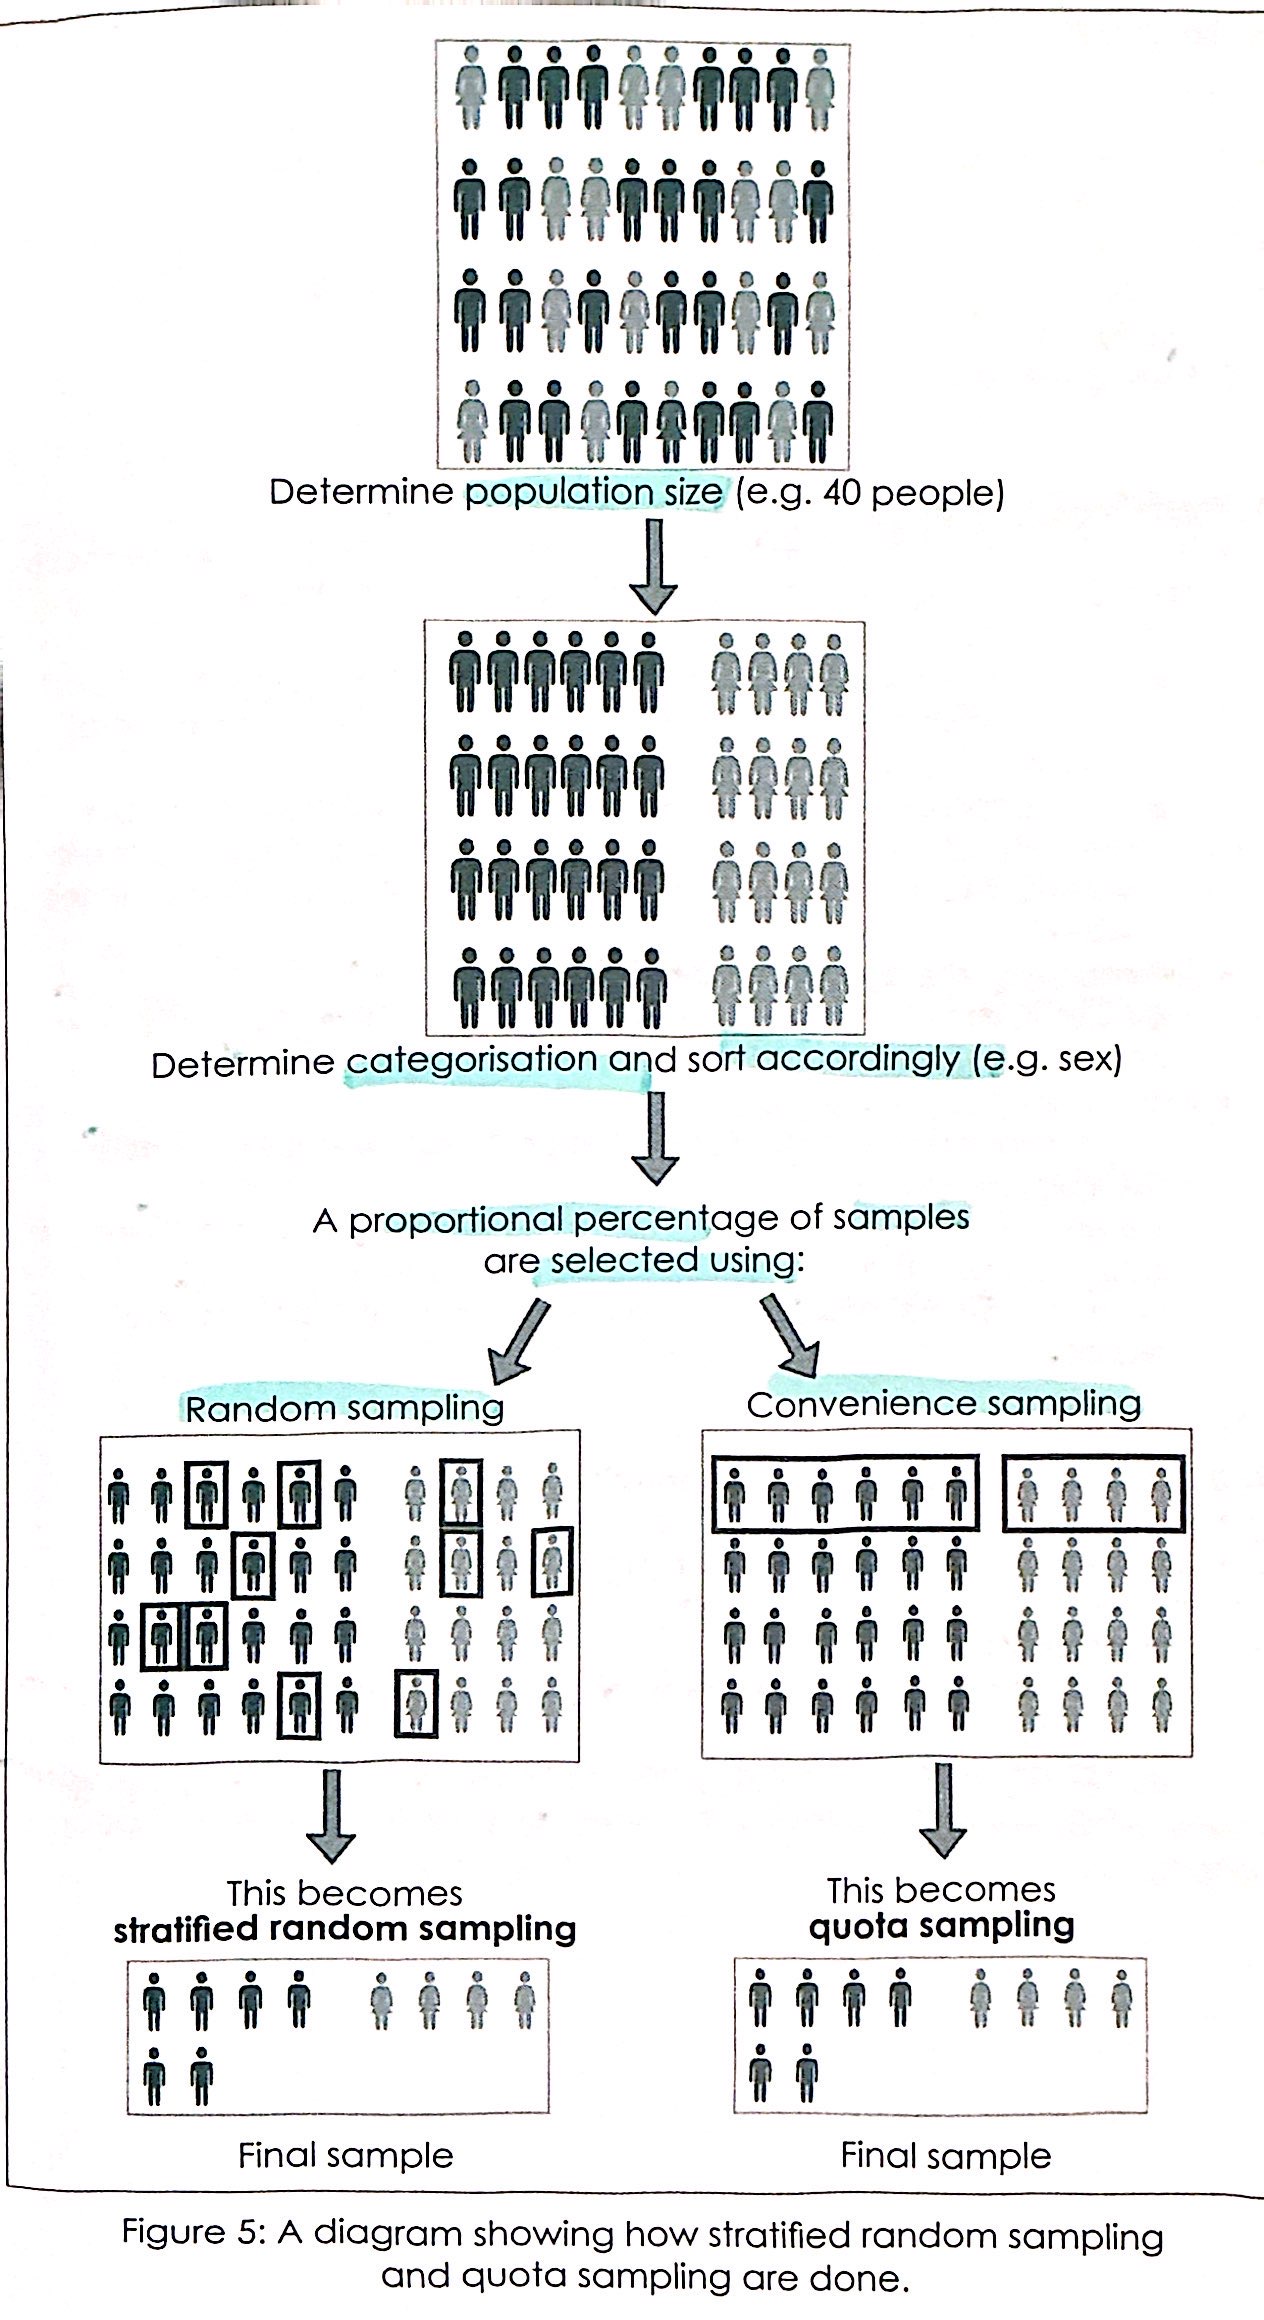
Then, probability sampling, such as random sampling, is used to select the sample
if not used, it’s considered quota sampling
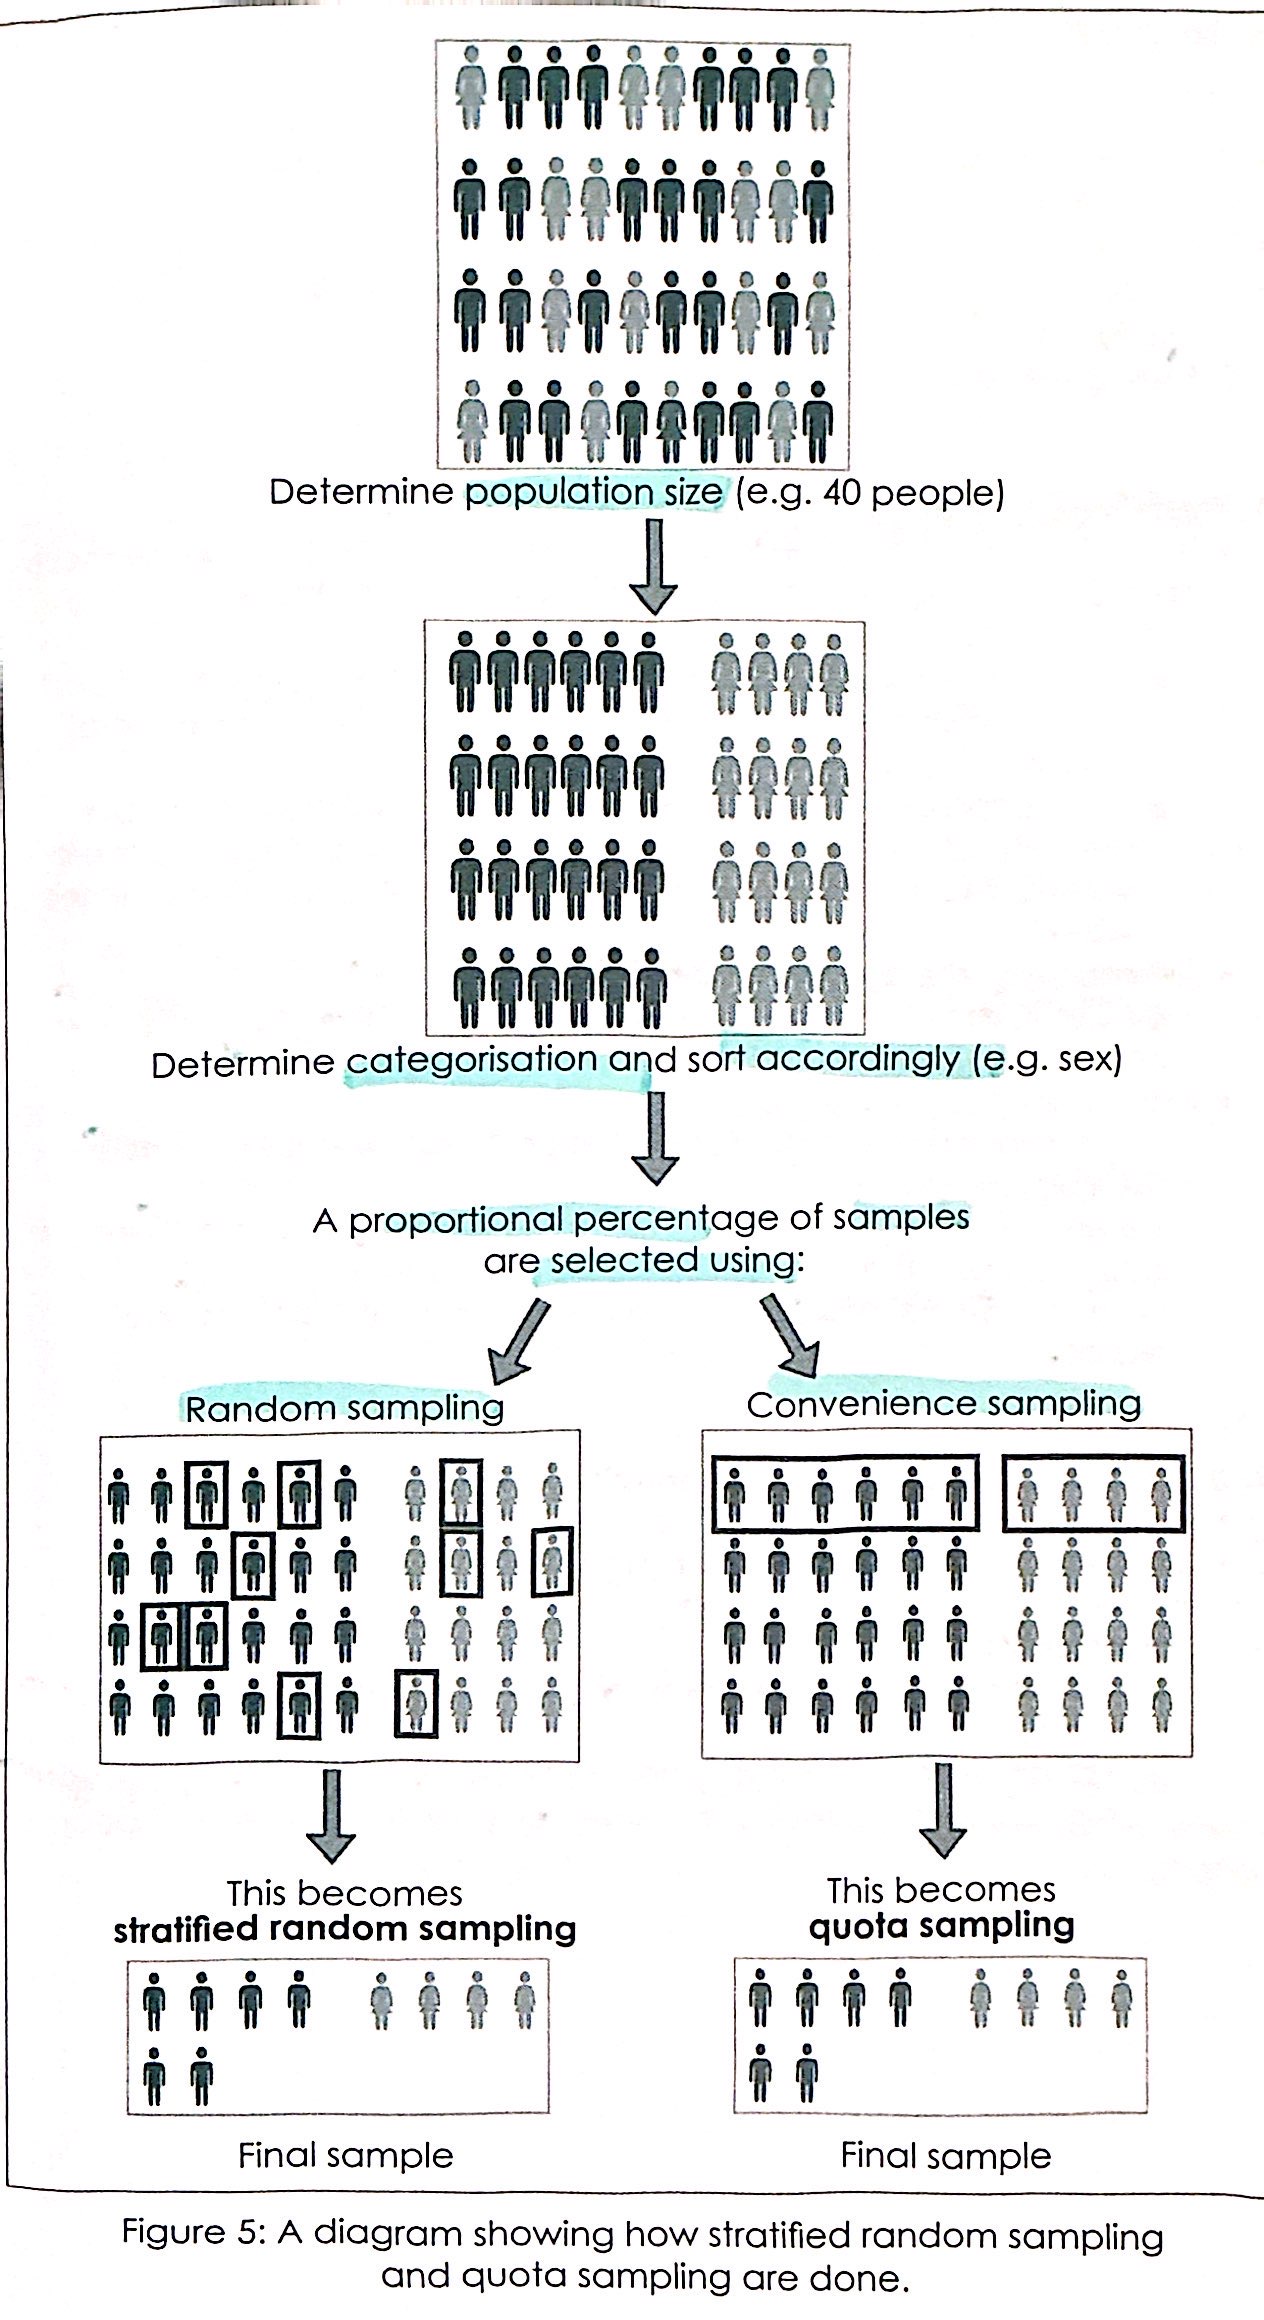
How is quota sampling performed?
Select a sample that has a proportionate makeup of the population based on varying categories
age
sex
ethnicities
etc
Non-probability sampling, such as convenience sampling, is used to select the sample
How is convenience sampling performed?
Samples selected are usually close friends and family because they are convenient sources of data
How are stratified random sampling and quota sampling are done?
What are predefined responses in a questionnaire survey?
They are:
short phrases
single words
numbers
Advantages:
guides respondents → easier for them to answer
data collected are easier to analyse and interpret since they are put into fixed categories
useful for quantitative data analysis to examine patterns and trends
E.g.
- “yes”, “somewhat”, “no”
- “less than once a week”, “once a week”, “two to three times a week”, “more than three times a week”
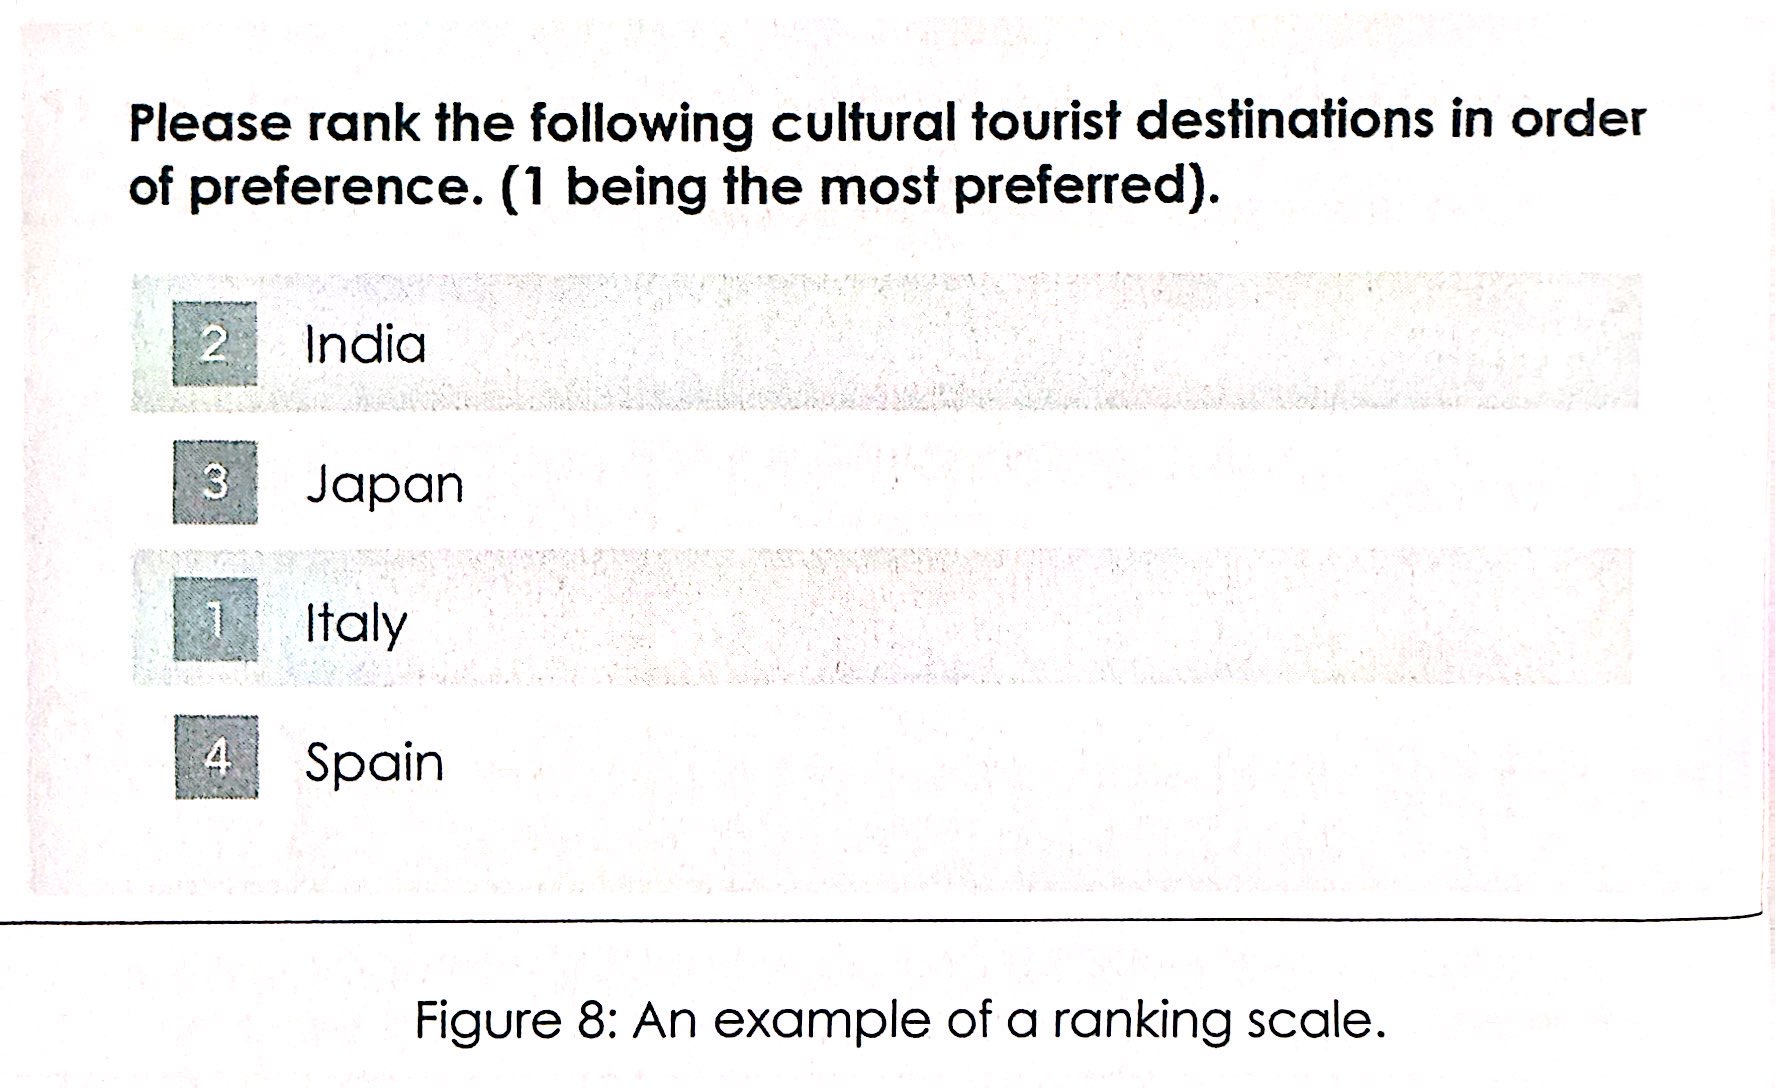
How are rating scales used in a questionnaire survey?
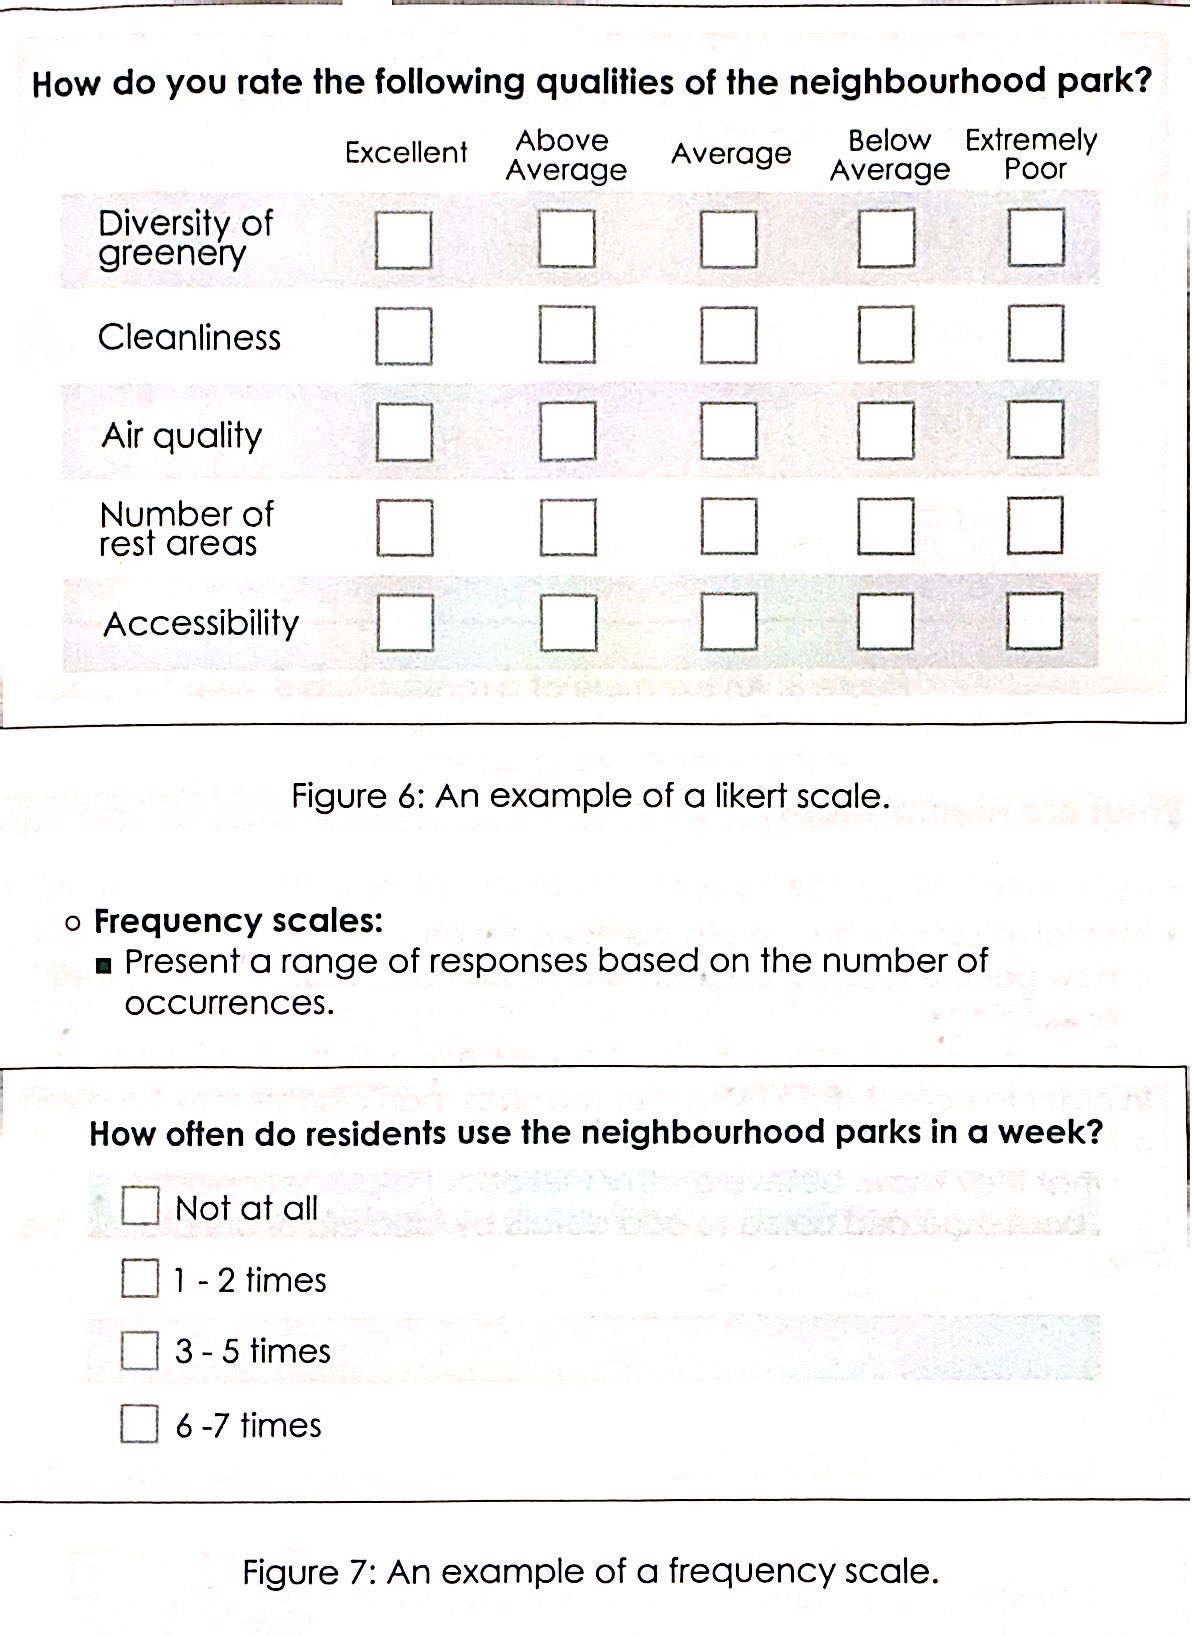
these scales include a set of predefined responses
often used to guide respondents to respond to questions on their opinions with a wide range of responses
E.g.
Likert scales
Frequency scales
Ranking Scales
to produce reliable data: <10 items to compare
→ >10 items: respondents would not have strong opinions about items ranked in the middle
What are mental maps?
Used to -
1) collect data on how people think and experience their environment both:
visually
spatially
2) the dynamic interrelationships people have with their environment
drawn mental maps can be used as discussion points in semi-structured interviews with open-ended questions to find out more about the mapper’s perception of places
(FYI)
Drawn features can appear as distortions, mislabellings and mislocations → key in understanding the factors that influence the mapper’s perceived space
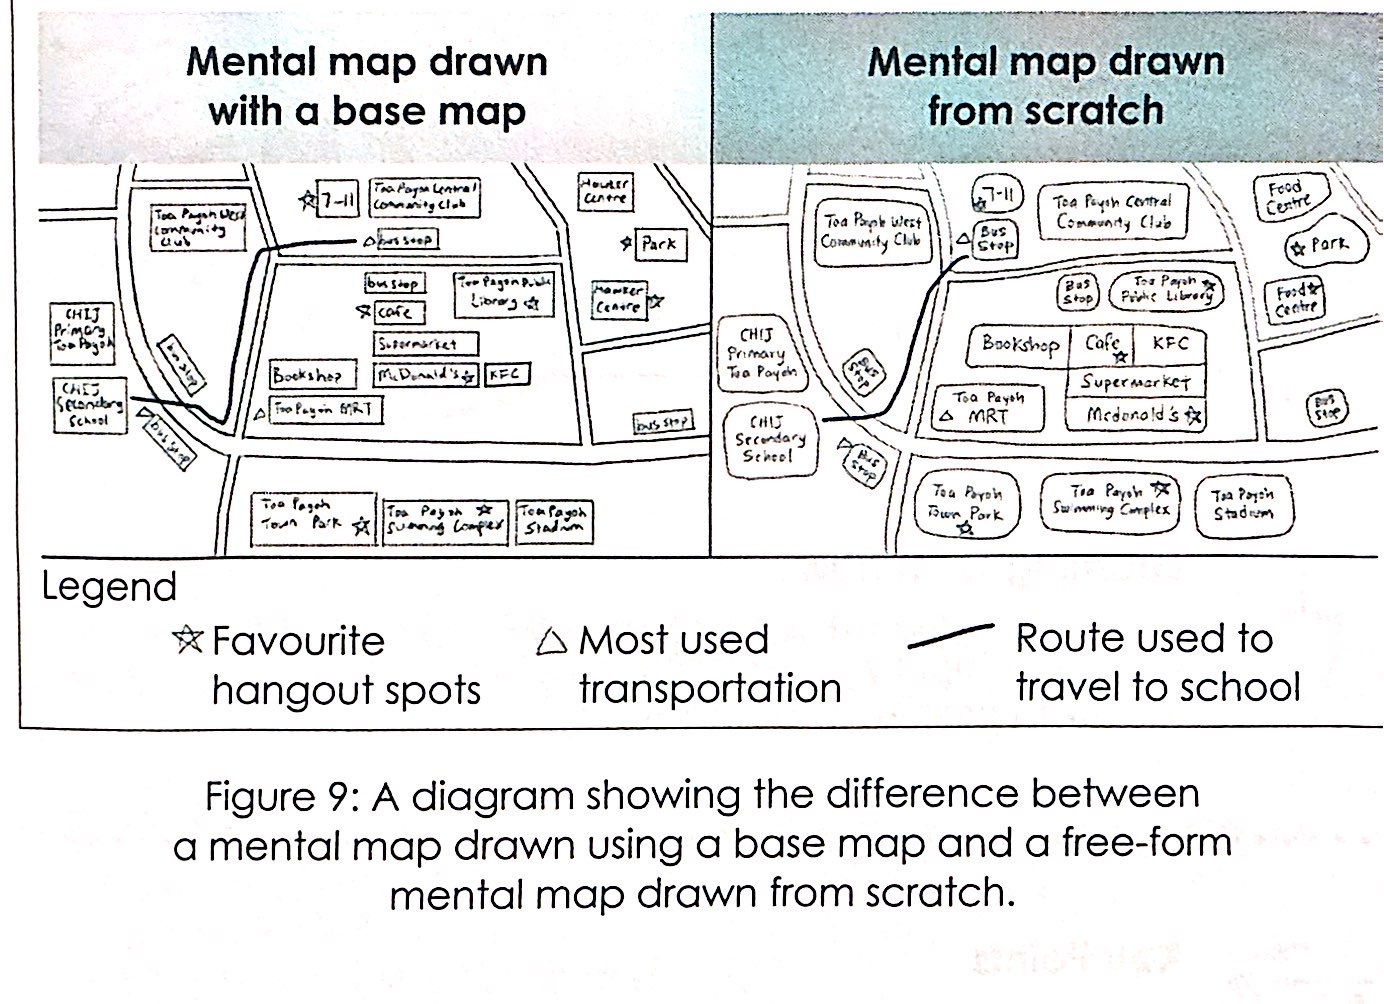
What are the differences between a free-form mental map and a mental map drawn with a base map?
1) Free-form mental maps are more representative of the mapper’s perception of places
2) Mental maps drawn with a base map are easily georeferenced and mapped digitally onto GIS
How to analyse mental maps: Are features drawn at the centre or near the border? (1/7)
Drawn at the Centre:
capture attention
may signal greater importance to the mapper as compared to those drawn at the borders
However, not all positions of the different features may match reality
i.e., not geographically mapped
How to analyse mental maps: Are features drawn larger or smaller? (2/7)
(Scale)
Larger Features may indicate:
greater familiarity
more frequent activity done @ the place
However, larger features drawn by the mapper may be smaller than other features in reality
i.e., not geographically true to scale
How to analyse mental maps: Are there any annotations or labels? (3/7)
Labelled and Annotated Features:
indicates mapper’s familiarity
content and word choices (+ve/-ve) → information on the mapper’s knowledge and emotions of the places experienced
How to analyse mental maps: Are features coloured? (4/7)
Colours used in maps:
differentiate places and convey emotions
i.e. red = anger
How to analyse mental maps: Any use of symbols to represent experiences? (5/7)
Symbols like hearts and stars:
convey personal experiences or information about places
i.e. stars around place = favourite or important location to the mapper
How to analyse mental maps: Is the map drawn at an aerial view or street view? (6/7)
Mental maps may present different POVs:
Aerial View → captures large area with less details
Street View → captures small area with greater details
How to analyse mental maps: Any other miscellaneous details? (7/7)
A place closer to the mapper’s home:
may be important to the mapper
A place’s position or orientation in relation to the surroundings:
reveals the mapper’s experiences
Paths, nodes, or intersections may be added to mental maps:
shows the mapper’s personal history of the place
i.e. a route that was taken often
How may quantitative data from closed-ended questionnaire surveys be processed and analysed?
1) Measures of Frequency
usage of counts and percentages
2) Measures of Central Tendency
mean
median
mode
Under different conditions, it may be more appropriate to use one of the measures than others
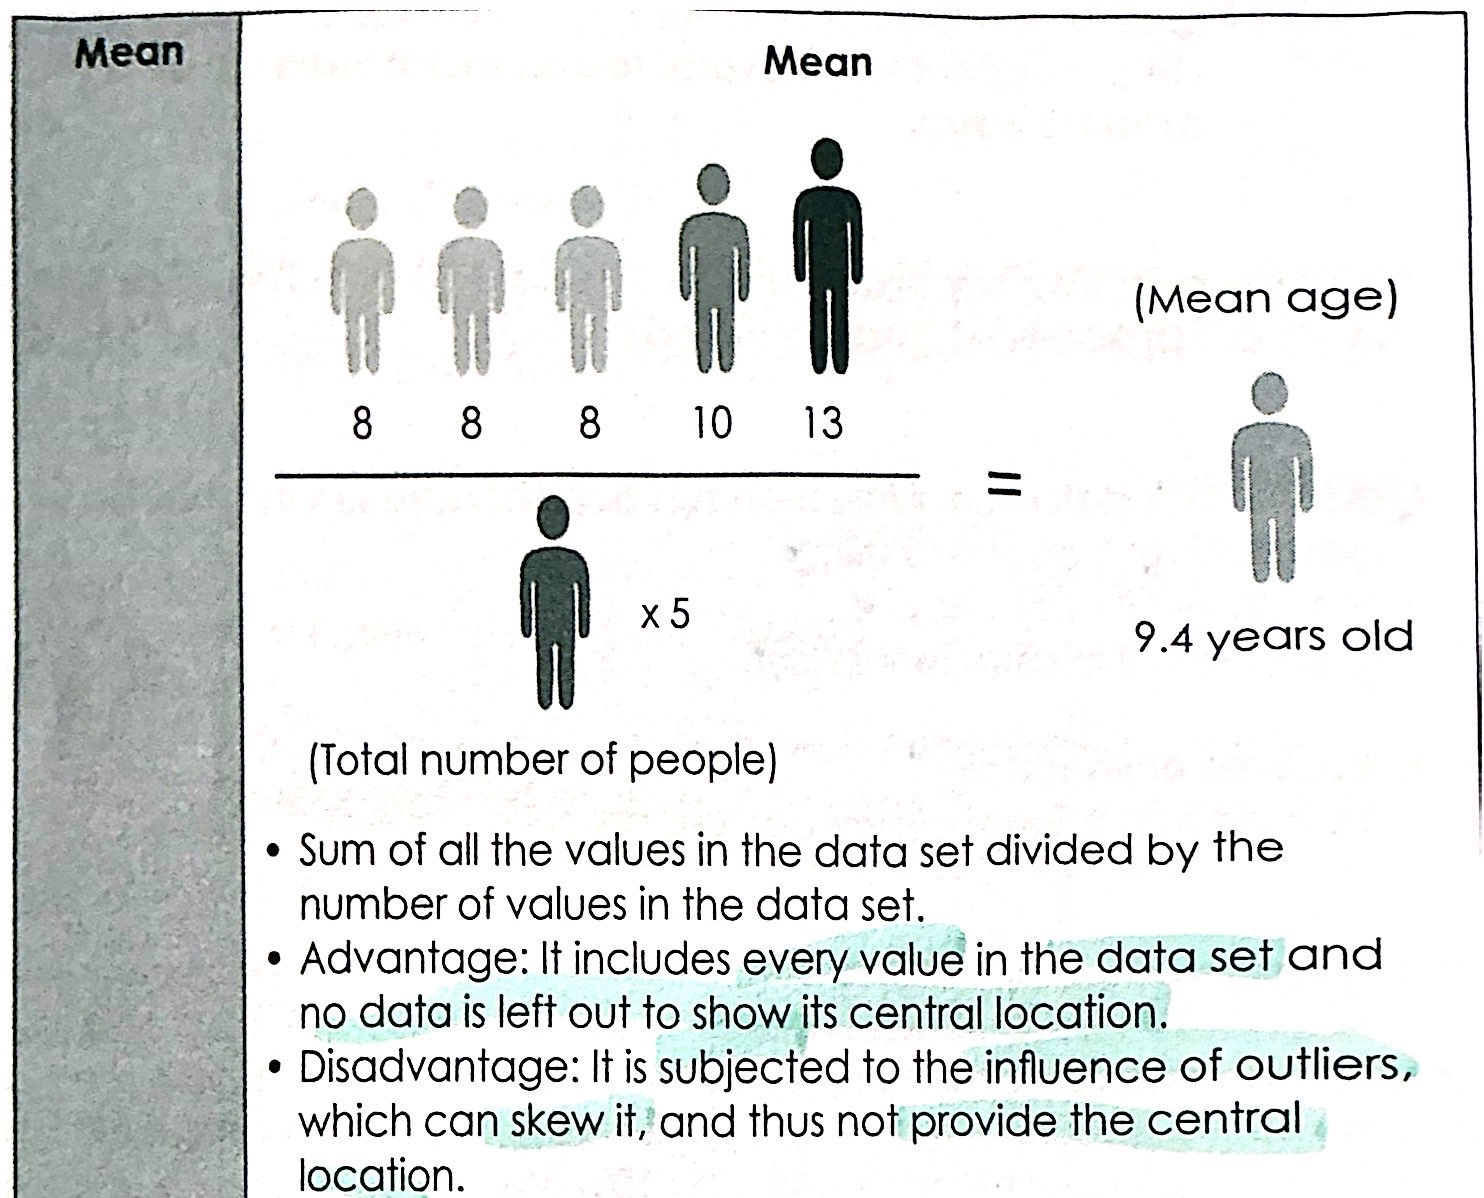
When to use mean to analyse and process quantitative data from closed-ended questionnaire surveys?
Sum of all the values in the data set divided by the number of values in the data set
Advantages:
includes every value in the data set
no data is left out to show its central location
Disadvantages:
subjected to the influence of outliers which can skew it
∴ no provision of the central location
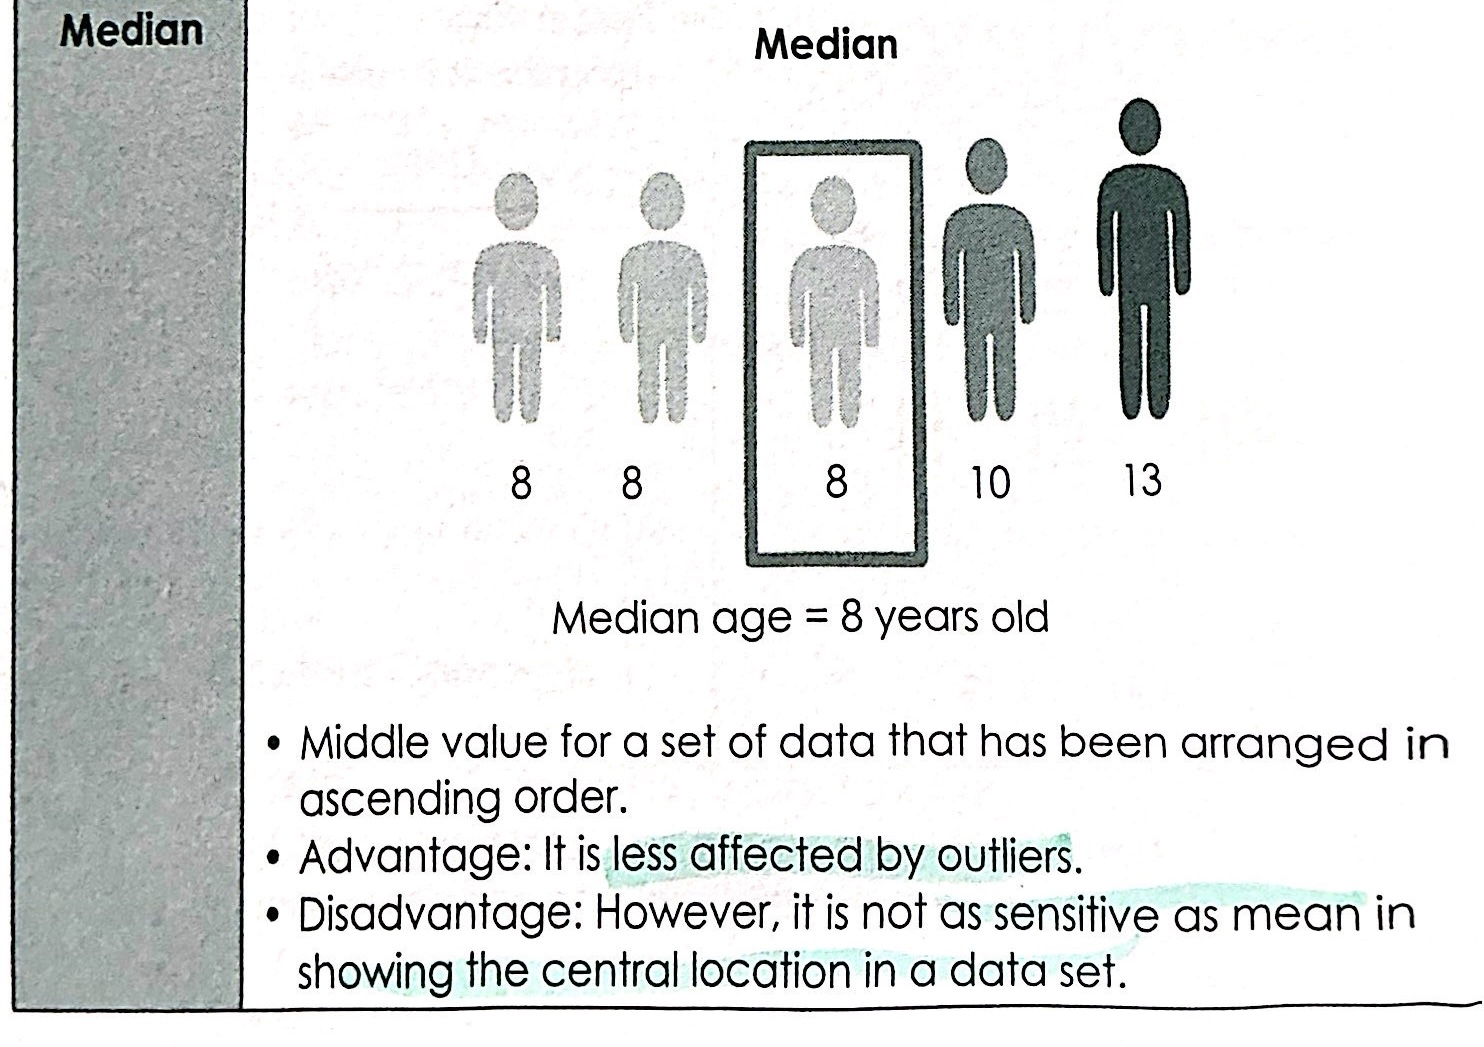
When to use the median to analyse and process quantitative data from closed-ended questionnaire surveys?
The middle value for a set of data that has been arranged in ascending order
Advantage:
less affected by outliers
Disadvantage:
not as sensitive as mean in showing the central location in a data set
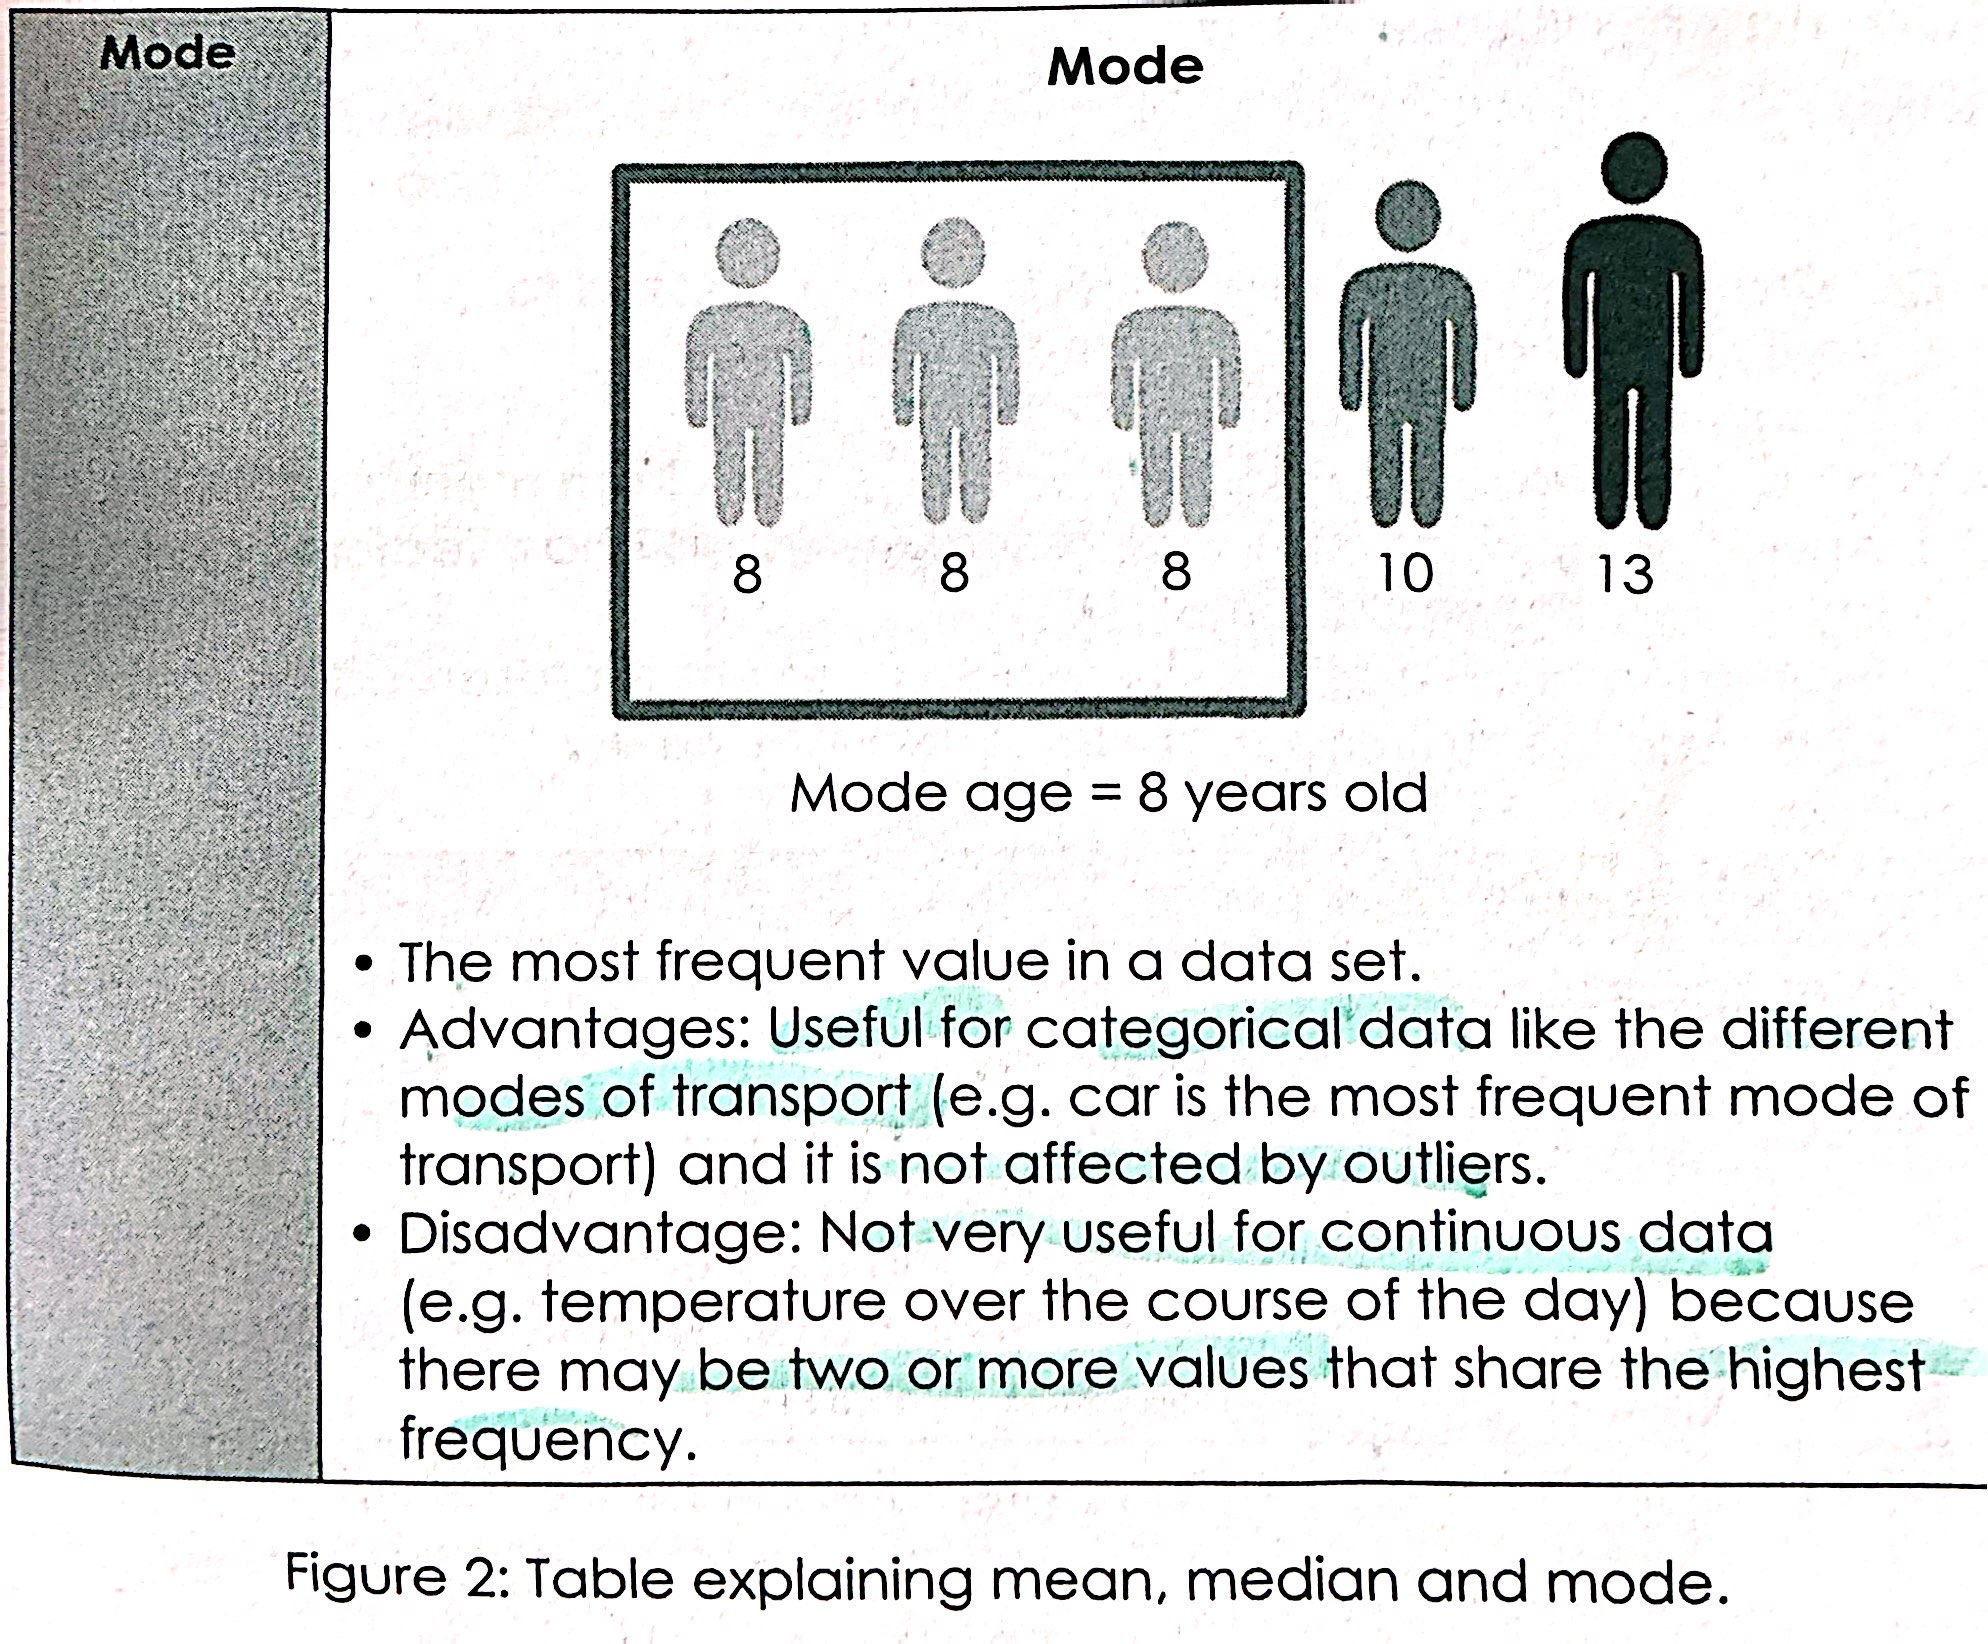
When to use mode to analyse and process quantitative data from closed-ended questionnaire surveys?
The most frequent value in a data set
Advantages:
useful for categorical data (e.g. different modes of transport)
not affected by outliers
Disadvantage:
not useful for continuous data (e.g. temperature over the course of the day) as there may be >2 values that share the highest frequency
How may relationships and patterns be examined?
Analysing processed data requires researches to explain and interpret observable patterns and relations done by identifying:
1) Patterns and relationships from scatter plots and best-fit lines
2) Recognisable geometric shapes, clusters and repetitions from data sets (e.g. maps)
How are patterns and relationships from scatter plots and best-fit lines identified?
Used to:
determine if there’s a relationship between 2 scenarios
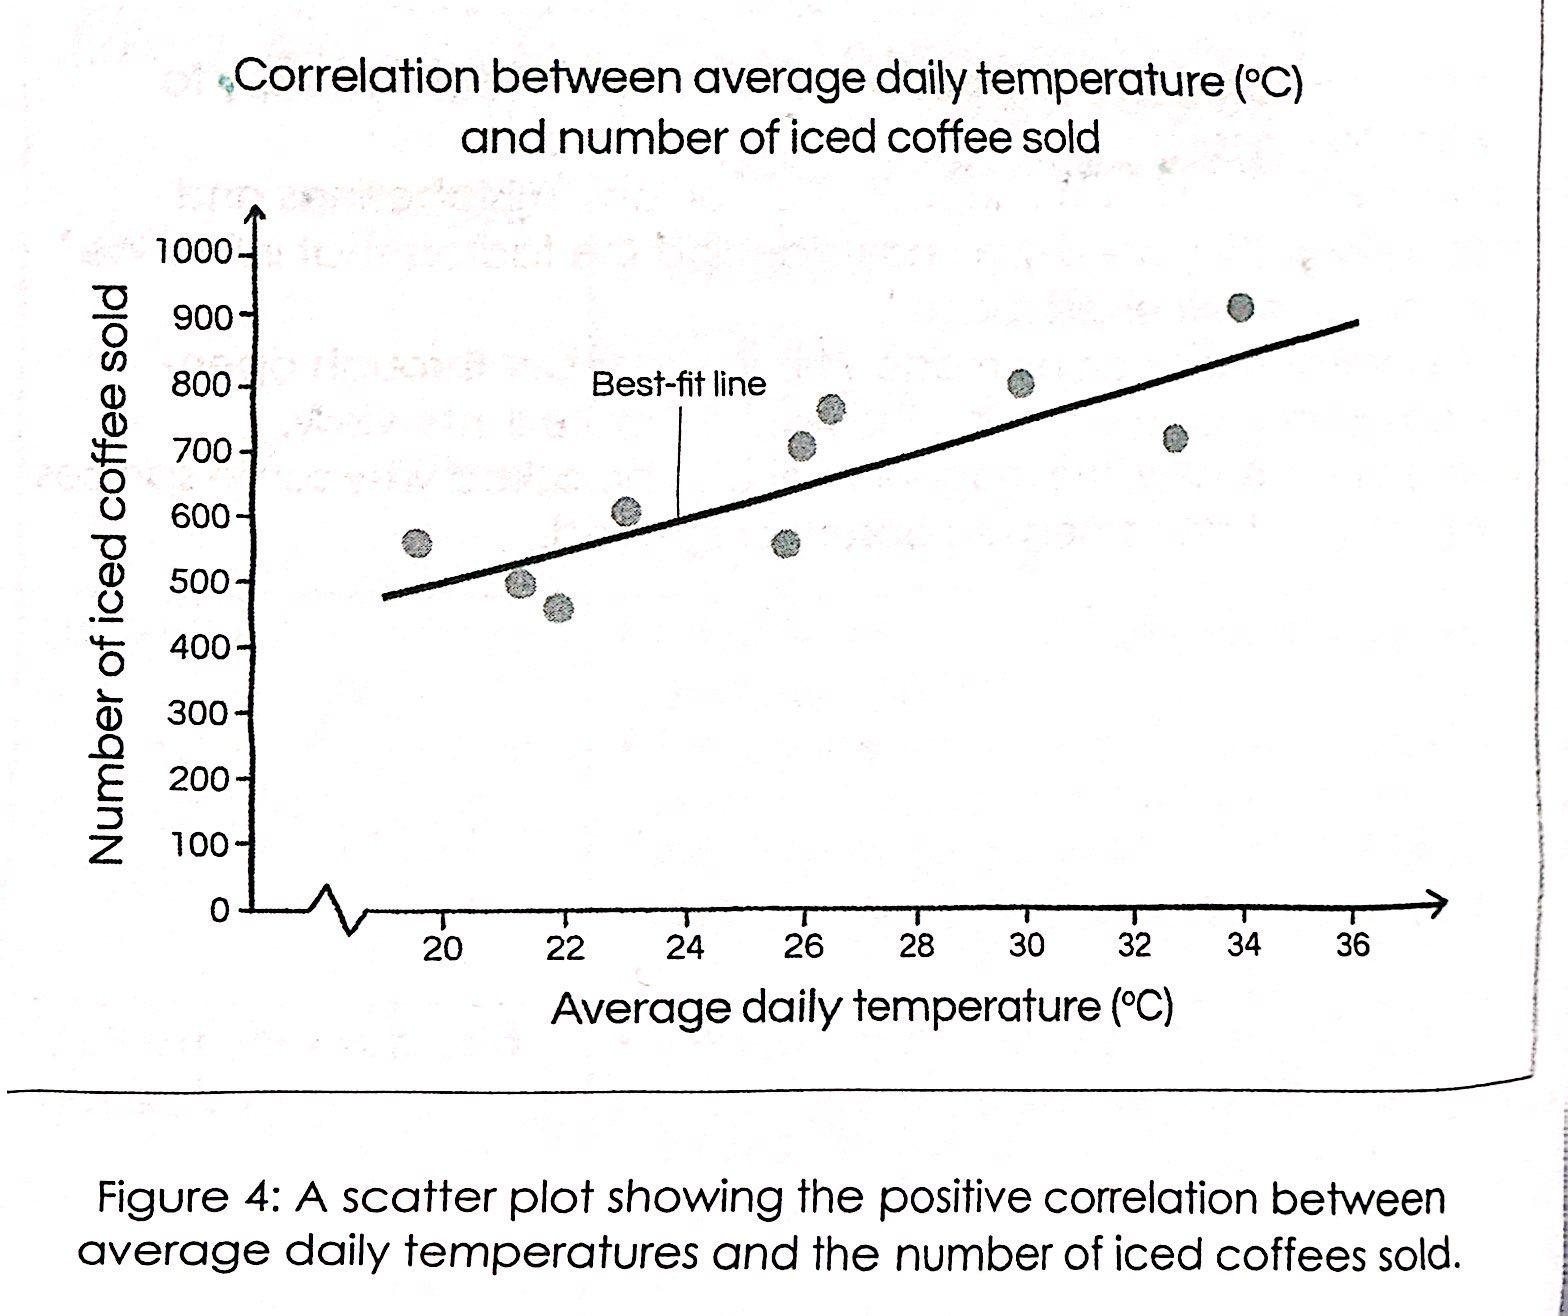
E.g. ‘Temperature’ is the independent variable (cause/controlled/x-axis) and ‘Iced Coffee Sales’ is the dependent variable (effect/measured/y-axis)
Some Scenarios:
1) Positive Correlation
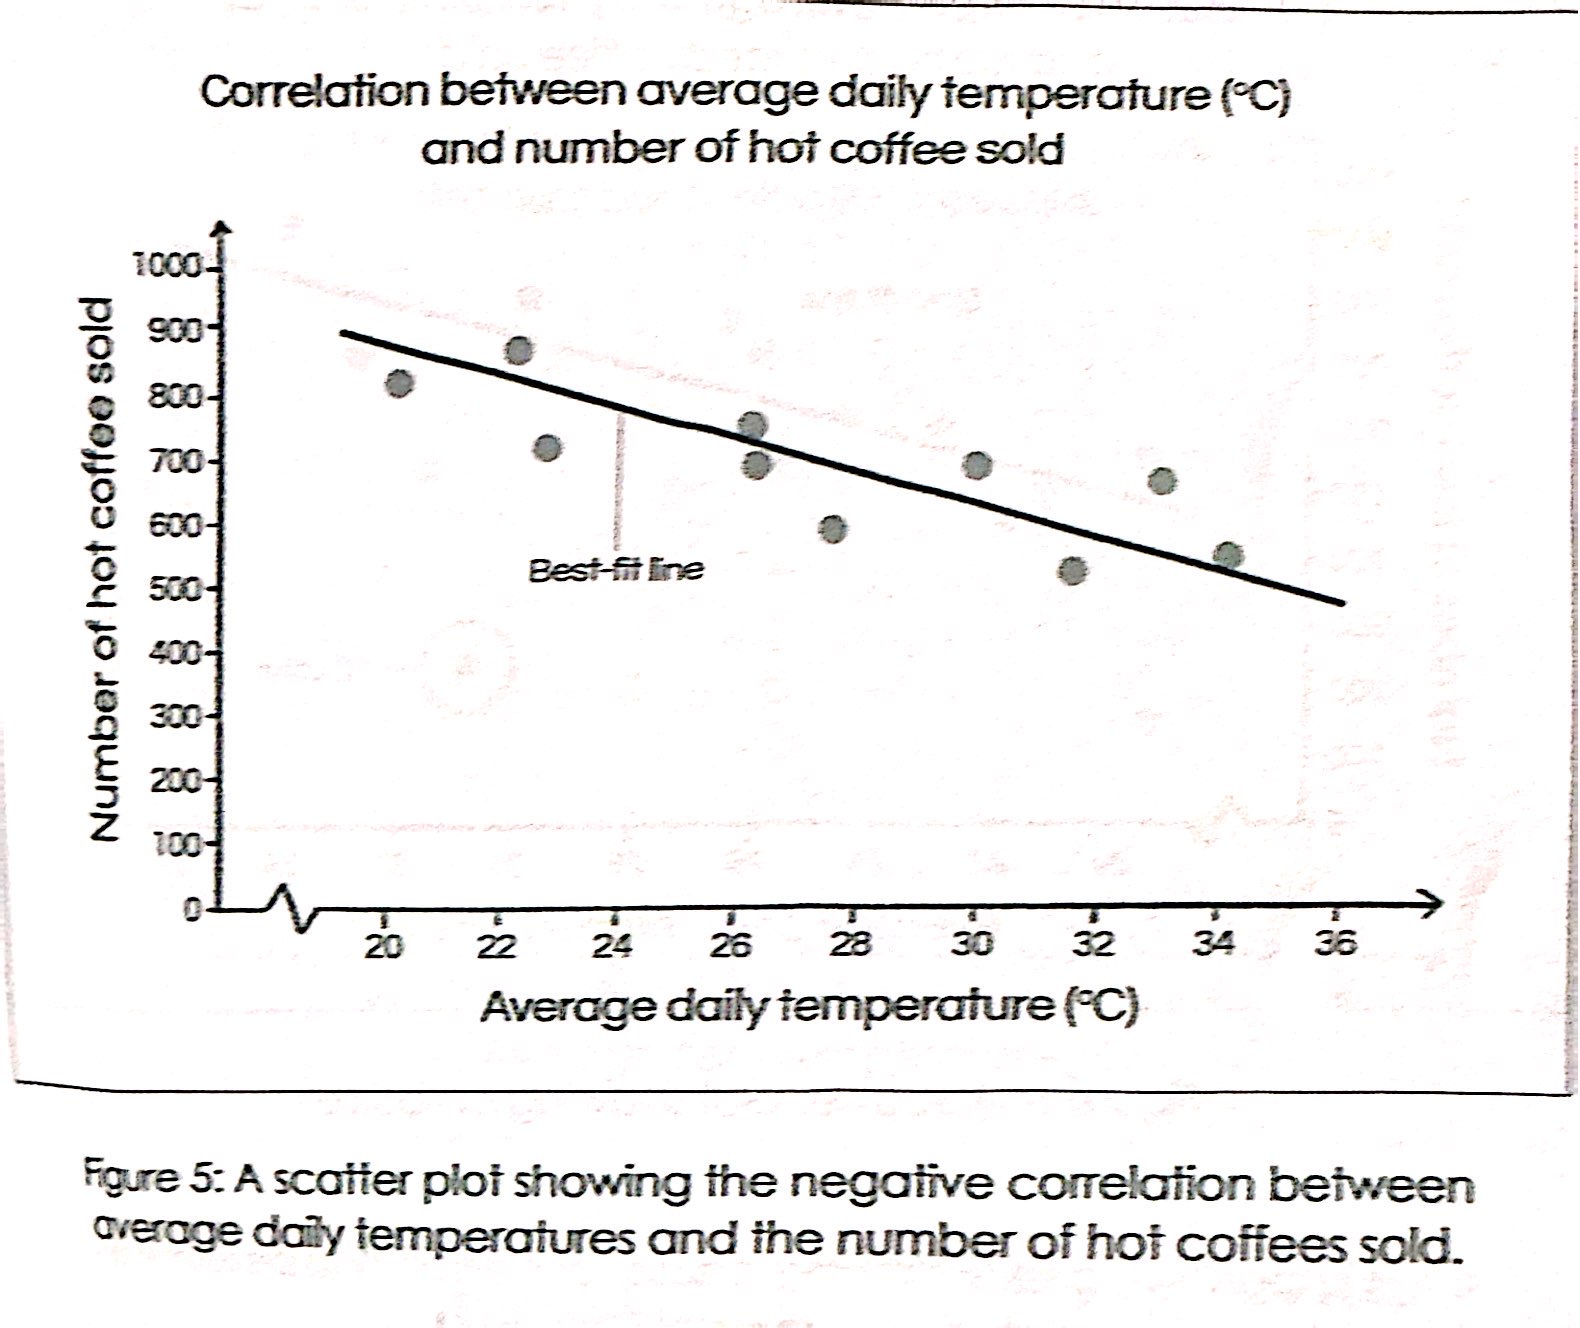
2) Negative Correlation
3) Correlation + Outlier
4) No relationship
Scenario 2
Negative correlation
Scenario 3
outlier
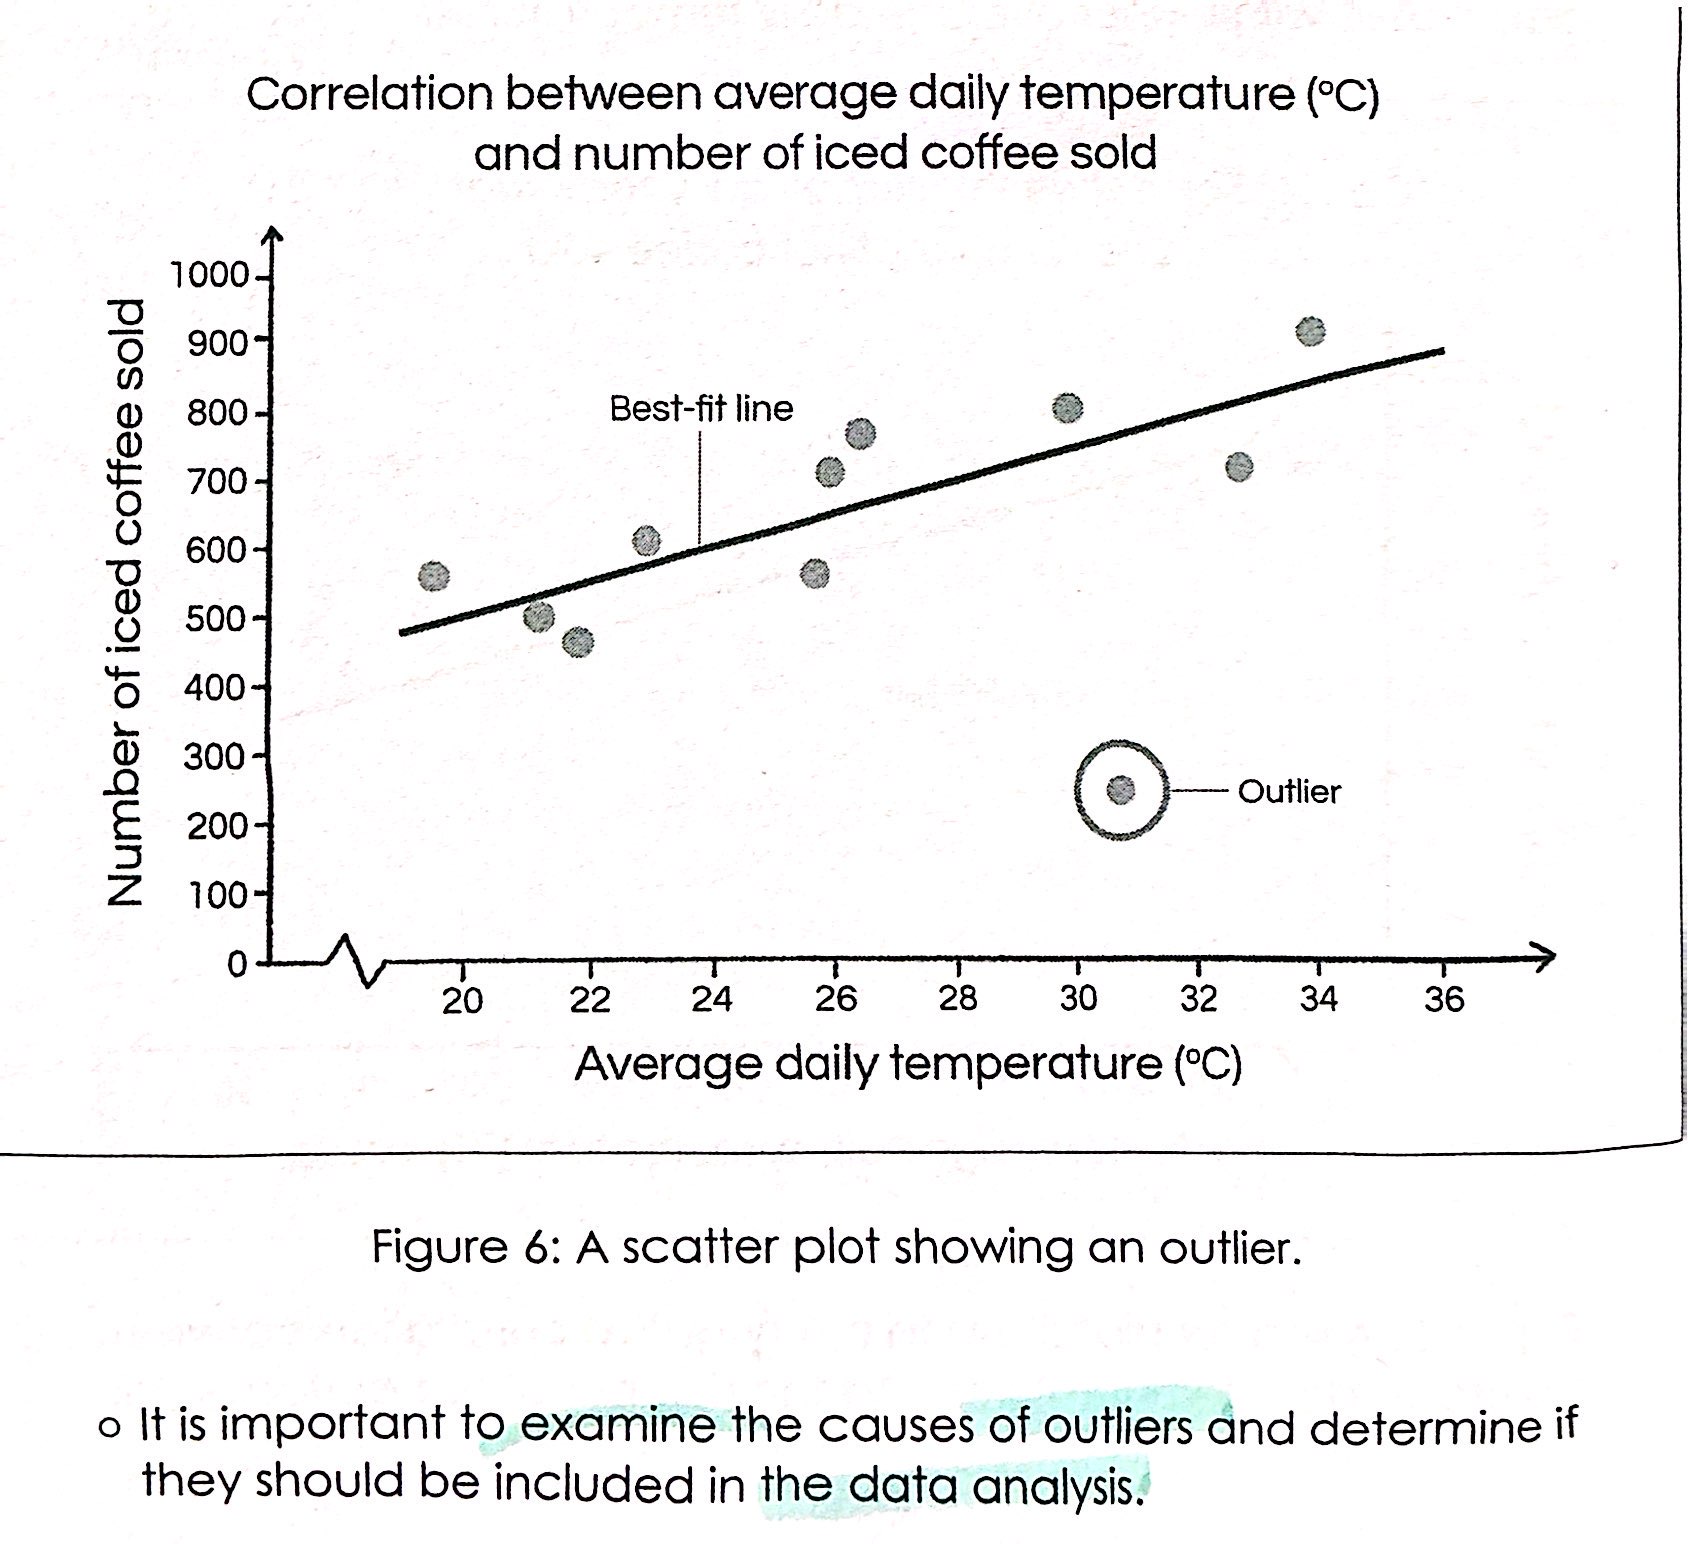
Scenario 4
no correlation
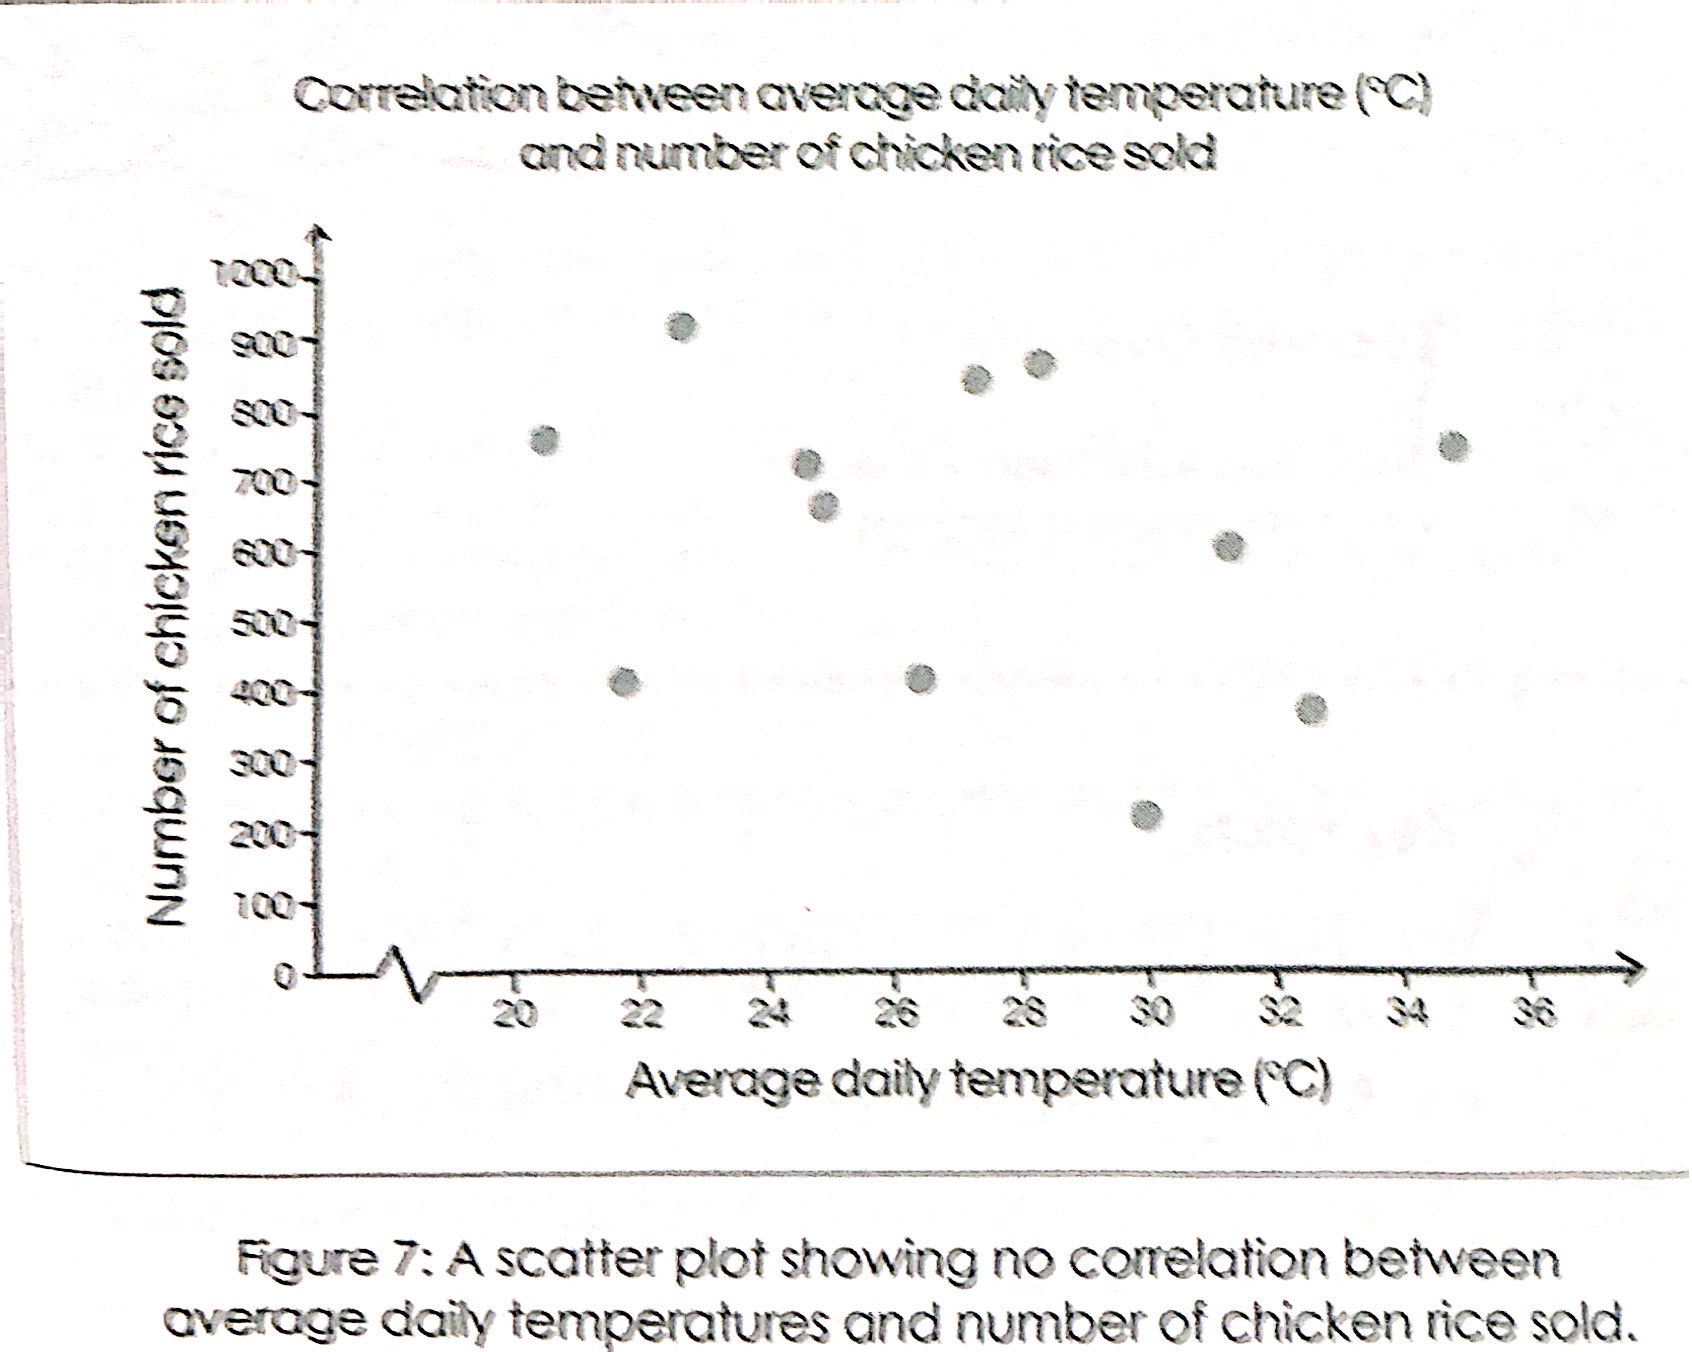
How are patterns and relationships from recognisable geometric shapes, clusters and repetitions identified?
Analysing differences and similarities between recognisable shapes, clusters, and repetitions
Common approach → finding what’s common or popular among participants (e.g., counting no. of times each place is labelled or drawn on mental maps)
Repetitions or clusters of labeling. shapes and drawn features in a mental map may → indicate the popularity and prominence of the places
Absence could indicate unfamiliarity and a lack of interaction within the space
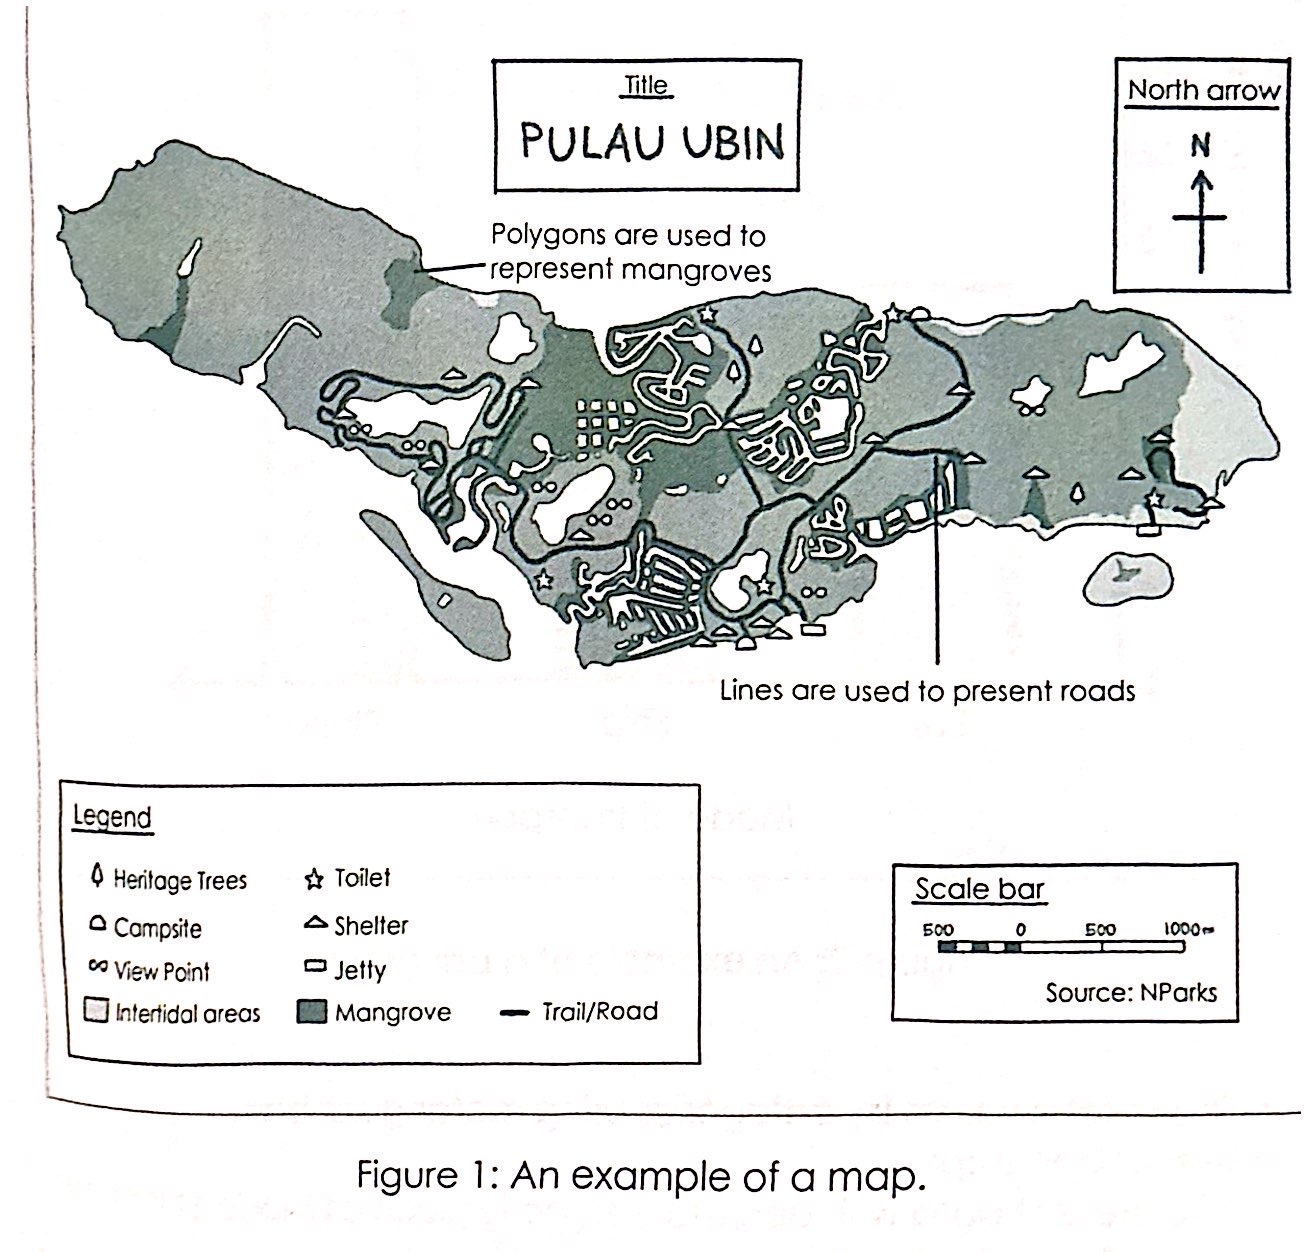
How are findings presented with maps?
visual representations of real-world spatial information via symbols
most map symbols are essentially different variations of dots, lines, and polygons:
dots → discrete features, e.g., a tree/ a shop
lines → roads or other continuous features
polygons → boundaries, e.g., parks / schools
Consists of essential elements such as:
Title → detail about the map’s content, e.g., data source and year mapped
Orientation → usually aligned with the compass arrow pointing towards the North
Scale → help readers understand map’s relative size and distance
Legends → explains the symbols used and contains additional data, e.g., source of the data and date the data was collected
Author and Source(s) → mapping data and the biases inherent in them makes it possible for readers to gauge the reliability of the information and to explore the data further if necessary
How are findings presented on graphs?
Before choosing one of these 3 graphs:
1) Bar Graphs
2) Pie Charts
3) Line graphs
consider:
the type of quantitative data
how the graph could meaningfully communicate findings
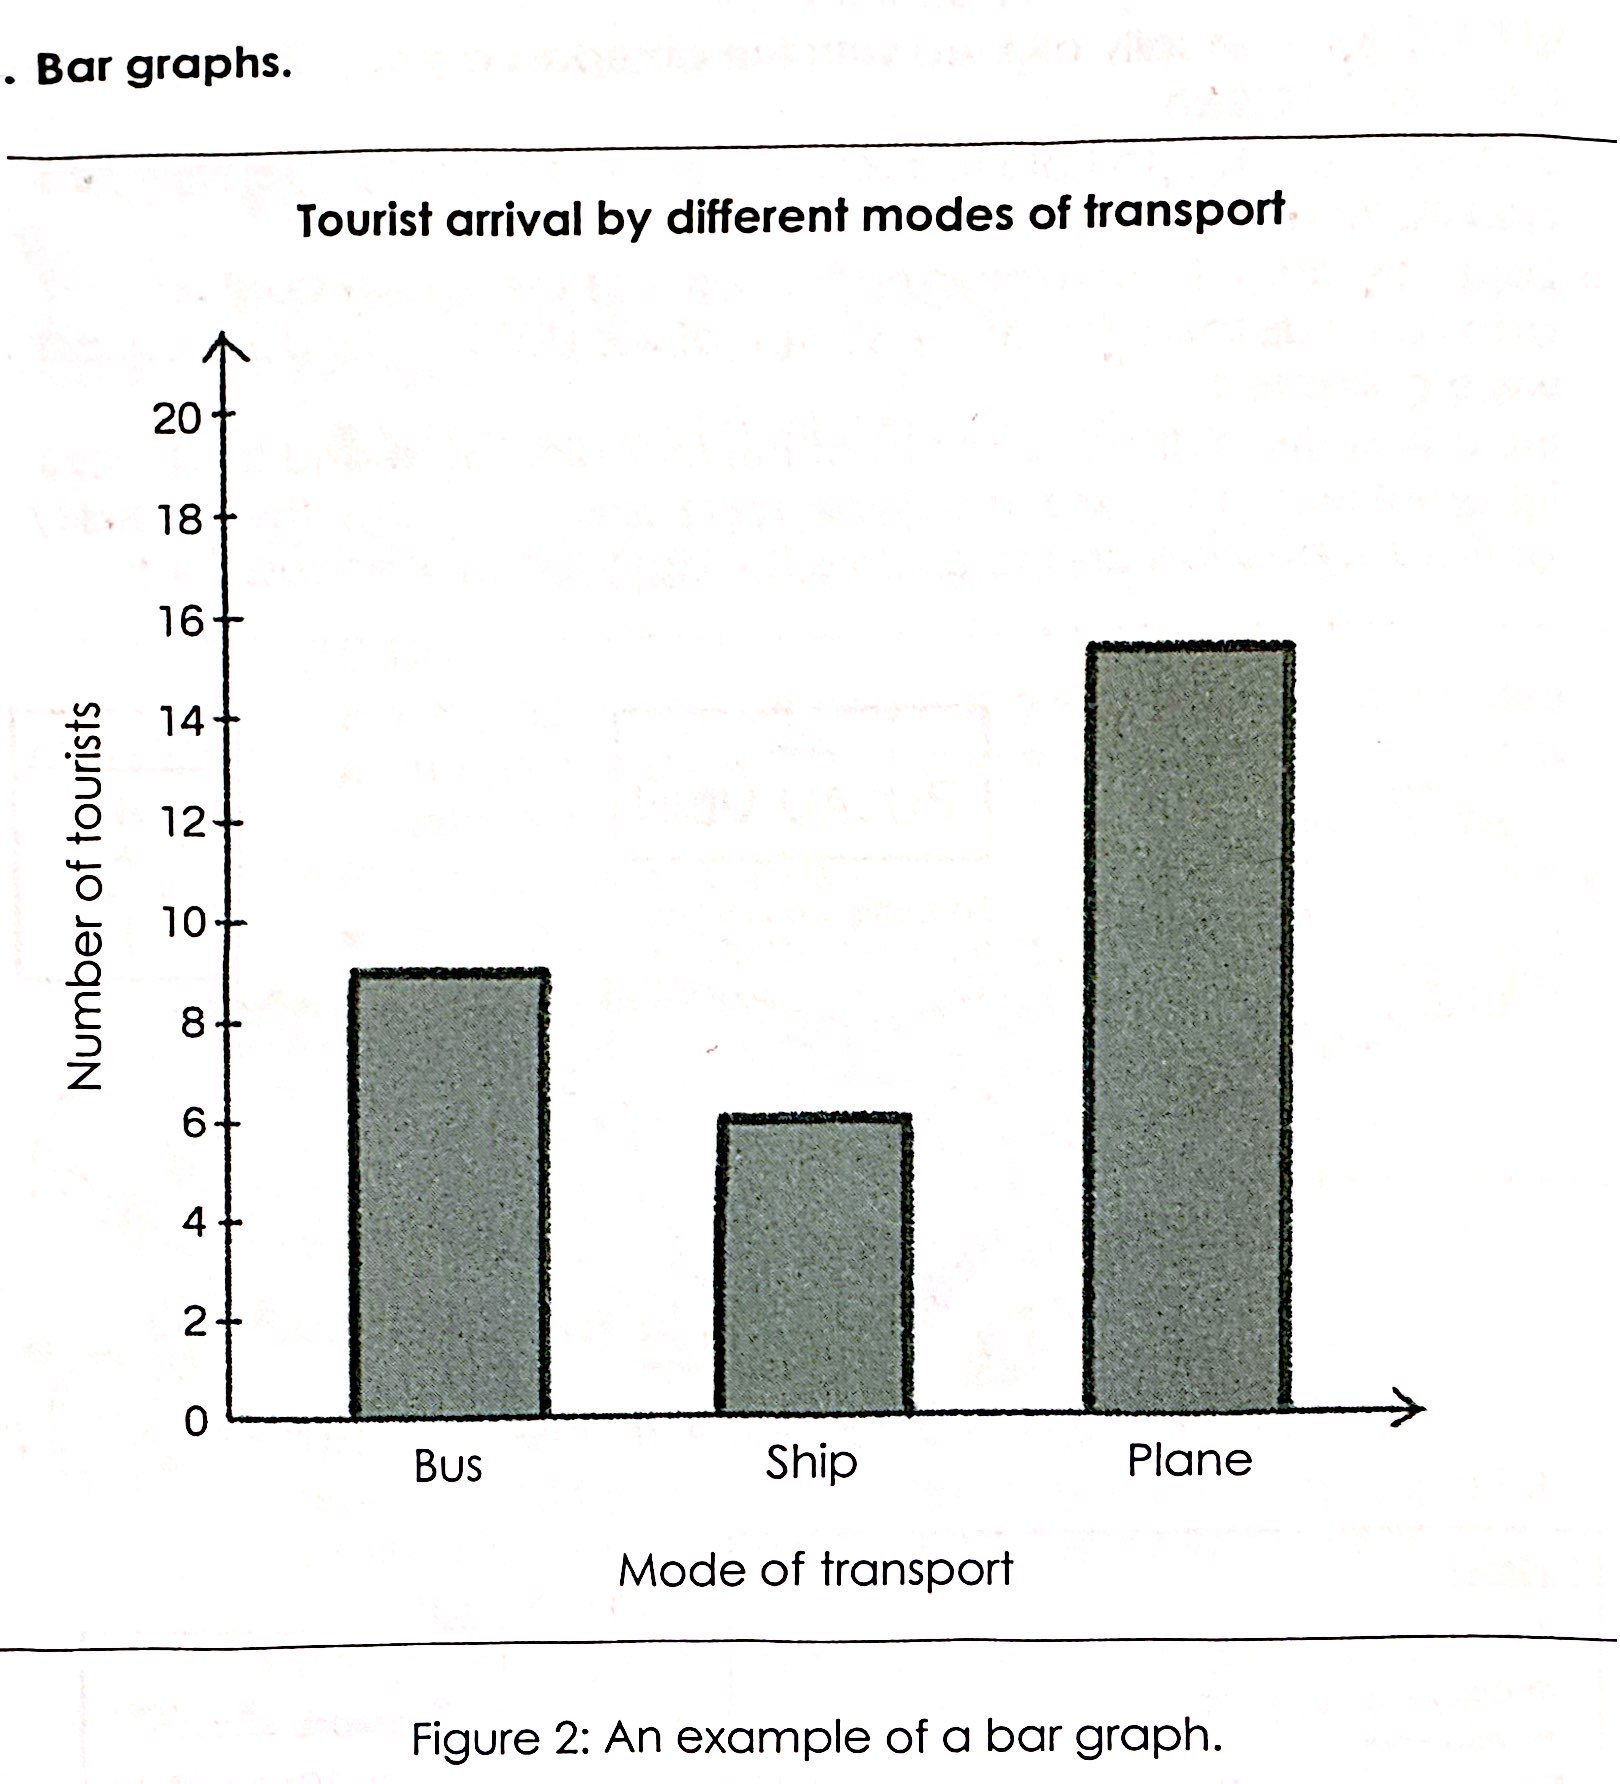
How are findings presented on bar graphs?
Bar Graphs
shows total values by categories via rectangular bars
Uses:
present data with discrete categories
compare data between different categories
How are findings presented on pie charts?
Pie Charts
shows categorical data in the form of a circular graph
Uses:
shows percentage or proportional data
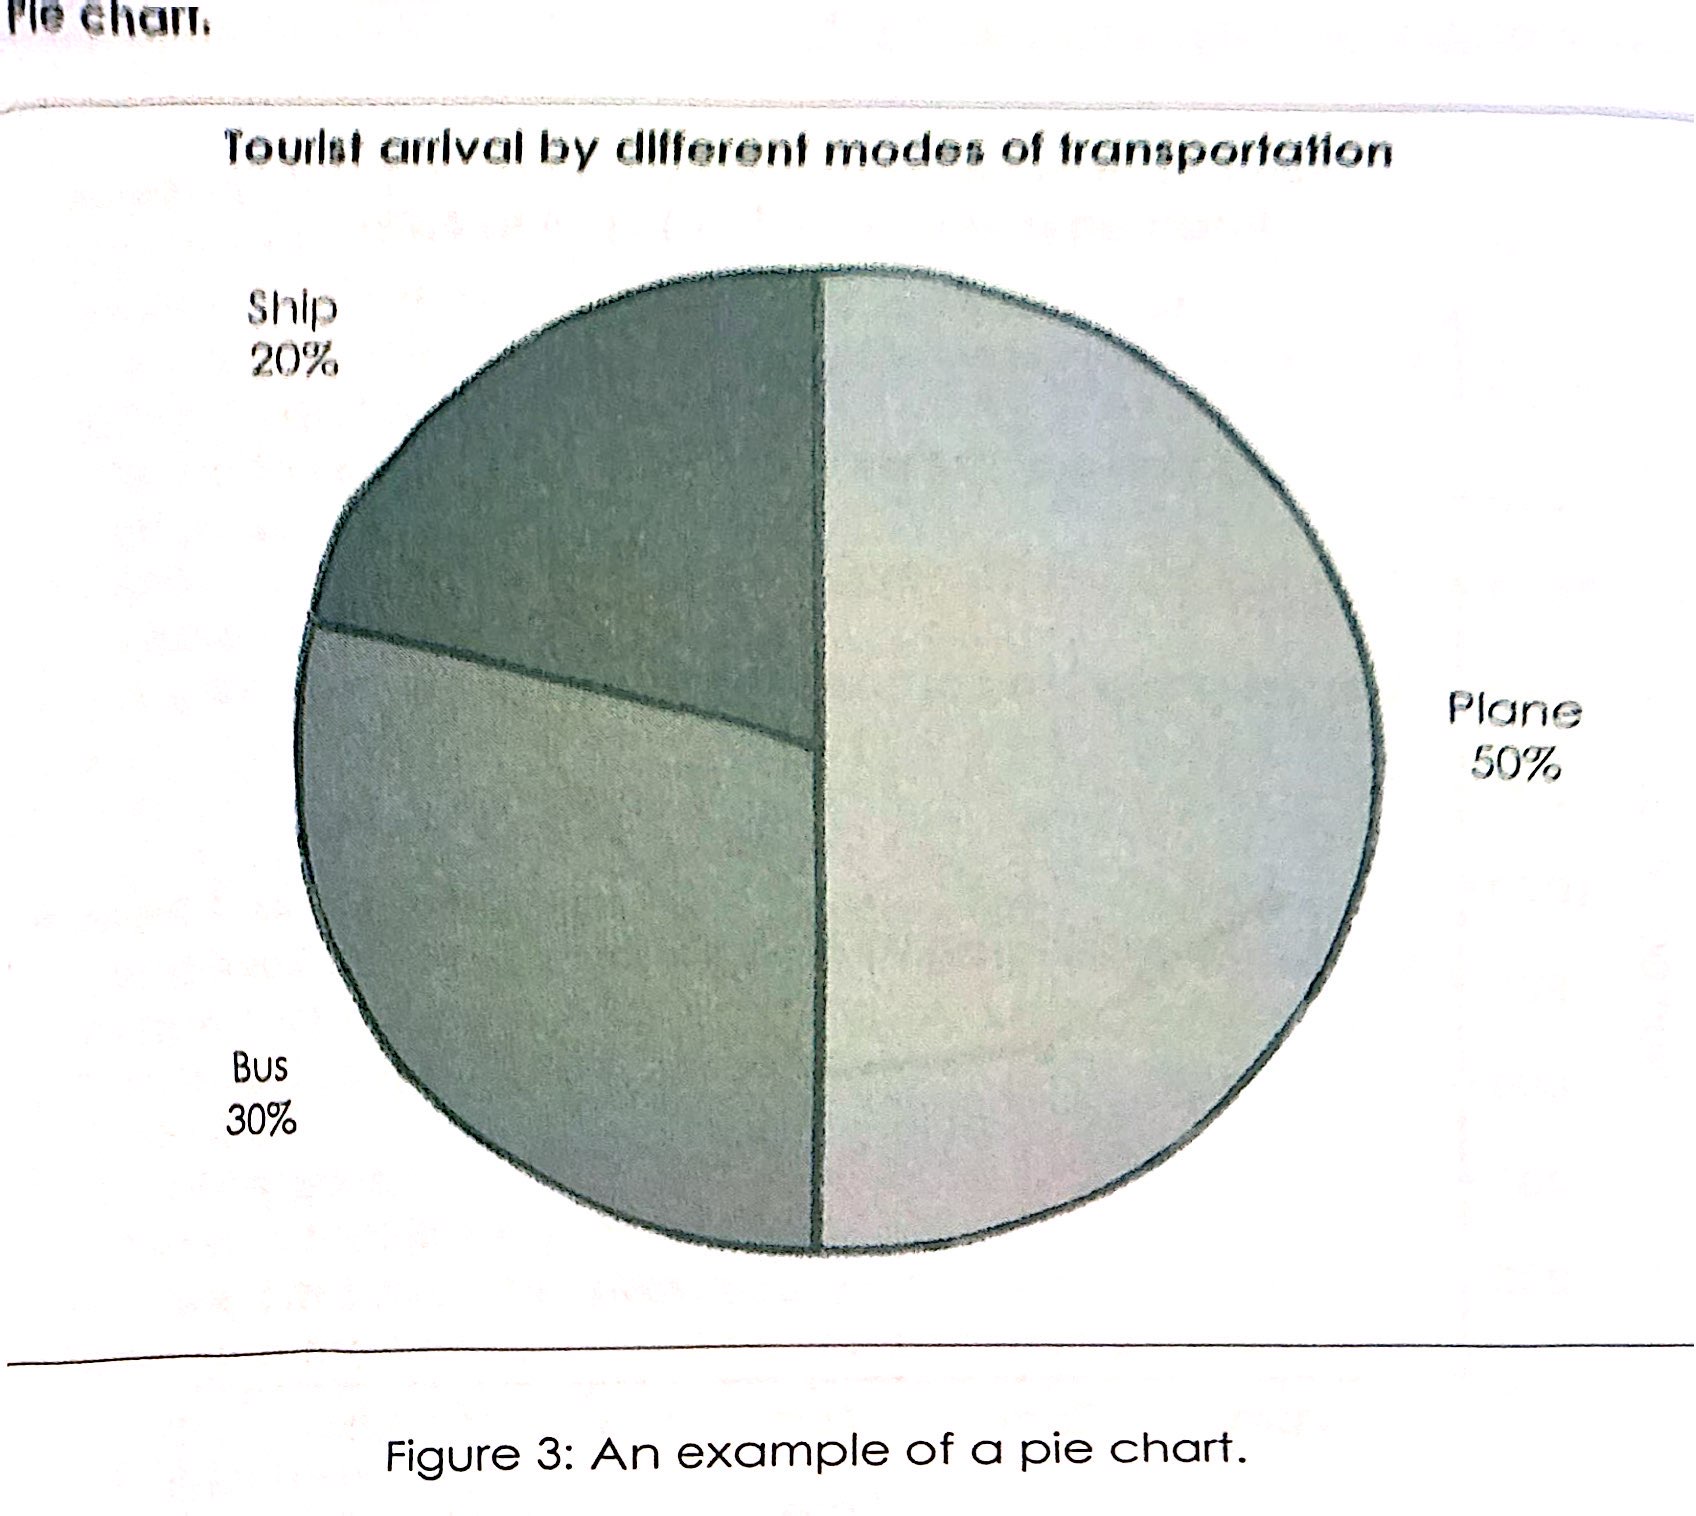
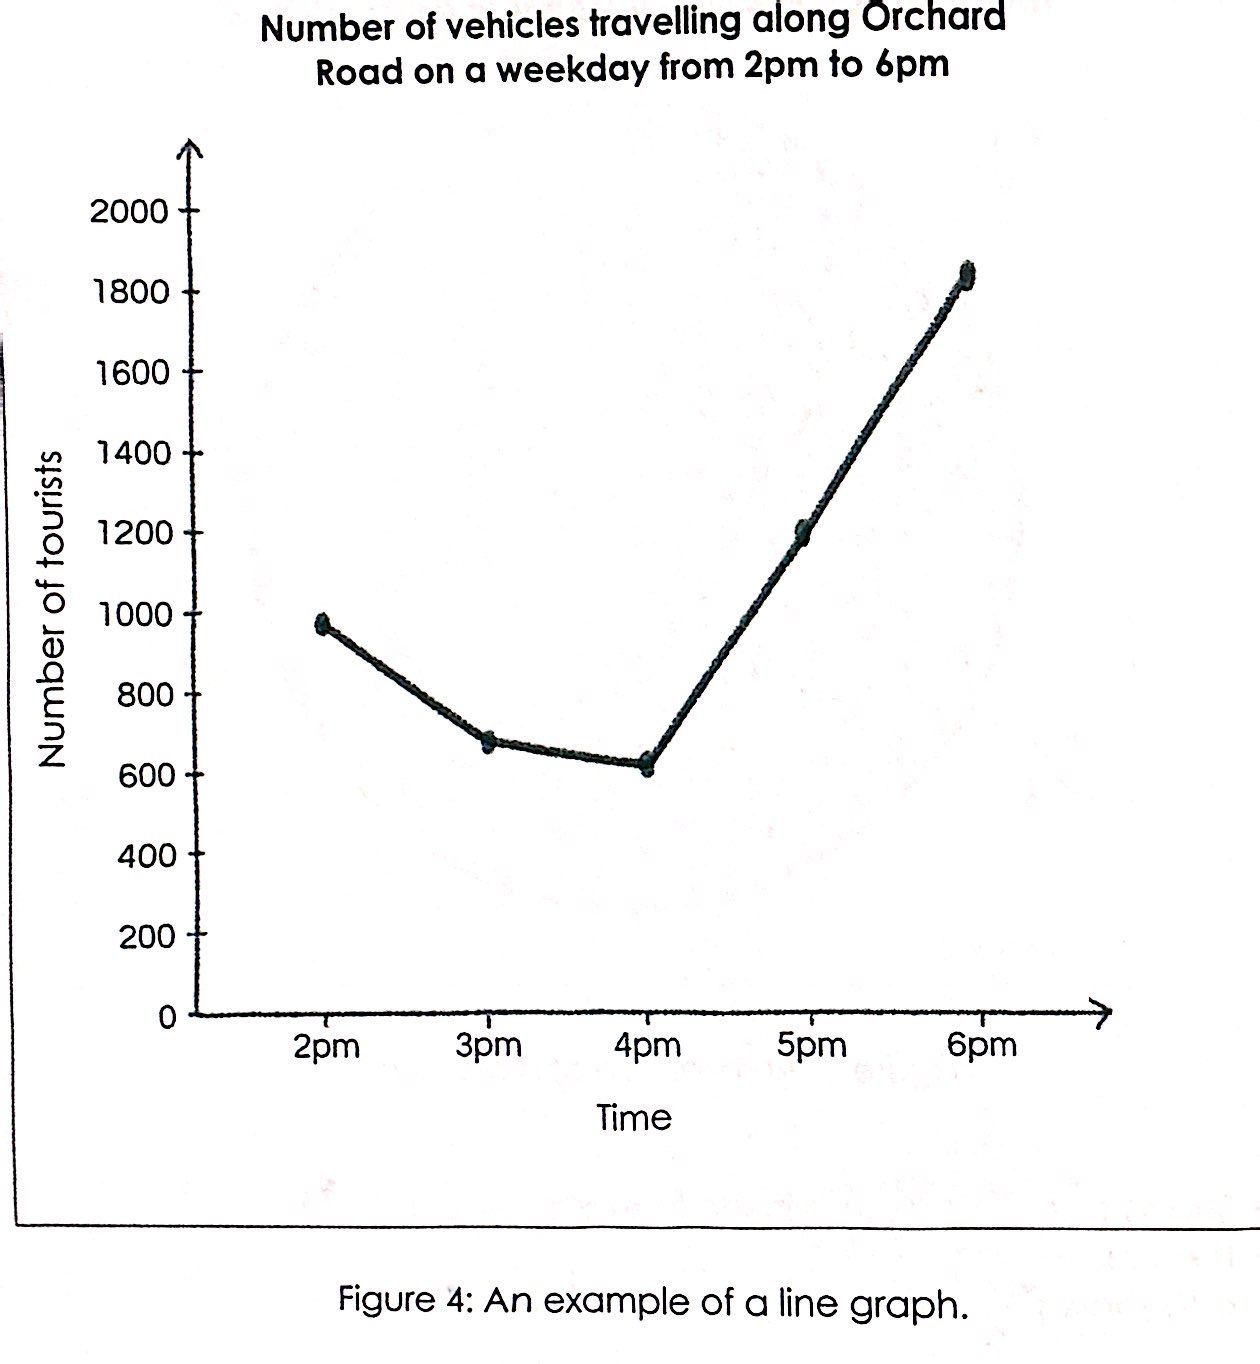
How are findings presented on line graphs?
Line Graphs
shows data that continuously changes over time using lines
trends and relationships between variables are shown by:
upward lines → increasing trends
downward lines → decreasing trends
gradient of best-fit lines
Uses:
show trends over time
present continuous data
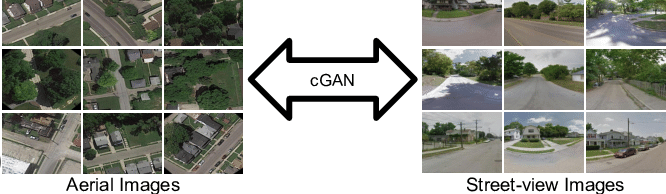
How are findings presented using photographs?
Photographs
inclusive of satellite and aerial images
used to present findings with spatial information
taken from different orientations = different POVs
ground-level images → detailed part of an area
aerial images → spatial distribution over the whole area
Processed satellite images → useful in presenting spatial distribution of phenomena
How are findings presented using text?
Text
qualitative data
often present researchers with unique challenges of interpretation and representation
Inclusive of:
Letters
Oral Histories
Transcript of Interviews
Other rich sources of secondary information
2 common approaches to present findings via text:
Colour-coded annotations
Word Clouds
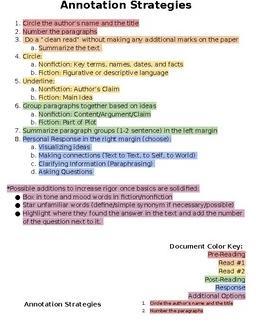
How are findings presented using colour-coded annotations?
Colour-coded Annotations
easy for researchers to lose sight of what they are reading when analysing large bodies of texts
useful in analysing and presenting qualitative data
E.g. An interview transcript with colour-coded annotations about healthy foods can show 3 different colour codings:
Yellow = adult food
Green = children food
Blue = reasons for their behaviour
The uses of colour and its accompanying meanings help to analyse the data and communicate findings
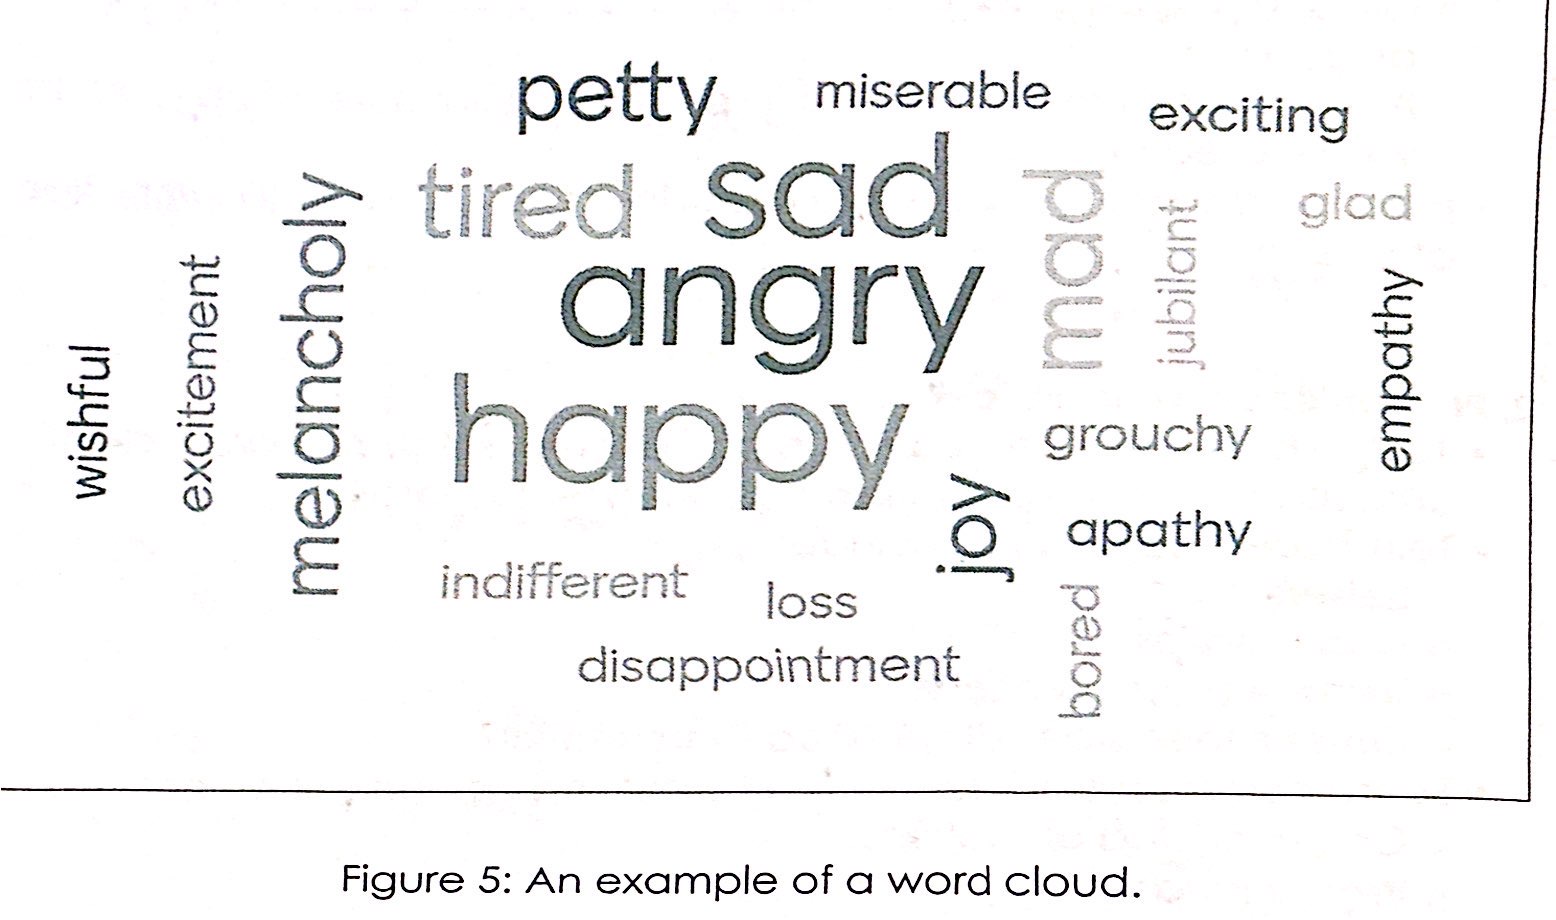
How are findings presented using word clouds?
Word Clouds
sometimes it’s difficult to recognize the most important points in text-based data
word clouds used to present the more important points
bigger and bolder words = the more often it’s mentioned within a given text → greater importance
How to evaluate the reliability of data collection method?
Site
repeat data collection over multiple sites, not just 1 or 2
Time
repeat data collection across different timings within a day and a year
Day
repeat data collection over different days of the week, including weekends
Sampling Methods
ensure a suitable method is used
Probability Non-Probability
1) simple random 2) convenience
3) stratified random 4) quota
Sampling Size
at least 30
large enough for the data to be representative of the overall population
What are some examples of the evaluation of reliability of data collection method?
Reliable:
Sample size is large enough to be representative of the opinions of residents in the neighbourhood → 80 residents were interviewed
Data collection was carried out over 5 sites, which are spread throughout the park → sufficient to be representative of the cleanliness condition @ the park
Simple random sampling method was used to pick samples → removing the bias of a student’s own selection
Unreliable:
Sample size of 10 respondents is too small to generalise what 1000 Deyians think about canteen improvements
Data collection was carried out only on 1 weekday → misses out on people who visit the sports park on weekends
How to improve?
1) Increase no. of sites/ days/ timing
2) Ensure data is collected on both weekdays and weekends in order not to miss out on representative groups of people
3) Use probability sampling methods while ensuring sample size is large enough
How to evaluate how well the data supports the hypothesis?
Data
does the majority of data support the hypothesis or not
Evidence
does the answer support the hypothesis or not
E.g., Supports
Yes, the data supports the hypothesis because…
(state data; From fig 2.1,…)
(provide evidence)
How to evaluate the validity of findings/conclusions?
Data
does data answer the research question/ hypothesis
provide evidence
Method used for collection of data
are the survey questions/ mental maps appropriate for the investigation
are there limitations in the types of data used
Reliability
day
site
time
sampling method
sampling size
What are some examples of evaluating the validity of findings/conclusions?
Valid:
The questionnaire captured the inputs of both variables in the hypothesis
e.g., Q1 asked for the age of the respondents, while Q2 asked respondents how many times they recycle a week
The questionnaire features >1 Qn about what respondents can do about recycling → reliable data
e.g., Q3 asks respondents about the locations of recycling facilities in the neighbourhood and Q4 asks them to identify the types of recyclables
Invalid:
sample size of 20 respondents in each age group is too small → can’t generalise whether other Singaporeans in that age group recycle
questionnaire survey was only carried out on Wednesday mornings
responses of working adults and students aren’t captured
What are the aspects of validity and reliability?
Validity:
Analysis of Data - does the data answer the hypothesis/ research question + provide evidence
Data Collection Method
are the survey questions/mental maps appropriate?
are there limitations in the types of data used?
Consider the 4 aspects of reliability
Reliability:
Sampling method
Day
Time
Site
What is development?
The economic, social, and political process→ improvement of the standard of living for a population
Measured via:
{economic} Gross Domestic Product, GDP, per capita
{social} Life Expectancy
{social} Adult Literary Rate
What is sustainable development?
Development that meets the needs of the present population→
achieving high standards of living for all
ensuring the ability of future generations to meet their own needs
3 Key Aims: Economy, Environment, and Society
How can urban neighbourhoods achieve economic sustainability?
Ensuring a neighbourhood has a high population density→ support local businesses and to keep transport and infrastructure costs low
Local businesses can sustain themselves as there’s sufficient demand for their goods and services
Residents can take up employment there→ earn an income→ higher standard of living
Schools located near integrated transport hubs→ students opt to walk to sch instead of public transport→ transport costs low
Buildings and objects usually located near each other→ residents need not travel far→ transport costs low
Transport infrastructure may be located closer to one another, so connecting infrastructure is not needed to be built (over long distances) → cost to develop transport infrastructure kept low
How can urban neighbourhoods achieve social sustainability?
Ensuring residents feel included and have a sense of shared identity:
fostered by having shared community spaces→ promote regular social interactions
small population size in urban neighbourhood→ facilitate regular interactions amongst residents→ residents may come together to discuss issues regarding their neighbourhood→ providing solutions to their challenges → builds resilience and positive relationships between residents→ maintain a culture of open communication, mutual respect and understanding→ reducing misunderstandings and conflicts
ie, Resident’s Network (RN) was set up to promote neighborliness and community cohesiveness amongst residents: Each neighbourhood is divided into smaller designated zones where regular activities are organized at zonal level; catering to small population size in the zone→ encourages residents to voice their opinions and participate in decision-making processes regarding issues affecting their neighbourhood
How can urban neighbourhoods achieve environmental sustainability? (1/3)
Ample Protection for Nature
wildlife can thrive in our urban spaces→ fostering human-wildlife coexistence
concentrated efforts should be made to protect existing native species, habitats and ecosystems + re-establish extinct species
maximise biodiversity in urban neighbourhoods→ wide variety of habitats (pocket parks, roof gardens) instead of one large patch of uniform grass
plant and tree species in an area should vary→ adequate shelter and food for a wider variety of wildlife to thrive
How can urban neighbourhoods achieve environmental sustainability? (2/3)
Having facilities that support waste minimisation and recycling:
locate convenient recycling facilities (blue bins) around estates→ encourages residents to recycle
high population density in a neighbourhood→ adequate waste collected and recycled in an economically viable manner
recycling can be encouraged through recycling activities organised by residents or town council
How can urban neighbourhoods achieve environmental sustainability? (3/3)
Energy and water-efficient design approaches for buildings and landscapes:
minimise the use of resources
smart technology and eco-friendly features can be installed;
(a) Cool Paint→ lowers temperatures by up to 2°C → reducing energy consumption
(b) Water harvested from rain is used for block washing→ reducing overall water consumption
Why are urban neighbourhoods regarded as ecosystems?
1) ecosystems consist of living communities and the non-living environment interacting with one another
2) aquatic and terrestrial ecosystems in neighbourhoods including ponds, lakes, parks and forests
ie. A man-made concrete canal in Bishan AMK park was transformed into a naturalised river, allowing more organisms to thrive in the aquatic ecosystem→ brought back wildlife back into the park→ enhancing the neighbourhood’s biodiversity
This shows that;
(a) activities carried out by people may directly/indirectly change the ecosystems in both positive and negative ways
(b) every aspect in ecosystems depends on one another directly/indirectly
What are ecosystem services?
The benefits brought about by nature to people→ critical to humans’ survival→ optimised when natural environment is healthy and thriving
They consist of;
1) Provisioning services
2) Regulating services
3) Cultural services
4) Supporting services
What are provisioning ecosystem services?
Tangible resources that people obtain from ecosystems like food, water, and wood
Food is one of the most important provisioning services provided by nature→ obtained through agriculture and fisheries
ie, Food is grown in urban community gardens where edibles are planted on HDB rooftops
What are regulating ecosystem services?
Benefits obtained from the regulation of various ecosystem processes (climate, disease outbreak, and flood regulation):
these processes work together→ ensure ecosystems are clean, functional, sustainable, and resilient to changes
in an urban neighbourhood (ie, Bishan-AMK):
(a) microclimate regulation
trees provide shade → lowering air and surface temperatures
forests cool areas → generating rainfall
(b) flood mitigation
vegetation cover reduces surface runoff→ retains water in the soil (water flow regulation)
a key service provided by natural land cover
(c) air and water quality control
trees and plants regulate air quality→ remove pollutants from the atmosphere
What are cultural ecosystem services?
Intangible benefits people obtain from ecosystems (aesthetic experiences, educational opportunities and recreational activities)
In an urban neighbourhood:
green spaces→ 1) aesthetic appreciation
2) stress-relieving activities
May improve people’s mental and physical health
Fosters social belonging and group identity
ie, heritage trees, skyrise greenery, community Gardens
∴ Sense of place strengthened
ie #2, Bukit Timah Nature Reserve→ recreational activities like hiking + educational opportunities like fieldwork for geog students
What are supporting ecosystem services?
Services necessary for the functioning of all other ecosystem services ( +soil formation, pollination and photosynthesis)
(a) Soil Formation
soil is essential for the health of all terrestrial organisms:
1) provides habitats for billions of organisms
2) contributes to biodiversity
3) acts as a water filter
Ensures human activities like agriculture can occur
(b) Pollination
wild bees are vital for crop pollination→ ensure that crops can reproduce to provide food for animals and humans
(c) Photosynthesis
plants absorb CO₂ and release O₂ → maintains O₂ content of the Earth’s atmosphere
∴ All other ecosystem services can function
What are fire hazards that occur in urban neighbourhoods?
Caused by:
unattended cooking
faulty electrical appliances and wiring
∴ igniting nearby flammable materials → fire
Ex. (1) In 2021, there were 358 cases of fire due to unattended cooking in SG
(2) There has been an increase in fire cases involving PMDs (personal mobility devices)
What are the impacts of fire hazards?
1) Health Impacts:
Burn Injuries → inability to evacuate in time → possible disabilities or deaths
Smoke Inhalation → breathing difficulties + suffocation → possibly fatal
Irritants from fire → acid gases → damaging a person’s respiratory system
High levels of CO₂ and CO released during a fire → CO poisoning → weakness and confusion → potential loss of consciousness and death → hindering people’s ability to escape a fire
2) Property Damage:
Destruction of properties; goods, furniture, and important documents → economic losses
Further costs are incurred → more money is required to repair and rebuild the properties
What are air pollution hazards that occur in urban neighbourhoods?
Caused by:
Burning Vegetation
CO₂ + other pollutants released into the atmosphere → air pollution
Industrial and Motor Emissions
increase in car ownership and usage → vehicles produce more exhaust emissions like CO + other pollutants → increase in air pollution
What are the impacts of air pollution hazards?
1) Health Impacts
respiratory infections
heart diseases
lung cancer
Production of pollutants (a) PM 2.5 and (b) NO₂ in an urban neighbourhood {congested areas} → poor health
PM2.5 can enter the bloodstream → lodging deep in human lungs → lung function declination
Exposure to high levels of NO₂ → higher risk of asthma in children
What are the traffic hazards that occur in an urban neighbourhood?
Caused by:
Speeding
Red-light Running
Drink-driving
∴ done by irresponsible motorists who put road users and themselves at risk
What are the impacts of traffic hazards?
1) Health Impact:
should there be a traffic accident → people suffer from serious injuries → potential disabilities or deaths
What is environmental stewardship?
(FYI) It is the actions taken by varying stakeholders to protect, care, and responsibly use the environment to pursue environmental and or social outcomes
Actions taken (govt, people, organizations):
[C] onserve natural resources
[P] reserve natural environment
[R] epair damages and negative impacts caused by humans
Achieved via 2 Ways:
(1) Promoting Volunteerism among Residents
(2) Partnership of Public and Private Sectors
How is environmental stewardship achieved? (1/2)
1) Promoting volunteerism among neighbourhood residents to share knowledge with others about the importance of healthy ecosystems
increases awareness among residents of what can and should be done to responsibly use and protect the natural environment
Ex. The National Parks Board (Nparks) promotes volunteerism in communities through initiatives such as:
(a) Friends of the Parks → participants gain greater stewardship of their park in their neighbourhoods
How is environmental stewardship achieved? (2/2)
2) Partnership of public and private stakeholders
Different stakeholders = different POVs, resources and expertise → crucial to come together to steward the environment
Ex. In SG, urban neighbourhoods produce tons of waste → residents and public and private sectors must all play their roles in the efficient and sustainable waste recycling process
[RESIDENTS] Ensure they recycle their waste properly
[PUBLIC] National Environmental Agency (NEA) → educates residents → raising awareness of waste recycling and proper recyclables
[PRIVATE] Provision of recycling facilities
∴ via this partnership, environmental stewardship efforts can be enhanced and sustained
What is disaster risk?
(FYI) It refers to the likelihood of damage to properties, injuries and fatalities from a disaster in a given period of time
It is the product of the interaction between 3 factors:
(1) Nature of Hazard
characteristics of the hazard
(2) Vulnerability
conditions (physical, social, economic, environmental) that increase the susceptibility of people and their belongings to the impacts of hazards
(3) Exposure
situations of people and their belongings located in hazard-prone areas
What is disaster risk management?
(FYI) It refers to plans and actions that are implemented to prevent new risks from happening, reduce existing risks and manage disaster risks
∴ strengthens community resilience
The 4 aims of disaster risk management:
(1) Reduce Neighbourhoods’ Exposure to Hazards
(2) Reduce the Vulnerability of People and Properties to Hazards
(3) Improve Residents’ Emergency Preparedness in Responding to Hazards
(4) Implement Monitor and Warning Systems
How is disaster risk management practiced? (1/4)
(1) Reduce Neighbourhoods’ Exposure to Hazards
Eg. Singapore Civil Defence Force (SCDF) is the main agency which responds to disasters
Town Councils must cooperate with other government agencies in (a) securing public safety and (b) preventing disease or injury
How is disaster risk management practiced? (2/4)
(2) Reduce the Vulnerability of People and Properties to Hazards
eg. Singapore Civil Defence Force (SCDF) is the main agency which responds to disasters
Town Councils must cooperate with other government agencies in (a) securing public safety and (b) preventing disease or injury
How is disaster risk management practiced? (4/4)
(3) Improve Residents’ Emergency Preparedness in Responding to Hazards
eg. SCDF conducts a Community Emergency Preparedness Programme (CEPP), teaching people key lifesaving skills and important emergency procedures
How is disaster risk management practiced? (4/4)
(4) Implement Monitor and Warning Systems
eg. SCDF has a public warning system (PWS) which warns the public of imminent threats which endanger lives and properties such as natural and man-made disasters
What is community resilience?
(FYI) It refers to the ability of a community to resist, adapt to and recover from the impacts of disasters in a timely and efficient manner
It is developed by:
(1) strengthening relationships among residents and raising their awareness of potential hazards
(2) developing residents’ ability to organise themselves and equip themselves with resources to resist, adapt and recover from a disaster
How is community resilience achieved? (1/2)
1) Strengthening of Relationships among Residents and Raising their Awareness of Potential Hazards
disaster risk management plans may only be effective and sustainable if there is widespread support and long-term participation from residents
residents are encouraged to know their neighbours → depend on one another during an emergency
Eg. In SG, the People’s Association (PA) organises varying community activities (active ageing, community sports, emergency preparedness) → bringing people of different backgrounds and ages together → fostering positive relationships amongst residents
During COVID, residents came together to help those in need via mask and food distribution
How is community resilience achieved? (2/2)
2) Developing Residents’ Ability to Organise and Equip Themselves with Resources to Resist, Adapt, and Recover from a Disaster
Stakeholders involved in projects to minimise potential hazards include → residents, community leaders, civil society organisations and the government
residents are involved as when they actively participate in these projects, they better understand the risks and adaptation options to communicate to the government and planners.
Eg. (For country) In SG, the total defence framework is an all-round response to threats and challenges involving everyone in SG → emphasizing that everyone has a part to play, individually and collectively → building a strong, secure and cohesive nation
(For residents) Community First Responders (CFRs) volunteers help the government in search and rescue operations, relief work as well as educating the public on first-aid and basic firefighting
They also put out bin fires when alerted within their vicinity → optimises SCDF emergency resources → enabling SCDF to attend to higher-priority and life-threatening cases
How do people depend on nature? (1/3)
Provides essentials like air and water
How do people depend on nature? (2/3)
Animals like bees pollinate crops for continuous supply of food
How do people depend on nature? (3/3)
Provides space for recreation and leisure activities → enables people to bond with family and friends, maintaining physical and mental well-being
How does nature depend on people? (1/2)
Tends to the health of nature areas, ensuring plants and animals thrive there
How does nature depend on people? (2/2)
People encourage each other to enjoy nature areas sustainably without causing damage
What are the benefits that nature brings to people? (1/3)
Lowering air temperature: presence of vegetation→ shade→prevents sunlight from reaching the surface
Vegetation also cools the surrounding air via evapotranspiration
What are the benefits that nature brings to people? (2/3)
Removal of pollutants: via photosynthesis→ improves air quality through leaves intercepted and wetland plants absorbing excess nutrients
What are the benefits that nature brings to people? (3/3)
Provision of recreational spaces: opportunities for outdoor activities, improving the well-being of humans
What are the benefits that people bring to nature? (1/2)
Collectively raise awareness about the value of nature areas via encouragement of positive behavior
What are the benefits that people bring to nature? (2/2)
Organizing and participating in conservation efforts
What are the disadvantages that people bring to nature? (1/3)
Soil erosion: hiking along non-designated trails → trampling and damage of vegetation
What are the disadvantages that people bring to nature? (2/3)
Worsening pollution and disturbing wildlife: Littering: Animals can get hurt and entangled by the litter→ mistaking it for food and consuming it→ could be fatal
What are the disadvantages that people bring to nature? (3/3)
People may feed animals→changing the behaviors and habits of wildlife→ animals will associate food with humans→ increased conflicts between people and wildlife
What are the disadvantages that nature brings to humans? [Why encounters increase] (1/3)
Increased human-wildlife encounters, which lead to increased conflicts: Urban expansion in SG → natural habitats shrinking→ wildlife may venture out of nature areas in search of food and shelter
People are spending more time in nature areas
SG aims to bring nature back into the city, thus promoting the encounters
What are the disadvantages that nature brings to humans? (2/3)
Uneducated people not knowing how to handle wildlife→ unintentional provoking of animals→ attacks