AP Econ unit 5
1/23
Earn XP
Name | Mastery | Learn | Test | Matching | Spaced | Call with Kai | Chat |
|---|
No analytics yet
Send a link to your students to track their progress
24 Terms
the phillips curve
shows the trade off between inflation & unemployment
short run & long run phillips curve graph
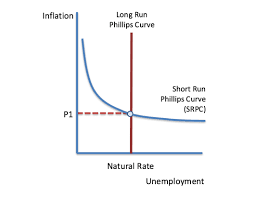
when AD increases…
SRPC moves left to new point on curve NO SHIFT
(aka AD up → inflation up & unemployment down)
opposite occurs when AD down
When AS shifts…
SRPC shifts in the opposite direction
the expected inflation rate at any point on the SRPC when a loan was given out =
the inflation rate at the equilibrium on the graph
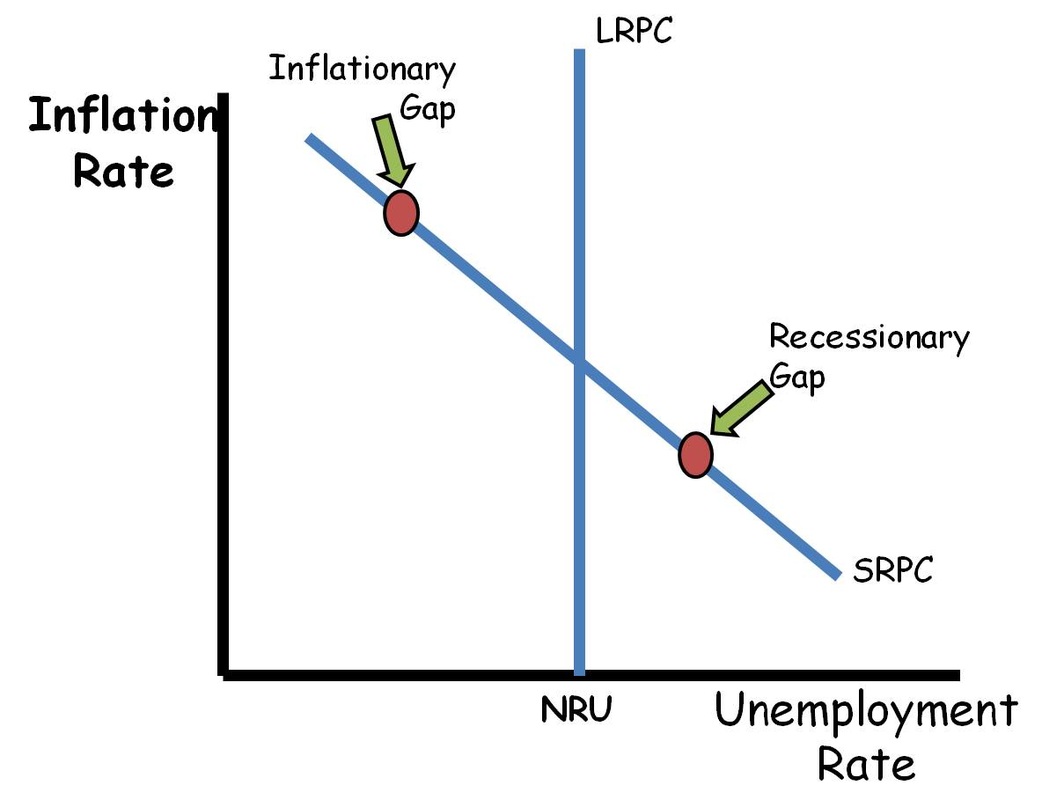
SRPC with a recessionary/inflationary gap graph
Quantity Theory of Money
M * V = P * Y
P=
price level
m=
money supply
v=
velocity
y=
output (GDPR )
Assumptions:
velocity is relatively constant because people’s spending habits are not quick to change
Output (y) is not affected by the quantity of money because it is based on production
velocity definition
the average # of times a dollar is spent & re-spent in a year
neutrality of money
changes in money supply only affect nominal variables not real production changes
money printed by a government alone will impact inflation but not output
the federal budget
=tax revenues - gov purchases - gov transfers
entitlement spending
federal programs that require payments to any eligible person based on age/income/disability
MUST be paid
trade off for deficit spending is…
crowding out
growth rate
the change in GDPR per capita over time
Productivity characteristics
physical capital (aka capital stock)
human capital
technology
economic system
rule of law
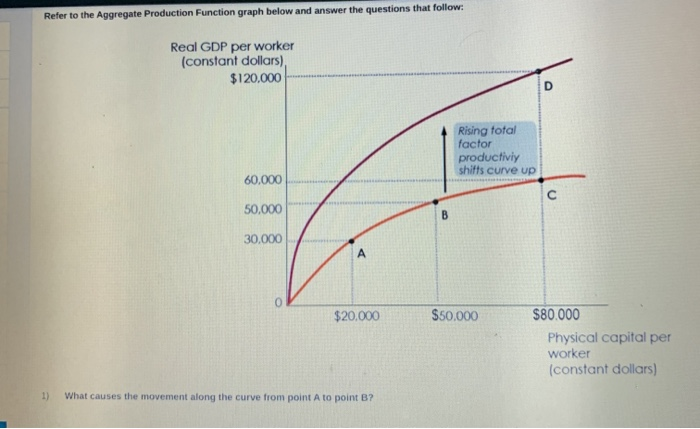
aggregate production function graph shows…
quantity of physical capital/worker
quantity of human capital/worker
state of technology
aggregate Production function graph
gov policies most likely to result in long run economic growth
education/training spending
infrastructure spending
production/investment incentive programs
supply-side fiscal policy
gov policies designed to increase production by reducing businesses’ taxes and/or regulations
why is supply-side fiscal policy controversial
providing tax breaks to businesses might disproportionately benefit the wealthy
it assumes corporations will spend tax cuts on investment rather than payout shareholders.