CC1 PART 1
 Call Kai
 Learn
Learn Practice Test
 Spaced Repetition
 Match
Match Flashcards
 Knowt Play
1/184

Earn XP
Description and Tags
*No formulas and Units
Name | Mastery | Learn | Test | Matching | Spaced | Call with Kai | Chat |
|---|
No analytics yet
Send a link to your students to track their progress
185 Terms
SI Unit/Metric System Conversions
Move the decimal point by the difference between the exponents either to the right (larger to smaller unit) or to the left (smaller to larger unit) of the number given.
Molarity
number of moles of solute per liter of solution
Molality
number of moles of solute per kilogram solvent
Normality
number of equivalent weights of solute per liter of solution
Equivalent weight
If the solute is expressed in terms of g/dL, multiply it by 10 to convert it into Liters then divide it by the ?
Percent solution
amount of solute per 100 total units of solution; expressed as % w/v, w/w, or v/v
Dilution
done when the analyte concentration is too high and exceeds the detection limit of the method; expression of relative concentration
Dilution of stock solution
done when a weaker reagent concentration is needed than the stock substance available
Ratio
amount of something relative to another; expressed as part per part or part per whole
Valence
the number of hydrogen atoms, hydroxyl, OH units, or the number of electron loss or gain.
Mean (x̄)
Median
Mode
What are the Measures of Center?
Central Tendency
Mean
average or arithmetic mean
In laboratory statistics, mean is commonly used
corresponds to the center in the Levey-Jennings chart or to the center of the gaussian curve.
Median
midpoint of a data set after the values have been rank-ordered
Mode
most frequently occurring value in a data set
Standard Deviation
Coefficient of Variation
Range
What are the Measures of Spread?
Distribution / Variability
Standard Deviation(s)
distribution of data points around the mean; primary measure of uncertainty
Variance (s2)
Summation of the squares of the differences between the mean and its observation divided by the total number of observations minus one degree of freedom
Coefficient of Variation
best indicator of Precision
Expressed in terms of percent (%)
Range
difference between the highest and lowest values in a data set
This is the most unreliable when there are outliers.
Inversely related
Relationship between CV and Precision
Rule of thumb
in general or for most methods: the CV must be less then 10%.
Outliers (1)
values the deviate greatly from the mean
If there is a value that is too far from the mean, that will make the range value a large number, that would not present the distribution for most values.
Gaussian / Normal Distribution
Data points are distributed symmetrically around the mean (bell-shaped curve) with most values close to the center.
Mean, Median and Mode are identical
Follows the empirical rule
Empirical Rule
A data set that displays a normal distribution follows the so-called ___________
If the values are plotted in a graph, and the data set displays normal distribution, 68% of the values will fall in +/- 1 standard deviation. 95% are approximately would fall within +/- 2 standard deviation. And approximately 99.7% of the values would fall within +/- 3 standard deviation
68, 95, 99.7%
The Empirical Rule is:
95% interval
The most commonly used confidence interval is
Reference interval
Verifying a reference interval
Establishing a reference interval
What are Interval Studies?
Reference Interval
pair of medical decision points that span the limits of results expected for a defined healthy population
Verifying a reference interval
done to confirm the validity of an existing or published RI for an analyte
requires at least 20 study individuals; RI is adopted if ≤10 of the subjects fall outside the range
Establishing a reference interval
done when there is no existing RI for an analyte or when transference studies fail
requires at least 120 study individuals; RI is set based on the %Cl = x̄ ± 2s
Precision study
Recovery study
Inferential statistics
Analytical sensitivity
Analytical specificity
Diagnostic Efficiency / Accuracy
What are some Method Evaluation?
Precision study
first step in method evaluation; usually done by running two control materials twice a day over a 10-day period
also known as 2×2×10 scheme
Recovery study
involves spiking a sample with a known amount of an analyte and determining how much of it can be detected by the method in the presence of other compounds in the matrix
T test
UNDER INFERENTIAL STATISTICS:
Compares the means of two groups of data or the accuracy of the two methods
F test
UNDER INFERENTIAL STATISTICS:
Compares the standard deviation of two groups of data or the precision of two methods.
Linear Regression
UNDER INFERENTIAL STATISTICS:
used in comparison-of-methods test and bias studies
quantitative variables
x axis
UNDER LINEAR REGRESSION:
Independent variable; reference method
also shows as Reference Method
AXIS
Abcyssa, X axis, Independent variable, Std / Ref. Method
y axis
UNDER LINEAR REGRESSION:
Dependent variable; test/New method
also shows as Test Method
Slope
UNDER LINEAR REGRESSION:
Change represents Proportional Error
y - intercept
UNDER LINEAR REGRESSION:
Change represents Constant Error
Correlation coefficient (r)
UNDER LINEAR REGRESSION:
Represents the strength of the relationship between the two methods
Analytical sensitivity
ability of a method to detect the smallest concentration of an analyte
Not prone to false negative; desired in screening test
Analytical specificity
ability of a method to detect only the analyte of interest
Not prone to false positive; desired in confirmatory test
Diagnostic Sensitivity
UNDER DIAGNOSTIC EFFICIENCY:
ability of a test to detect a given disease or condition; proportion of individuals with the disease who have a positive test result; desired for conditions that are severe or require immediate treatment
Diagnostic Specificity
UNDER DIAGNOSTIC EFFICIENCY:
ability of a test to detect the absence of a given disease or condition; proportion of individuals with no disease who have a negative test result; desired when the consequences of a false positive result are severe
Positive predictive value
UNDER DIAGNOSTIC EFFICIENCY:
probability that a positive test result indicates disease; proportion of individuals with a positive result who truly have the disease
Negative predictive value
UNDER DIAGNOSTIC EFFICIENCY:
probability that a negative test result indicates absence of disease; proportion of individuals with a negative result who truly do not have the disease
Pre-analytical 1
UNDER QUALITY ASSESSMENT / QUALITY ASSURANCE:
All steps done PRIOR to sample analysis
include test requisition, patient preparation, patient identification, specimen collection, labeling, specimen transport, specimen reception, handling, and preparation
Analytical 1
UNDER QUALITY ASSESSMENT / QUALITY ASSURANCE:
include reagents, preventive maintenance of equipment, calibration, analysis of samples, and quality control
Quality Control
Special aspect of analytical testing or laboratory testing
Post-analytical 1
UNDER QUALITY ASSESSMENT / QUALITY ASSURANCE:
include verification of calculations and reference ranges, flagging and notification of panic/critical values, delta checks, reporting of results, and interpretation
Delta Check
Means “change”
an algorithm in which a current laboratory result is compared with results obtained on a previous specimen from the same patient
Check if the current result or change in trend agrees with the previous result of the same patient
Pre-analytical 2
These are examples from what errors?
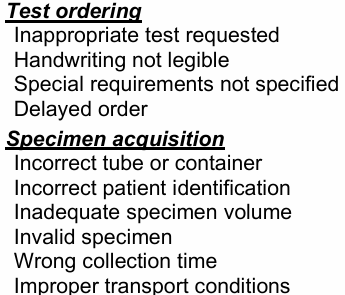
Analytical 2
These are examples from what errors?
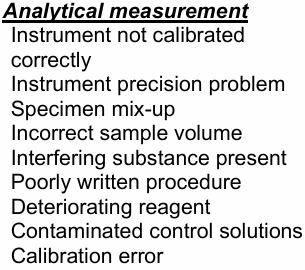
Post-analytical 2
These are examples from what errors?
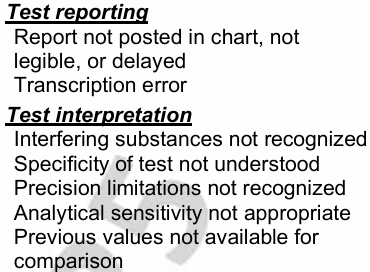
Reliability
UNDER QUALITY CONTROL:
ability to maintain accuracy and precision over an extended period of time during which equipment, reagents, and personnel may change
ACCURACY + PRECISION
Accuracy
UNDER QUALITYCONTROL:
closeness of the result to the true or actual value
Precision
UNDER QUALITYCONTROL:
ability to produce a series of results that agree closely with each other; expressed in terms of CV; also called repeatability / reproducibility
Repeatability
using the same condition; within run position.
The test is repeated with same machine, same patient, same personnel that resulted with same result
Reproducibility
between run position or inter lab; under changed condition.
Test are repeated with different laboratory, different machine, different reagent, and different medtech but resulted with the same result
Important in External Qc
Internal Quality Control
UNDER QUALITY CONTROL:
Involves the analysis of at least 2 levels of control every 24 hours
Initial control limits are established for at least 20 consecutive days
Important for the daily monitoring of accuracy and precision
1 Normal Control and 1 Pathologic Control
The two levels for Internal QC are:
External Quality Assessment
UNDER QUALITY CONTROL:
Involves testing blind samples (unknown concentration of analytes) sent periodically by regulatory agencies to participating laboratories
Important for maintaining long-term accuracy of analytical methods
SDI = (Lab result - Group Mean) / Group SD
Results must be 2 standard deviations away from the mean using a 95% confidence interval
SDI >2 indicates poor performance. It means that laboratory results are outside the confidence interval. It does not agree with other participating laboratory.
National External Quality Assessment Scheme (NEQAS)
is the regulatory agency administered by National Representatives (NRs)
Lung Center of The Philippines
In our country the national reference laboratory for clinical chemistry or biochemistry is the
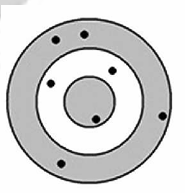
Neither accurate nor precise
This is a representation of:
Precise but not accurate
This is a representation of:
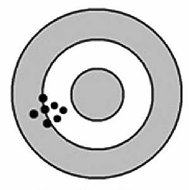
Accurate but not precise
This is a representation of:
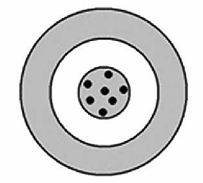
Both accurate and precise
This is a representation of:
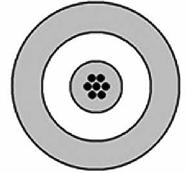
Random Error
UNDER ANALYTICAL VARIATION (TYPES OF ERROR IN LAB TESTING):
“Imprecision“
Due to chance or an unpredictable cause; does not recur in regular pattern
Affects precision; indicated by violation of the 12s, 13s, R4s Westgard rules
Causes: instrument instability e.g. temperature and voltage fluctuations, dirty glassware, sampling error, improper mixing of sample and reagent, operator variability e.g. pipetting error, anticoagulant or drug interference
Systematic Error
UNDER ANALYTICAL VARIATION (TYPES OF ERROR IN LAB TESTING):
“Inaccuracy / Bias”
Recurring error inherent in test procedure; influences observations in one direction
Affects all results; may be constant or proportional
Affects accuracy; indicated by shift, trend, or violation of the 22s, 41s, 81s, and 10x Westgard rules
Causes: deterioration of reagents, change in reagent lot, unstable reagent blanks, calibration error, changes in standard concentration, contaminated control solutions, diminishing lamp power, dirty photometer, faulty ISE, and pipettor maintenance error
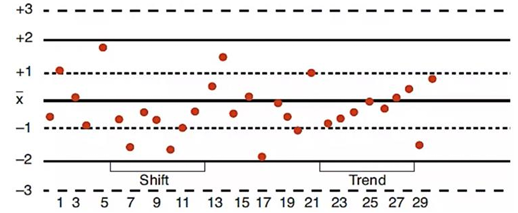
Shift
UNDER ANALYTICAL VARIATION (PATTERNS IN QC CHARTS THAT INDICATE ERRORS):
abrupt change in the distribution of control values such that they accumulation one side of the mean for 6consecutive days; major cause calibration error / error in standard prep.
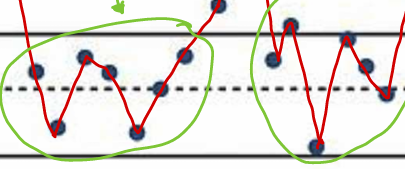
calibration error / error in standard prep.
What is the major cause of Shift?
Upward shift
If the standard is diluted or prepared at a lower concentration, the result will be higher than expected (falsely high/increased).
Downward shift
If the standard is prepared at a higher concentration, the result will be lower than expected (falsely low).
Trend
UNDER ANALYTICAL VARIATION (PATTERNS IN QC CHARTS THAT INDICATE ERRORS):
gradual change in the distribution of control values such that they continue to increase or decrease over a period of 6 consecutive days passing through the mean; major cause deterioration of reagents.
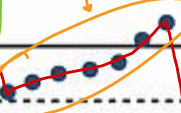
deterioration of reagents.
What is the major cause of Trend?
Outliers (2)
UNDER ANALYTICAL VARIATION (PATTERNS IN QC CHARTS THAT INDICATE ERRORS):
highly deviating control values caused by random or systematic errors.

Systematic Error 2
Shift and Trend are examples of what error? Systematic or Random?
Shewhart Levey-Jennings chart (LJ Chart)
UNDER ANALYTICAL VARIATION (INTERPRETATION OF QUALITY CONTROL RESULTS):
most commonly used QC chart
12s
WESTGARD CONTROL RULES:
One control value exceeds either ±2 SDs from the mean. Warning rule; initiates testing of other rules
ERROR DETECTED:
Used as a warning rule Prompt testing of other control rules
Detects imprecision but still acceptable
DECISION:
ACCEPT
13s
WESTGARD CONTROL RULES:
One control value exceeds either ±3 SDs from the mean.
ERROR DETECTED:
Detects imprecision or systematic bias
DECISION:
REJECT
R4s
WESTGARD CONTROL RULES:
Range between two levels of control within a run exceeds 4SDs
ERROR DETECTED:
Detects imprecision
DECISION:
REJECT
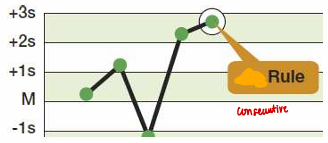
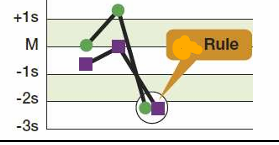
22s
WESTGARD CONTROL RULES:
Two consecutive values or values for two QC samples exceed 2 SDs from the meaning the same direction
ERROR DETECTED:
Bias Inaccuracy
DECISION:
REJECT
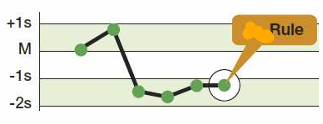
41s
WESTGARD CONTROL RULES:
Four consecutive control values exceed 1SD from the mean.
ERROR DETECTED:
Bias Trend
DECISION:
REJECT
10x̄ (8/12x̄)
WESTGARD CONTROL RULES:
Ten(eight or twelve)consecutive control values are on the same side of the mean
ERROR DETECTED:
Bias Trend
DECISION:
REJECT
12s, 13s, and R4s
These are Westgard Control Rules that are random errors which indicates imprecision
22s, 41s, 81s, and 10x̄
These are Westgard Control Rules that are systematic errors which indicates inaccuracy
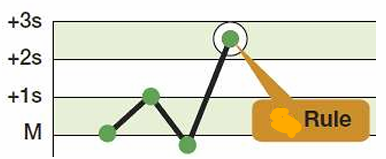
12S Rule
Illustration of what rule?
1 control value is above or below the +/-2S
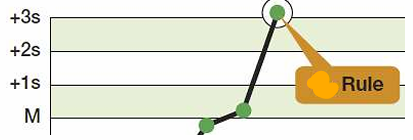
13S Rule
Illustration of what rule?
1 control value is above or below the +/- 3S
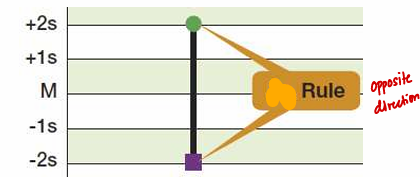
R4S Rule
Illustration of what rule?
The range is 4 SD (+/-2S) away from each other.
Always within a run that involves 2 levels of control.
Do not confuse with 22S
R4S is a one-time error.
22S across runs
Illustration of what rule?
A single level of control
Two consecutive days violation of 12S
22S across controls
Illustration of what rule?
41S across runs
Illustration of what rule?
41S across controls
Illustration of what rule?
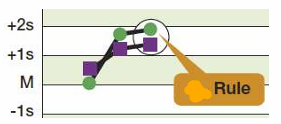
10X across runs
Illustration of what rule?
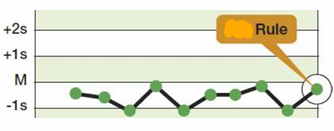
10X across controls
Illustration of what rule?
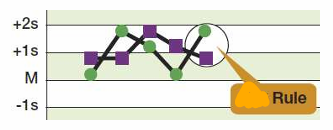
Serum
Preferred sample for most clinical chemistry tests
1000-2000g (RCF)
10 mins.
Preparation for Serum and Plasma:
Liquid portion of clotted or anticoagulated blood prepared by centrifugation at ____________ for __________
glucose, K, PO4, HCO3, Albumin, CK, AST
Serum value > Plasma value: __________________