QC, Calibration, and Proficiency Testing
 Call Kai
 Learn
Learn Practice Test
 Spaced Repetition
 Match
Match Flashcards
 Knowt Play
1/25

There's no tags or description
Looks like no tags are added yet.
Name | Mastery | Learn | Test | Matching | Spaced | Call with Kai | Chat |
|---|
No analytics yet
Send a link to your students to track their progress
26 Terms
What is a calibrator/standard?
a substance with a known concentration or quantity used to calibrate instruments and validate their accuracy
What does calibrating an instrument in the lab do?
it essentially teaches your instrument to read
also establishes a linear ranges for assays
When is calibration performed?
new analyzers
using new lot number of reagents
when recommended by the manufacturers
after QC failures or shifts/trends
What is beer’s law?
a relationship that demonstrates that the concentration of a substance is directly proportional to the amount of light absorbed
What is the analytical measurement range (AMR)?
range of results in which the instrument response and the corresponding value is linear
results outside this range cannot be reported
What is the clinical reportable range (CRR)?
aka extended AMR
extended reportable ranges that include values obtained by sample dilution
List 4 requirements of QC materials
must be similar to the patient specimens being tested
should have long stability (shelf life)
should have little variation between vials of the same lot number
must span normal and abnormal ranges
What is liquid pooled QC material?
pooled patient samples used for QC
What are assayed QC materials?
QC materials that the manufacturer has tested many times to provide a target value and range for the material
saves time and resources but is expensive
What are unassayed QC materials?
QC materials that come with no target values or ranges
individual labs must test their own targets and ranges
time and resource extensive
QC is run several times a day and results over 30 days are collected and ranges are estimated
What is the purpose of a mean value in creating QC targets and interpreting QC data?
the mean acts as a target value for the QC materials
the mean is also the point that is most frequently reported
What is standard deviation?
how widely spread the QC values fall around the mean
high SD = wide variation around the mean
low SD = small variation around the mean
coefficient of variation formula
CV = SD / mean x 100
expressed as a percentage
Generally, QC results in the ___ range are acceptable.
+- 2 SD
Levey Jennings chart
chart that displays how QC values compare to the mean/target value
used to notice and correct a test system error before it affects patient results
What are QC trends?
gradual increases or decreases in QC points
can be caused by reagent deterioration or light source deterioration
What are QC shifts?
abrupt increase or decrease in QC points
usually involves switching from one side of the mean to the other
caused by recalibration, loading a new reagent lot number, or analyzer issues
Causes of random QC errors (7)
operator technique
incorrect reconstitution of QC
not using CLRW
pipetting mistakes (by the tech)
power supply issues
analyzer pipette issues
air bubbles (picked up by the instrument’s pipettor)
What are systemic QC errors, and what causes them to happen?
more significant errors, usually related to the test system or policies and procedures
causes
improperly aligned pipettes in analyzer
unstable temperatures in the analyzer
changing the reagent lot number or calibrator lot number
deterioration of reagents while in use
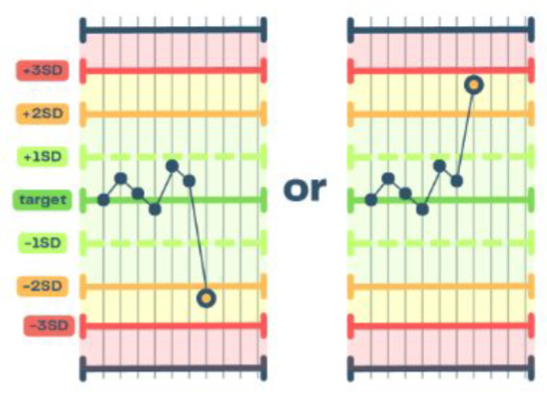
12s Westgard violation
1 QC data point is 2 SDs away from the mean
considered a warning — may indicate random or systemic error
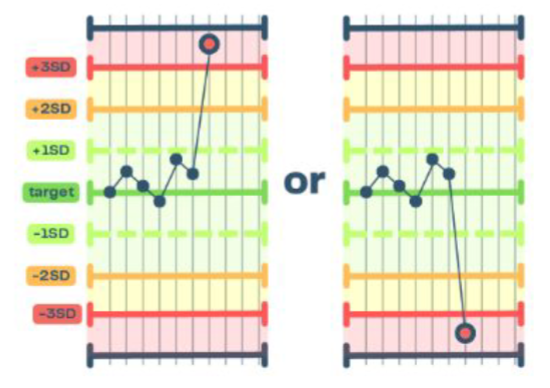
13s Westgard violation
one QC value 3 SDs away
can be due to random error
QC MUST be resolved before continuing patient testing
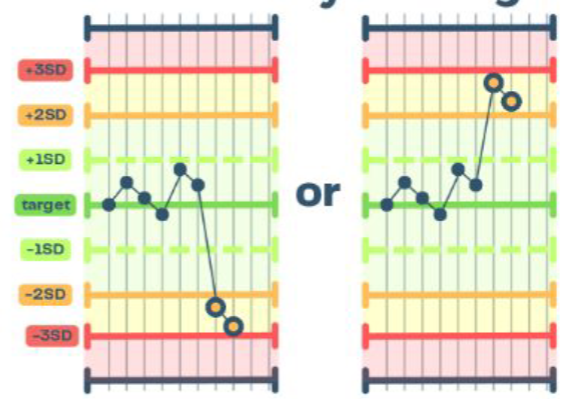
2s2 Westgard violation
2 QC values 2 SDs away
QC failure, must be resolved
41s Westgard violation
4 QC data points 1 SD away
QC failure, must be resolved
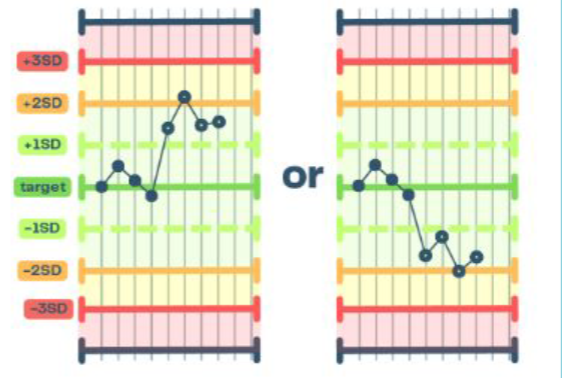
10x Westgard violation
10 QC data points are outside the mean (usually on one side)
QC FAILURE
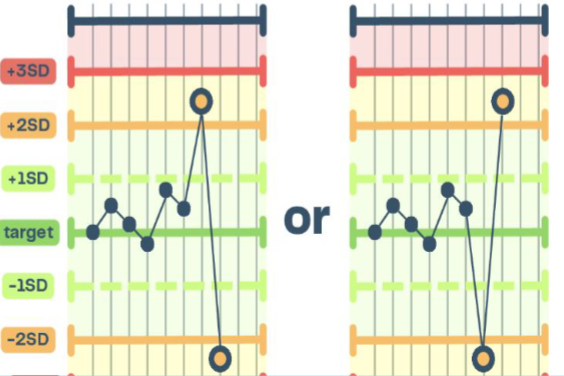
R4s Westgard violation
1 QC data point is +2 SD away and 1 point is -2 SD away in a single run
QC FAILURE
What happens with QC data every month?
the data is submitted to the manufacturer
the manufacturer compiles all results and publishes “peer group” data
a collection of labs performing the same test with the same analyzer using the same QC materials and lot numbers
lab-specific data is compared to peer group data